Detailed Market Structure Breakdown
4-Hour Chart (Macro Trend)
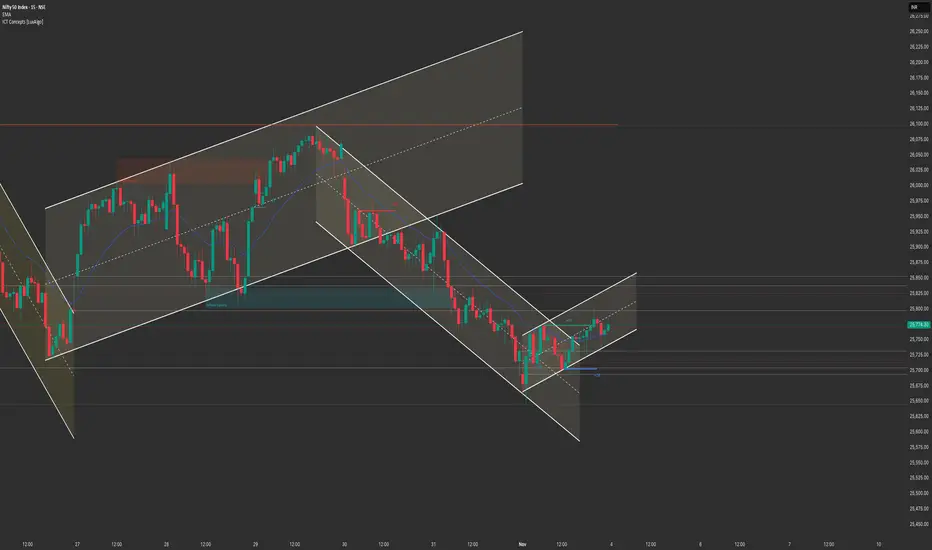
Structure: The Nifty is currently in a Correction/Consolidation Phase within its broader uptrend. The price broke down from the aggressive ascending channel last week and is now attempting to stabilize. The last 4H candle is a Doji-like/small bullish candle, showing indecision but managing to hold the immediate support from the previous day's close.
Key Levels:
Major Supply (Resistance): 25,950 - 26,100. This area (the breakdown high and the "double-top" zone) is the critical overhead hurdle. Sustained trade above 25,950 is essential to revive bullish momentum.
Major Demand (Support): 25,500 - 25,600. This is the most critical support zone, aligning with the 20-day EMA (25,593) and major Fibonacci retracement levels. A decisive close below 25,500 would accelerate selling.
Outlook: The short-term bias is Bearish-to-Range-Bound. A move toward 25,850 - 25,900 is likely to face selling pressure ("sell-on-rise").
1-Hour Chart (Intermediate View)
Structure: The 1H chart shows the price failed to regain its momentum on Monday, remaining confined within the descending channel formed during the correction. The market closed right at the midpoint of this corrective channel.
Key Levels:
Immediate Resistance: 25,850 - 25,900 (Upper boundary of the descending channel).
Immediate Support: 25,700 (Lower boundary of the intraday range).
15-Minute Chart (Intraday View)
Structure: The 15M chart confirms the intraday range-bound action, with the price oscillating between 25,700 and 25,800 for most of the session. The index is trading below the 9-period EMA in the short term, maintaining a cautious stance.
Key Levels:
Intraday Supply: 25,800.
Intraday Demand: 25,700.
Outlook: Neutral-to-Cautious. The primary focus is on a breakout from the 25,700 - 25,800 range.
📈 Structure Analysis & Trade Plan: 4th November
Market Outlook: Nifty is consolidating after snapping a two-day losing streak. The market is expected to remain range-bound with a bearish undertone. The "Sell on Rise" strategy near the upper resistance is favored.
Bearish Scenario (Primary Plan: Sell on Rise/Breakdown)
Justification: The weekly chart shows a "Shooting Star" pattern, and the 4H chart shows a potential "Double-Top" formation near 26,100. The structure favors a move to fill the liquidity gap below.
Entry 1 (Sell on Rise): Short entry on a retest and rejection of the 25,850 - 25,900 level (upper channel resistance).
Entry 2 (Breakdown): Short entry on a decisive break and 15-minute close below 25,700.
Stop Loss (SL): Place a stop loss above 25,960 (above the recent swing high/upper channel).
Targets:
T1: 25,600 (Major support/20-DEMA).
T2: 25,500 (Key macro support).
Bullish Scenario (Counter-Trend/Reversal)
Justification: The broader trend remains positive as long as 25,500 holds. A breakout above the short-term descending channel is needed.
Trigger: A sustained move and close above 26,000.
Entry: Long entry on a confirmed 15-minute close above 26,000.
Stop Loss (SL): Below 25,850.
Targets:
T1: 26,100 (Recent high).
T2: 26,300 (ATH zone/Extension).
Key Levels for Observation:
Immediate Decision Point: 25,700 - 25,850 zone.
Bearish Confirmation: Sustained trade below 25,700.
Bullish Confirmation: A move back above 25,950.
Line in the Sand: 25,500. Below this, the risk of a deep correction increases significantly.
4-Hour Chart (Macro Trend)
Structure: The Nifty is currently in a Correction/Consolidation Phase within its broader uptrend. The price broke down from the aggressive ascending channel last week and is now attempting to stabilize. The last 4H candle is a Doji-like/small bullish candle, showing indecision but managing to hold the immediate support from the previous day's close.
Key Levels:
Major Supply (Resistance): 25,950 - 26,100. This area (the breakdown high and the "double-top" zone) is the critical overhead hurdle. Sustained trade above 25,950 is essential to revive bullish momentum.
Major Demand (Support): 25,500 - 25,600. This is the most critical support zone, aligning with the 20-day EMA (25,593) and major Fibonacci retracement levels. A decisive close below 25,500 would accelerate selling.
Outlook: The short-term bias is Bearish-to-Range-Bound. A move toward 25,850 - 25,900 is likely to face selling pressure ("sell-on-rise").
1-Hour Chart (Intermediate View)
Structure: The 1H chart shows the price failed to regain its momentum on Monday, remaining confined within the descending channel formed during the correction. The market closed right at the midpoint of this corrective channel.
Key Levels:
Immediate Resistance: 25,850 - 25,900 (Upper boundary of the descending channel).
Immediate Support: 25,700 (Lower boundary of the intraday range).
15-Minute Chart (Intraday View)
Structure: The 15M chart confirms the intraday range-bound action, with the price oscillating between 25,700 and 25,800 for most of the session. The index is trading below the 9-period EMA in the short term, maintaining a cautious stance.
Key Levels:
Intraday Supply: 25,800.
Intraday Demand: 25,700.
Outlook: Neutral-to-Cautious. The primary focus is on a breakout from the 25,700 - 25,800 range.
📈 Structure Analysis & Trade Plan: 4th November
Market Outlook: Nifty is consolidating after snapping a two-day losing streak. The market is expected to remain range-bound with a bearish undertone. The "Sell on Rise" strategy near the upper resistance is favored.
Bearish Scenario (Primary Plan: Sell on Rise/Breakdown)
Justification: The weekly chart shows a "Shooting Star" pattern, and the 4H chart shows a potential "Double-Top" formation near 26,100. The structure favors a move to fill the liquidity gap below.
Entry 1 (Sell on Rise): Short entry on a retest and rejection of the 25,850 - 25,900 level (upper channel resistance).
Entry 2 (Breakdown): Short entry on a decisive break and 15-minute close below 25,700.
Stop Loss (SL): Place a stop loss above 25,960 (above the recent swing high/upper channel).
Targets:
T1: 25,600 (Major support/20-DEMA).
T2: 25,500 (Key macro support).
Bullish Scenario (Counter-Trend/Reversal)
Justification: The broader trend remains positive as long as 25,500 holds. A breakout above the short-term descending channel is needed.
Trigger: A sustained move and close above 26,000.
Entry: Long entry on a confirmed 15-minute close above 26,000.
Stop Loss (SL): Below 25,850.
Targets:
T1: 26,100 (Recent high).
T2: 26,300 (ATH zone/Extension).
Key Levels for Observation:
Immediate Decision Point: 25,700 - 25,850 zone.
Bearish Confirmation: Sustained trade below 25,700.
Bullish Confirmation: A move back above 25,950.
Line in the Sand: 25,500. Below this, the risk of a deep correction increases significantly.
Aviso legal
As informações e publicações não devem ser e não constituem conselhos ou recomendações financeiras, de investimento, de negociação ou de qualquer outro tipo, fornecidas ou endossadas pela TradingView. Leia mais em Termos de uso.
Aviso legal
As informações e publicações não devem ser e não constituem conselhos ou recomendações financeiras, de investimento, de negociação ou de qualquer outro tipo, fornecidas ou endossadas pela TradingView. Leia mais em Termos de uso.