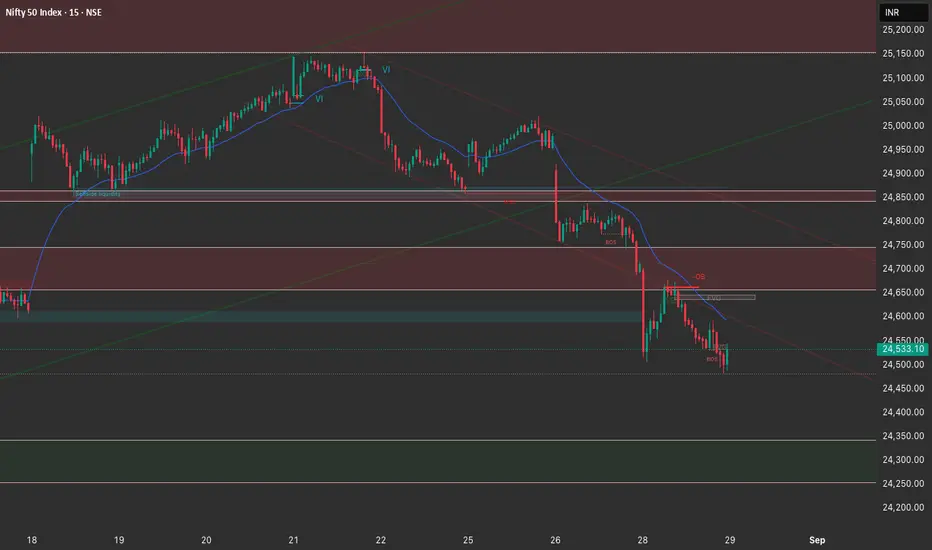
🔹 4H Chart (Swing Bias)
Clear bearish market structure: Multiple consecutive red candles post 25,000 rejection.
Fair Value Gap (FVG) left around 24,700–24,800 → potential sell-on-rally zone.
Price broke structure and is respecting the descending channel.
Current price near 24,500 support, but next major demand is around 24,300–24,250.
EMA slope is pointing down → confirms bearish control.
✅ Bias: Bearish | Swing resistance at 24,750–24,800 | Demand near 24,300
🔹 1H Chart (Intraday Bias)
Market has printed multiple Break of Structures (BOS) confirming lower highs and lower lows.
Short-term FVG between 24,650–24,700 (ideal short re-entry area).
Current candles hovering around 24,500 handle with weak reaction → suggests liquidity is being built before another drop.
EMA acting as dynamic resistance, aligning with supply zones.
✅ Bias: Bearish | Resistance at 24,650–24,700 | Weak support at 24,480
🔹 15M Chart (Execution Window)
Price rejected from micro order block around 24,600.
BOS printed downside again towards 24,500, confirming intraday weakness.
Liquidity resting below 24,480 → 24,450; sweep likely.
Next liquidity pool lies at 24,300 zone.
Very short-term relief bounces may occur, but they’re inside a bearish intraday trend channel.
✅ Bias: Bearish | Short-term rallies capped at 24,600 | Liquidity target 24,450 → 24,300
📝 Trade Plan for 29th August
🔴 Primary Bias: Short the rallies (high probability)
Entry Zone: 24,650–24,700 (into FVG + supply)
Stop Loss: Above 24,800
Targets:
T1 → 24,500
T2 → 24,350
T3 → 24,300
🟢 Countertrend Play: Long from demand sweep (only if strong reversal candles form)
Entry Zone: 24,300–24,350 (demand rejection)
Stop Loss: Below 24,200
Targets:
T1 → 24,500
T2 → 24,650
✅ Summary:
Main plan: Sell on rallies towards 24,650–24,700.
Alternate plan: Only long if 24,300 demand holds with a bullish reaction.
Overall: Trend & liquidity favors downside.
Aviso legal
As informações e publicações não se destinam a ser, e não constituem, conselhos ou recomendações financeiras, de investimento, comerciais ou de outro tipo fornecidos ou endossados pela TradingView. Leia mais nos Termos de Uso.
Aviso legal
As informações e publicações não se destinam a ser, e não constituem, conselhos ou recomendações financeiras, de investimento, comerciais ou de outro tipo fornecidos ou endossados pela TradingView. Leia mais nos Termos de Uso.
