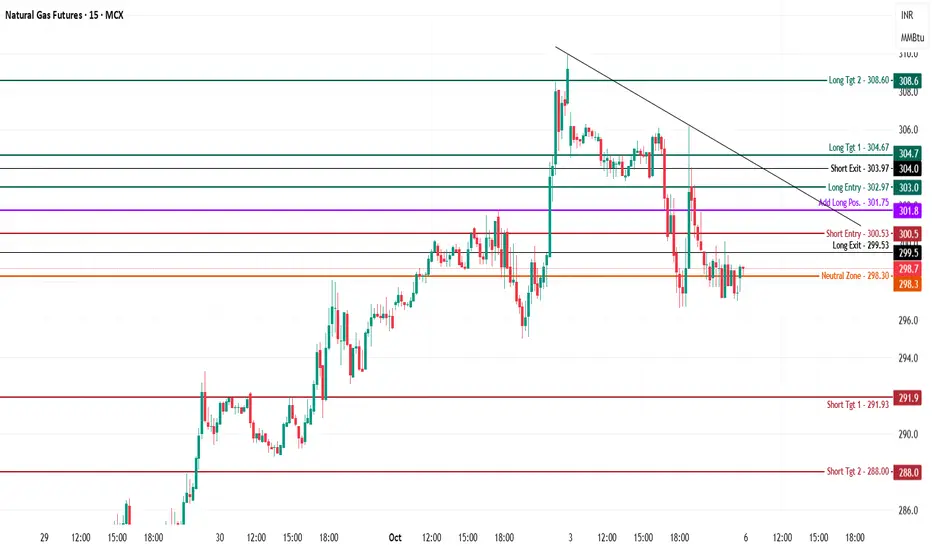
Natural Gas is trading at 298.7, consolidating below recent resistance and major supply after a minor downtrend, with price action holding around the neutral zone and awaiting a directional breakout.
Bullish (Long) Setup
Long Entry (303.0):
Initiate long trades above 303.0, which signals a breakout over the recent resistance and descending trendline, confirming buyers retaking control.
Additional exposure can be added near 301.75 if dips are bought and price forms a higher low.
Upside Targets:
304.7 (Target 1): Immediate supply and intraday high—key zone for partial booking.
308.6 (Target 2): The extended bullish target in case of strong momentum, mapping to higher channel resistance.
Stop Loss:
Place just below 299.5 (long exit level) or 298.3 (neutral zone) to contain risk from false breakouts.
Bearish (Short) Setup
Short Entry (300.5):
Shorts become actionable below 300.5, on sustained failure to reclaim resistance, giving further advantage to sellers.
Downside Targets:
291.9 (Target 1): Previous low and first major support area where covering may occur.
288.0 (Target 2): Deeper extension, marking aggressive selling or stop-loss sweep area.
Stop Loss:
Place above 301.8 (add-long band) to avoid losses on failed breakdowns.
Range/Neutral Logic
Neutral Zone (298.3):
Price consolidating in this area denotes indecision—await a clear breakout or breakdown before committing to trend trades.
Sustained acceptance above 303 confirms bulls; below 299.5 risks further slide.
Technical Chart Analyst
Track: Indian & US Markets
Indices | Commodities | Crypto
Telegram: @ChartPathik for NSE & MCX
& @ChartPathik_Global for US Ins. & Crypto
WhatsApp: +91-99293-91467 for updates.
Track: Indian & US Markets
Indices | Commodities | Crypto
Telegram: @ChartPathik for NSE & MCX
& @ChartPathik_Global for US Ins. & Crypto
WhatsApp: +91-99293-91467 for updates.
Aviso legal
As informações e publicações não devem ser e não constituem conselhos ou recomendações financeiras, de investimento, de negociação ou de qualquer outro tipo, fornecidas ou endossadas pela TradingView. Leia mais em Termos de uso.