LTIMINDTREE: The Big Squeeze! ⚡ Which Way? 🐂🐻
Timeframe: Daily
Trade Type: Swing/Positional
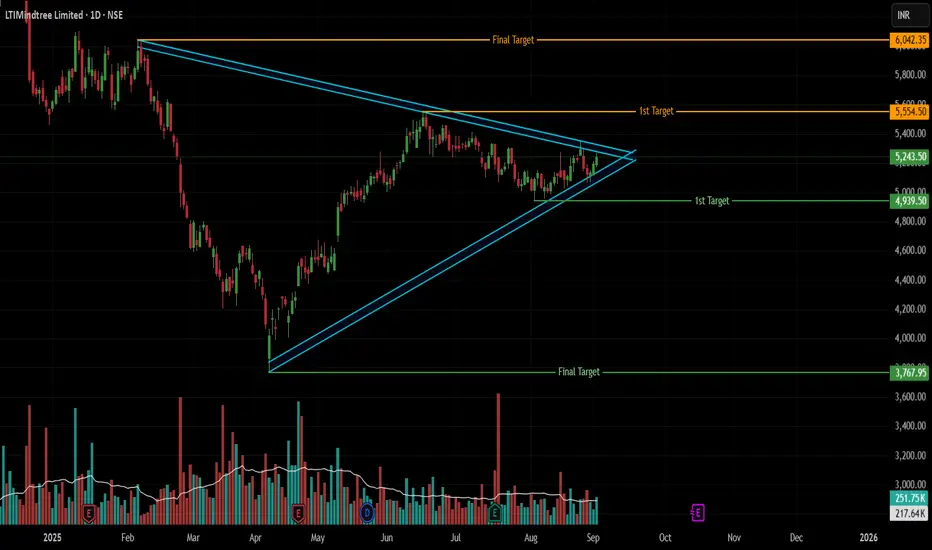
Pure Price Action Setup: LTIMINDTREE is compressing into a textbook Symmetrical Triangle on the daily chart. This is a classic consolidation pattern where the market is building energy for a significant breakout. Volatility is collapsing into a tight apex!
Key Decision Levels:
Bullish Trigger: A decisive daily close above 5350 (the recent upper trendline resistance).
Bearish Trigger: A decisive daily close below 5067 (the rising lower trendline support).
The Trade Plan:
👉 BULLISH BREAKOUT Scenario 🐂
Entry: On a close above 5350.
Confirmation: A significant increase in volume on the breakout candle should confirm buyer commitment.
Target 1: 5554 (Previous major high)
Final Target: 6042 (All-Time High & Pattern Confluence)
SL: Below the breakout candle or the lower trendline.
👉 BEARISH BREAKDOWN Scenario 🐻
Entry: On a close below 5067.
Confirmation: A noticeable spike in volume on the breakdown would validate seller dominance.
Target 1: 4939 (Initial support zone)
Final Target: 3767 (Major Swing Low & Pattern Confluence)
SL: Above the breakdown candle or the upper trendline.
Pattern Depth & Significance:
The triangle's maximum depth is measured from its origin: the high of 6042 (Feb 5) to the low of 3767 (Apr 7).
This is a 2,275-point range.
In percentage terms, that's a ~60.3% move from high to low.
Why this matters: The energy stored in a pattern of this scale suggests the resulting breakout could be powerful and sustained. Always trail your stop loss after Target 1 is hit! 🔒
Risk Management is NON-NEGOTIABLE!
This is a high-risk, high-reward setup. Your stop loss is your best friend.
📜 Disclaimer: This is an educational example of technical analysis and NOT financial advice. Trading carries a high level of risk. You should consider whether you can afford to take the risk of loss. Perform your own research before making any trade decisions.
Like & Boost if this clear analysis helps you! ✅
Follow for more pure price action trade ideas! 😊
Timeframe: Daily
Trade Type: Swing/Positional
Pure Price Action Setup: LTIMINDTREE is compressing into a textbook Symmetrical Triangle on the daily chart. This is a classic consolidation pattern where the market is building energy for a significant breakout. Volatility is collapsing into a tight apex!
Key Decision Levels:
Bullish Trigger: A decisive daily close above 5350 (the recent upper trendline resistance).
Bearish Trigger: A decisive daily close below 5067 (the rising lower trendline support).
The Trade Plan:
👉 BULLISH BREAKOUT Scenario 🐂
Entry: On a close above 5350.
Confirmation: A significant increase in volume on the breakout candle should confirm buyer commitment.
Target 1: 5554 (Previous major high)
Final Target: 6042 (All-Time High & Pattern Confluence)
SL: Below the breakout candle or the lower trendline.
👉 BEARISH BREAKDOWN Scenario 🐻
Entry: On a close below 5067.
Confirmation: A noticeable spike in volume on the breakdown would validate seller dominance.
Target 1: 4939 (Initial support zone)
Final Target: 3767 (Major Swing Low & Pattern Confluence)
SL: Above the breakdown candle or the upper trendline.
Pattern Depth & Significance:
The triangle's maximum depth is measured from its origin: the high of 6042 (Feb 5) to the low of 3767 (Apr 7).
This is a 2,275-point range.
In percentage terms, that's a ~60.3% move from high to low.
Why this matters: The energy stored in a pattern of this scale suggests the resulting breakout could be powerful and sustained. Always trail your stop loss after Target 1 is hit! 🔒
Risk Management is NON-NEGOTIABLE!
This is a high-risk, high-reward setup. Your stop loss is your best friend.
📜 Disclaimer: This is an educational example of technical analysis and NOT financial advice. Trading carries a high level of risk. You should consider whether you can afford to take the risk of loss. Perform your own research before making any trade decisions.
Like & Boost if this clear analysis helps you! ✅
Follow for more pure price action trade ideas! 😊
Aviso legal
The information and publications are not meant to be, and do not constitute, financial, investment, trading, or other types of advice or recommendations supplied or endorsed by TradingView. Read more in the Terms of Use.
Aviso legal
The information and publications are not meant to be, and do not constitute, financial, investment, trading, or other types of advice or recommendations supplied or endorsed by TradingView. Read more in the Terms of Use.