Educational context only. Not financial advice.
What the HUD shows
Gold has pushed higher in recent months. The HUD now shows a shift into compression,
meaning momentum has cooled and the internal rhythm has leveled off. You often see this first in the phase structure before it shows up in price.
What phase 2 usually tells you
Phase 2 is a neutral, reorganizing state. Typical behavior includes:
It doesn’t lean bullish or bearish. It just reflects a market that’s taking a breather.
Regime vs. Phase
A bullish regime sets the broader environment. Phase 2 shows that short-term momentum isn’t pushing strongly right now.
Together, this often results in slower, less expressive movement even if the larger trend remains intact.
Why this matters
Structural shifts tend to appear earlier in regime/phase behavior than in candles alone.
The HUD simply makes that visible: no signals, no predictions, just context.
What this chart illustrates
This is purely contextual information and does not imply future direction.
Disclaimer
This post is for educational and analytical purposes only.
It does not provide trading signals, financial advice, or predictions.
All observations describe structural market conditions only.
© 2025 Inratios. Market Framework Model (MFM) protected via BOIP i-Depot #155670.
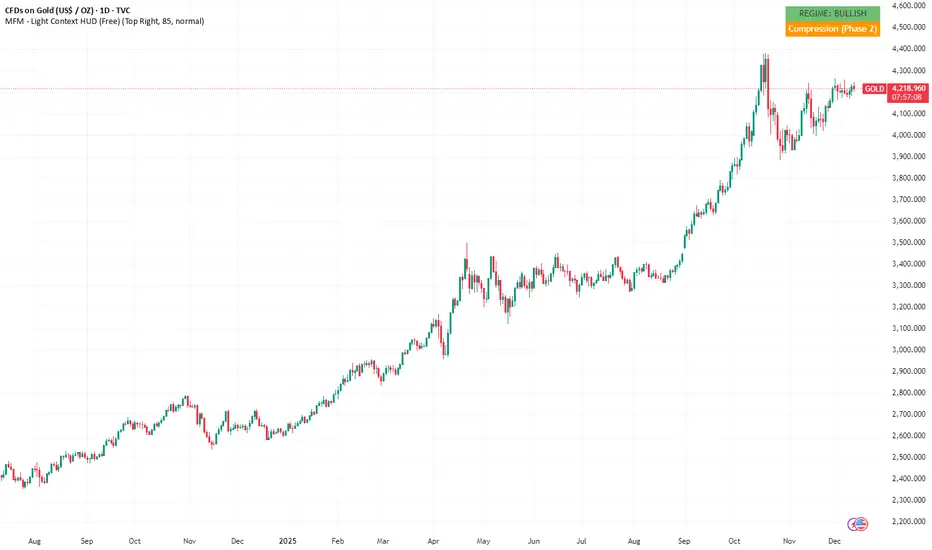
What the HUD shows
- Regime: Bullish (higher-timeframe momentum supportive)
- Phase: Phase 2: Compression
- No signals or forecasts
Gold has pushed higher in recent months. The HUD now shows a shift into compression,
meaning momentum has cooled and the internal rhythm has leveled off. You often see this first in the phase structure before it shows up in price.
What phase 2 usually tells you
Phase 2 is a neutral, reorganizing state. Typical behavior includes:
- tighter ranges
- slowing momentum
- less directional pressure
- reorganizing momentum rather than accelerating or reversing
It doesn’t lean bullish or bearish. It just reflects a market that’s taking a breather.
Regime vs. Phase
A bullish regime sets the broader environment. Phase 2 shows that short-term momentum isn’t pushing strongly right now.
Together, this often results in slower, less expressive movement even if the larger trend remains intact.
Why this matters
Structural shifts tend to appear earlier in regime/phase behavior than in candles alone.
The HUD simply makes that visible: no signals, no predictions, just context.
What this chart illustrates
- A strong trend behind us
- A shift into structural compression
- A neutral internal state inside a supportive macro backdrop
This is purely contextual information and does not imply future direction.
Disclaimer
This post is for educational and analytical purposes only.
It does not provide trading signals, financial advice, or predictions.
All observations describe structural market conditions only.
© 2025 Inratios. Market Framework Model (MFM) protected via BOIP i-Depot #155670.
I study market structure and how regimes, phases, and momentum shape market behavior. Educational context only; not financial advice. Creator of MFM.
mfm.inratios.com
mfm.inratios.com
Publicações relacionadas
Aviso legal
As informações e publicações não se destinam a ser, e não constituem, conselhos ou recomendações financeiras, de investimento, comerciais ou de outro tipo fornecidos ou endossados pela TradingView. Leia mais nos Termos de Uso.