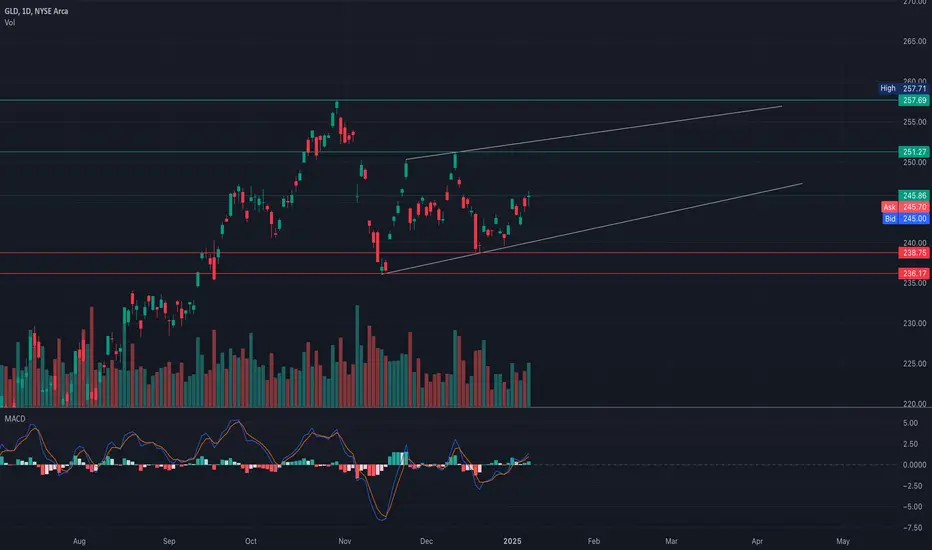
Daily Chart Analysis:
* Trend: GLD is trading within an ascending channel, with higher lows and higher highs forming a bullish structure. The price is approaching the upper resistance line near $257.71, indicating a potential test of this level.
* Support Levels:
* $245.86: Current price zone showing consolidation.
* $238.75: Key swing low, acting as a strong support level.
* $236.17: Major support to watch if a bearish breakdown occurs.
* Resistance Levels:
* $251.27: Intermediate resistance before testing the channel high.
* $257.71: Upper channel resistance.
* Indicators:
* MACD: The MACD is showing bullish momentum with a crossover above the signal line, indicating potential upward continuation.
* Volume: Increasing volume on bullish days suggests strong buyer interest.
30-Min Chart Analysis:

* Gamma Exposure (GEX) Levels:
* $246.45: Highest positive NET GEX and CALL Resistance (Gamma Wall). If the price breaks above, expect bullish continuation.
* $245: Current price zone with balanced sentiment, acting as a pivot level.
* $242.5: Major support near the 3rd PUT Wall, indicating strong buyer interest at this level.
* $241: PUT Support and likely defensive zone if selling intensifies.
* $239: Secondary PUT Wall, representing a key defense point.
* Volume Profile:
* Point of Control (POC): Near $245.69, confirming this as a high-volume price level and significant short-term support.
Trade Scenarios:
Bullish Scenario:
* Entry: Above $246.50 (gamma resistance breakout).
* Target: $250 and $257.70.
* Stop-Loss: Below $245.
Bearish Scenario:
* Entry: Below $244.
* Target: $242 and $239.
* Stop-Loss: Above $246.50.
Directional Bias:
* The overall trend remains bullish within the ascending channel on the daily timeframe. However, watch for a breakout above $246.50 for confirmation of further upside. A failure to hold above $245 could lead to a short-term pullback toward $241.
Disclaimer:
This analysis is for educational purposes only and should not be taken as financial advice. Please conduct your own research and manage risk appropriately.
* Trend: GLD is trading within an ascending channel, with higher lows and higher highs forming a bullish structure. The price is approaching the upper resistance line near $257.71, indicating a potential test of this level.
* Support Levels:
* $245.86: Current price zone showing consolidation.
* $238.75: Key swing low, acting as a strong support level.
* $236.17: Major support to watch if a bearish breakdown occurs.
* Resistance Levels:
* $251.27: Intermediate resistance before testing the channel high.
* $257.71: Upper channel resistance.
* Indicators:
* MACD: The MACD is showing bullish momentum with a crossover above the signal line, indicating potential upward continuation.
* Volume: Increasing volume on bullish days suggests strong buyer interest.
30-Min Chart Analysis:
* Gamma Exposure (GEX) Levels:
* $246.45: Highest positive NET GEX and CALL Resistance (Gamma Wall). If the price breaks above, expect bullish continuation.
* $245: Current price zone with balanced sentiment, acting as a pivot level.
* $242.5: Major support near the 3rd PUT Wall, indicating strong buyer interest at this level.
* $241: PUT Support and likely defensive zone if selling intensifies.
* $239: Secondary PUT Wall, representing a key defense point.
* Volume Profile:
* Point of Control (POC): Near $245.69, confirming this as a high-volume price level and significant short-term support.
Trade Scenarios:
Bullish Scenario:
* Entry: Above $246.50 (gamma resistance breakout).
* Target: $250 and $257.70.
* Stop-Loss: Below $245.
Bearish Scenario:
* Entry: Below $244.
* Target: $242 and $239.
* Stop-Loss: Above $246.50.
Directional Bias:
* The overall trend remains bullish within the ascending channel on the daily timeframe. However, watch for a breakout above $246.50 for confirmation of further upside. A failure to hold above $245 could lead to a short-term pullback toward $241.
Disclaimer:
This analysis is for educational purposes only and should not be taken as financial advice. Please conduct your own research and manage risk appropriately.
Aviso legal
As informações e publicações não devem ser e não constituem conselhos ou recomendações financeiras, de investimento, de negociação ou de qualquer outro tipo, fornecidas ou endossadas pela TradingView. Leia mais em Termos de uso.
Aviso legal
As informações e publicações não devem ser e não constituem conselhos ou recomendações financeiras, de investimento, de negociação ou de qualquer outro tipo, fornecidas ou endossadas pela TradingView. Leia mais em Termos de uso.