Viés de alta
DAX on the Weekly chart, more bullish pressure by ThinkingAntsOk
Use this as a guide to develop your view of the situation.
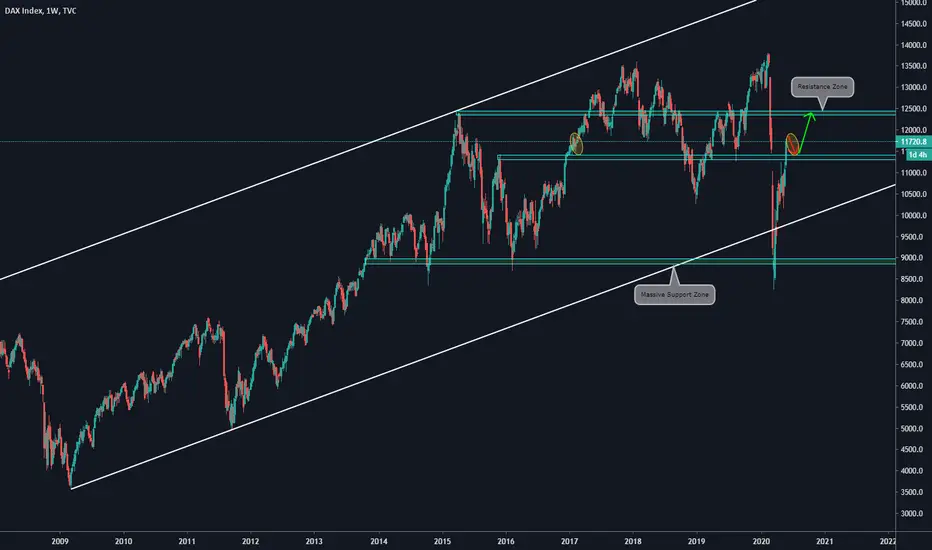
Main items we can see on the Weekly Chart:
a)The price broke with a bullish movement a previous Resistance Zone
b)Taking a look into the past, we can see a similar bullish movement than the current one
c)Using it as something to copy, we will wait for a correction on the current area
d)After that, we will set a long trade towards 12350
e)Of course, we will develop our setup on a lower timeframe, such as 4hs /1h. Use this chart as an idea of how long you should wait before the movement.
Aviso legal
As informações e publicações não devem ser e não constituem conselhos ou recomendações financeiras, de investimento, de negociação ou de qualquer outro tipo, fornecidas ou endossadas pela TradingView. Leia mais em Termos de uso.
Aviso legal
As informações e publicações não devem ser e não constituem conselhos ou recomendações financeiras, de investimento, de negociação ou de qualquer outro tipo, fornecidas ou endossadas pela TradingView. Leia mais em Termos de uso.