All Plotted and Mentioned on Chart.
Color code:
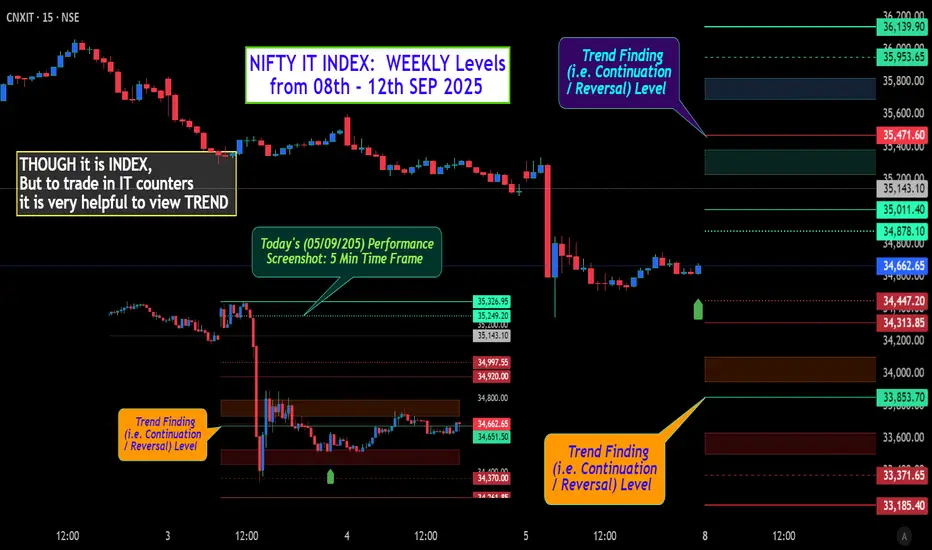
Green =. Positive bias.
Red =. Negative bias.
RED in Between Green means Trend Finder / Momentum Change
/ CYCLE Change and Vice Versa.
Notice One thing: HOW LEVELS are Working.
Use any Momentum Indicator / Oscillatoror as you "USED to" to Take entry.
Disclaimer: Study Purpose only.
Color code:
Green =. Positive bias.
Red =. Negative bias.
RED in Between Green means Trend Finder / Momentum Change
/ CYCLE Change and Vice Versa.
Notice One thing: HOW LEVELS are Working.
Use any Momentum Indicator / Oscillatoror as you "USED to" to Take entry.
Disclaimer: Study Purpose only.
Trade ativo
NIFTY IT INDEX @ 35157: Inching Towards Hurdle Zone #1 after testing ST BUY Level placed @ 35011.40.Happy trading.
Trade fechado: objetivo atingido
This index Crossed Top Weekly Level @ 36139.9 and treat this level as SUPPORT in Last 6-7 Candle(15 Min TF)Publicações relacionadas
Aviso legal
As informações e publicações não devem ser e não constituem conselhos ou recomendações financeiras, de investimento, de negociação ou de qualquer outro tipo, fornecidas ou endossadas pela TradingView. Leia mais em Termos de uso.
Publicações relacionadas
Aviso legal
As informações e publicações não devem ser e não constituem conselhos ou recomendações financeiras, de investimento, de negociação ou de qualquer outro tipo, fornecidas ou endossadas pela TradingView. Leia mais em Termos de uso.