Bitcoin - Clean chart that outlines the next leg up seamlessly!
The Bitcoin chart is crystal clear, simple, and very bullish.
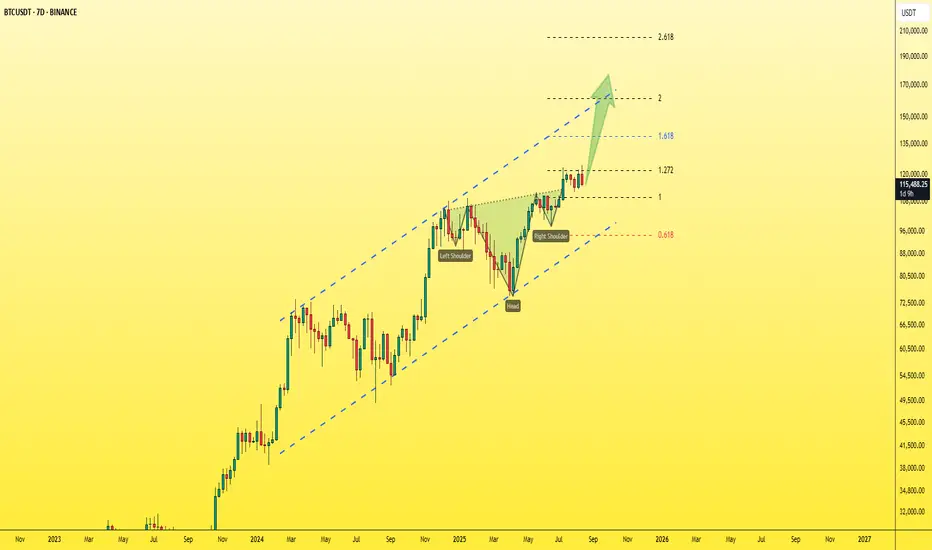
We’ve talked about it over and over, and we’ve always said that 120K is a confirmed target — and now that it’s been hit, I’m telling you the next stop is 150K.
We’ve got a reverse Head & Shoulders pattern, the neckline has been broken, and price is now retesting it.
BTC also broke its previous ATH at 109,500 and is on its way to retest it right now.
All of this on the weekly chart are strong bullish signals that will at least push price to the upper side of the Ascending Channel that we’ve been tracking. Plus, the projection target of the reversal H&S perfectly aligns with this outlook — no coincidence here.
👉 150K is the next station. 🚀
Best regards:
Ceciliones🎯
Trade ativo
All of this is just a retest of the neckline of the inverse Head & Shoulders pattern, and it might revisit the 1.0 Fibonacci zone again. These are just normal price fluctuations, but the overall trend remains bullish, and the price is still on track to hit 150k, just like I mentioned.🔻 free telegram channel🔻
t.me/itradeoncrypto
🎯contact us For VIP services🎯
t.me/Cecilion1
t.me/itradeoncrypto
🎯contact us For VIP services🎯
t.me/Cecilion1
Aviso legal
As informações e publicações não devem ser e não constituem conselhos ou recomendações financeiras, de investimento, de negociação ou de qualquer outro tipo, fornecidas ou endossadas pela TradingView. Leia mais em Termos de uso.
🔻 free telegram channel🔻
t.me/itradeoncrypto
🎯contact us For VIP services🎯
t.me/Cecilion1
t.me/itradeoncrypto
🎯contact us For VIP services🎯
t.me/Cecilion1
Aviso legal
As informações e publicações não devem ser e não constituem conselhos ou recomendações financeiras, de investimento, de negociação ou de qualquer outro tipo, fornecidas ou endossadas pela TradingView. Leia mais em Termos de uso.