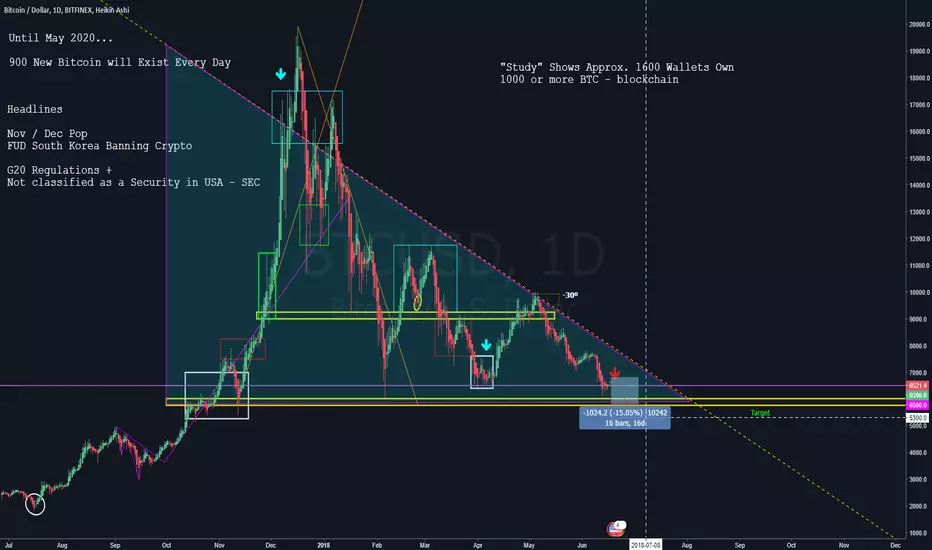
Here we can observe a Triangle Formation with many large Bearish candlesticks and occasional high volatility causes price to swing up to psychological areas on the chart.
Detailed Description to be created June 19
I appreciate you like this Technical Analysis!
I am not a Financial Advisor and you must accept full responsibility for any investment decisions you make with real money... Practice
Detailed Description to be created June 19
I appreciate you like this Technical Analysis!
I am not a Financial Advisor and you must accept full responsibility for any investment decisions you make with real money... Practice
Aviso legal
As informações e publicações não se destinam a ser, e não constituem, conselhos ou recomendações financeiras, de investimento, comerciais ou de outro tipo fornecidos ou endossados pela TradingView. Leia mais nos Termos de Uso.
Aviso legal
As informações e publicações não se destinam a ser, e não constituem, conselhos ou recomendações financeiras, de investimento, comerciais ou de outro tipo fornecidos ou endossados pela TradingView. Leia mais nos Termos de Uso.