🔎 Bank Nifty Market Structure
4H Chart
Price is trading around 54,100, after rejecting the 54,400–54,500 supply zone (FVG).
A rising channel structure is visible, but today’s rejection candle shows weakness.
Strong demand still lies at 53,600–53,400 zone (green block).
👉 Overall bias: Neutral to mildly bearish unless 54,400 is reclaimed convincingly.
1H Chart
Market structure shows:
A recent Market Structure Shift (MSS) at ~54,200.
Current price is hovering inside a demand block / FVG around 54,000–53,950.
Upside supply remains intact at 54,400–54,500.
Break of 53,950 could accelerate selling pressure.
👉 Short-term structure: Range between 53,950–54,400.
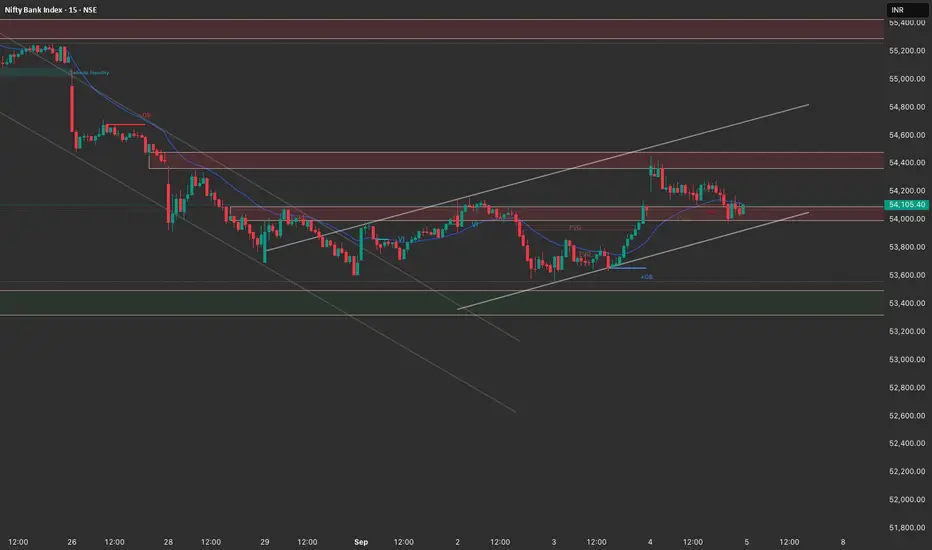
15M Chart
Intraday price action shows repeated rejections from 54,300–54,400.
Price is consolidating above a micro demand zone at 54,000.
Clean liquidity gap remains below at 53,800–53,600.
👉 Intraday tone: Bearish bias if 54,000 breaks, otherwise chop.
📌 Trade Plan for 5th September
Scenario 1: Bearish Continuation
Trigger: Breakdown below 54,000 with momentum.
Entry: Short on 53,980–54,000 break.
Targets:
T1 = 53,800
T2 = 53,600 (major demand zone)
Stop Loss: 54,200 (above supply/FVG).
Scenario 2: Bullish Relief Rally
Trigger: Strong rejection candle from 54,000–53,950 zone.
Entry: Long above 54,100.
Targets:
T1 = 54,300
T2 = 54,400–54,500 (supply zone, book profits here)
Stop Loss: 53,900.
Key Notes
Market is in a tight range (53,950–54,400).
Best trades will come from range extremes: short at supply, long at demand.
Avoid chasing in the middle zone; let price confirm with structure.
✅ Bias for Tomorrow (5th Sept):
Slightly bearish unless Bank Nifty reclaims 54,400+. High-probability short trades if 54,000 breaks.
4H Chart
Price is trading around 54,100, after rejecting the 54,400–54,500 supply zone (FVG).
A rising channel structure is visible, but today’s rejection candle shows weakness.
Strong demand still lies at 53,600–53,400 zone (green block).
👉 Overall bias: Neutral to mildly bearish unless 54,400 is reclaimed convincingly.
1H Chart
Market structure shows:
A recent Market Structure Shift (MSS) at ~54,200.
Current price is hovering inside a demand block / FVG around 54,000–53,950.
Upside supply remains intact at 54,400–54,500.
Break of 53,950 could accelerate selling pressure.
👉 Short-term structure: Range between 53,950–54,400.
15M Chart
Intraday price action shows repeated rejections from 54,300–54,400.
Price is consolidating above a micro demand zone at 54,000.
Clean liquidity gap remains below at 53,800–53,600.
👉 Intraday tone: Bearish bias if 54,000 breaks, otherwise chop.
📌 Trade Plan for 5th September
Scenario 1: Bearish Continuation
Trigger: Breakdown below 54,000 with momentum.
Entry: Short on 53,980–54,000 break.
Targets:
T1 = 53,800
T2 = 53,600 (major demand zone)
Stop Loss: 54,200 (above supply/FVG).
Scenario 2: Bullish Relief Rally
Trigger: Strong rejection candle from 54,000–53,950 zone.
Entry: Long above 54,100.
Targets:
T1 = 54,300
T2 = 54,400–54,500 (supply zone, book profits here)
Stop Loss: 53,900.
Key Notes
Market is in a tight range (53,950–54,400).
Best trades will come from range extremes: short at supply, long at demand.
Avoid chasing in the middle zone; let price confirm with structure.
✅ Bias for Tomorrow (5th Sept):
Slightly bearish unless Bank Nifty reclaims 54,400+. High-probability short trades if 54,000 breaks.
Aviso legal
As informações e publicações não devem ser e não constituem conselhos ou recomendações financeiras, de investimento, de negociação ou de qualquer outro tipo, fornecidas ou endossadas pela TradingView. Leia mais em Termos de uso.
Aviso legal
As informações e publicações não devem ser e não constituem conselhos ou recomendações financeiras, de investimento, de negociação ou de qualquer outro tipo, fornecidas ou endossadas pela TradingView. Leia mais em Termos de uso.