Detailed Market Structure Breakdown
4-Hour Chart (Macro Trend)
Structure: The long-term trend is still bullish, but the price has broken below its immediate ascending channel and has entered a corrective phase. The Bank Nifty has retraced nearly to the 38.2% Fibonacci retracement of its recent rally (according to external analysis) and is testing the major demand zone at 54,800 - 55,200.
Key Levels:
Major Supply (Resistance): 55,400 - 55,500. This area is the first major hurdle for bulls to reclaim, aligning with the broken lower channel line.
Major Demand (Support): 54,800 - 55,000. This is the key "line in the sand." A sustained break below 54,800 would signal a deeper correction towards 54,600 and potentially 54,000.
Outlook: The market is at a make-or-break point. A failure to hold 54,800 will accelerate the short-term bearish trend.
1-Hour Chart (Intermediate View)
Structure: The 1H chart shows a clear MSS (Market Structure Shift) to the downside. The price is trading within a descending channel and has broken the 55,200 support zone. It is currently testing the lower end of the corrective channel.
Key Levels:
Immediate Resistance: 55,200. This area now acts as a strong supply zone, aligning with the red box on the chart.
Immediate Support: 54,800. This is the most important level for intraday support.
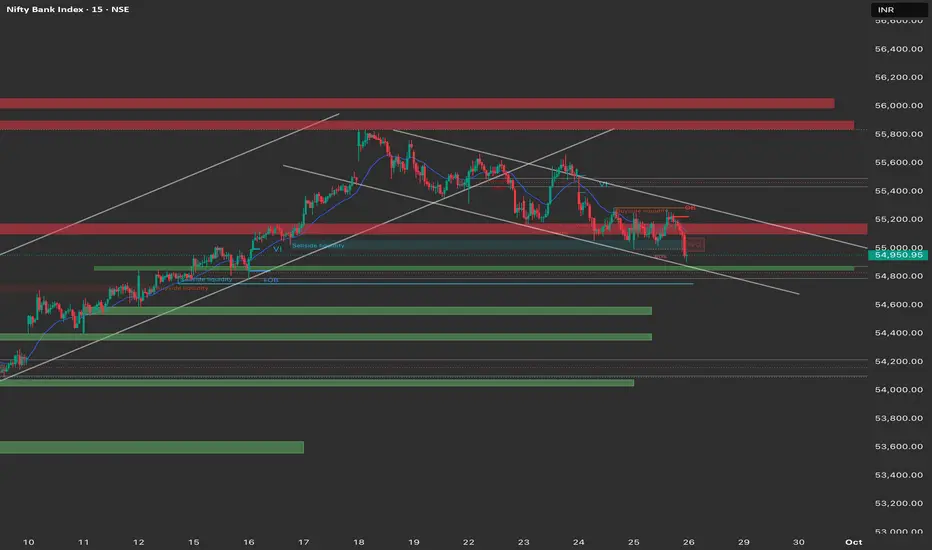
15-Minute Chart (Intraday View)
Structure: The 15M chart shows the Bank Nifty consolidating near its low. The price has recently tested the 54,800 support and is attempting a small bounce, but the overall momentum is still guided by the downtrend channel.
Key Levels:
Intraday Supply: 55,200 (Order Block and consolidation high).
Intraday Demand: 54,800 - 54,900. This zone must hold for any intraday recovery.
Outlook: The intraday bias is bearish. A "sell on rise" approach is favored, targeting a rejection near 55,200.
Trade Plan (Friday, 26th September)
Market Outlook: The Bank Nifty is under short-term bearish pressure but is sitting on strong macro support. The best strategy is to be reactive to the levels.
Bearish Scenario (Primary Plan)
Justification: The market is in a short-term downtrend, and a breakdown of the major 54,800 support will confirm a deeper correction.
Entry: Look for a short entry if the price retests the 55,200 resistance and shows signs of rejection (sell on rise). Alternatively, a decisive break and 15-minute candle close below 54,800.
Stop Loss (SL): Place a stop loss above 55,350 (above the immediate swing high).
Targets:
T1: 54,600 (Next major demand zone).
T2: 54,400 (Extension target).
Bullish Scenario (Counter-Trend/Reversal Plan)
Justification: A strong move back into the previous consolidation range would signal the defense of the macro trend.
Trigger: A sustained move and close above the resistance at 55,300.
Entry: Long entry on a confirmed 15-minute close above 55,300.
Stop Loss (SL): Below 55,100.
Targets:
T1: 55,500 (Upper end of the descending channel).
T2: 55,800 (Major supply zone).
Key Levels for Observation:
Immediate Decision Point: The 54,800 - 55,200 zone.
Bearish Confirmation: A break and sustained move below 54,800.
Bullish Confirmation: A recapture of the 55,300 level.
Line in the Sand: 54,800. The market remains under bearish pressure below this level.
4-Hour Chart (Macro Trend)
Structure: The long-term trend is still bullish, but the price has broken below its immediate ascending channel and has entered a corrective phase. The Bank Nifty has retraced nearly to the 38.2% Fibonacci retracement of its recent rally (according to external analysis) and is testing the major demand zone at 54,800 - 55,200.
Key Levels:
Major Supply (Resistance): 55,400 - 55,500. This area is the first major hurdle for bulls to reclaim, aligning with the broken lower channel line.
Major Demand (Support): 54,800 - 55,000. This is the key "line in the sand." A sustained break below 54,800 would signal a deeper correction towards 54,600 and potentially 54,000.
Outlook: The market is at a make-or-break point. A failure to hold 54,800 will accelerate the short-term bearish trend.
1-Hour Chart (Intermediate View)
Structure: The 1H chart shows a clear MSS (Market Structure Shift) to the downside. The price is trading within a descending channel and has broken the 55,200 support zone. It is currently testing the lower end of the corrective channel.
Key Levels:
Immediate Resistance: 55,200. This area now acts as a strong supply zone, aligning with the red box on the chart.
Immediate Support: 54,800. This is the most important level for intraday support.
15-Minute Chart (Intraday View)
Structure: The 15M chart shows the Bank Nifty consolidating near its low. The price has recently tested the 54,800 support and is attempting a small bounce, but the overall momentum is still guided by the downtrend channel.
Key Levels:
Intraday Supply: 55,200 (Order Block and consolidation high).
Intraday Demand: 54,800 - 54,900. This zone must hold for any intraday recovery.
Outlook: The intraday bias is bearish. A "sell on rise" approach is favored, targeting a rejection near 55,200.
Trade Plan (Friday, 26th September)
Market Outlook: The Bank Nifty is under short-term bearish pressure but is sitting on strong macro support. The best strategy is to be reactive to the levels.
Bearish Scenario (Primary Plan)
Justification: The market is in a short-term downtrend, and a breakdown of the major 54,800 support will confirm a deeper correction.
Entry: Look for a short entry if the price retests the 55,200 resistance and shows signs of rejection (sell on rise). Alternatively, a decisive break and 15-minute candle close below 54,800.
Stop Loss (SL): Place a stop loss above 55,350 (above the immediate swing high).
Targets:
T1: 54,600 (Next major demand zone).
T2: 54,400 (Extension target).
Bullish Scenario (Counter-Trend/Reversal Plan)
Justification: A strong move back into the previous consolidation range would signal the defense of the macro trend.
Trigger: A sustained move and close above the resistance at 55,300.
Entry: Long entry on a confirmed 15-minute close above 55,300.
Stop Loss (SL): Below 55,100.
Targets:
T1: 55,500 (Upper end of the descending channel).
T2: 55,800 (Major supply zone).
Key Levels for Observation:
Immediate Decision Point: The 54,800 - 55,200 zone.
Bearish Confirmation: A break and sustained move below 54,800.
Bullish Confirmation: A recapture of the 55,300 level.
Line in the Sand: 54,800. The market remains under bearish pressure below this level.
Aviso legal
As informações e publicações não devem ser e não constituem conselhos ou recomendações financeiras, de investimento, de negociação ou de qualquer outro tipo, fornecidas ou endossadas pela TradingView. Leia mais em Termos de uso.
Aviso legal
As informações e publicações não devem ser e não constituem conselhos ou recomendações financeiras, de investimento, de negociação ou de qualquer outro tipo, fornecidas ou endossadas pela TradingView. Leia mais em Termos de uso.