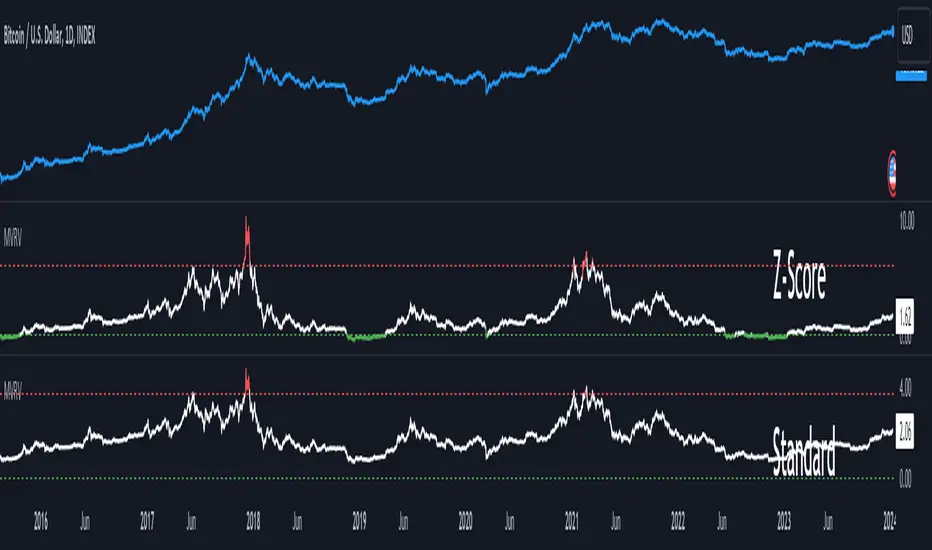
MVRV Z-ScoreThe MVRV ratio was created by Murad Mahmudov & David Puell. It simply compares Market Cap to Realised Cap, presenting a ratio (MVRV = Market Cap / Realised Cap). The MVRV Z-Score is a later version, refining the metric by normalising the peaks and troughs of the data.
Z-score
Z-Scored Volume [KFB Quant]The Z-Scored Volume (CSV) indicator is designed to make it easier to identity potential market extremes.
What is the Z-Score?
The Z-Score is a statistical measure that quantifies how far a particular data point is from the mean of a group of data. It's expressed in terms of standard deviations from the mean.
How to calculate the Z-Score?
Z-Score = (Value - Mean) / StDev
How the script works
In this script we calculate the Z-Score of the charts volume.
We get the Mean of the predefined period in the Length Configuration tab by using the ta.sma function.
We get the StDev of the predefined period in the Length Configuration tab by using the ta.stdev function.
The default period is 360.
Past performance does not guarantee future results. This indicator is for informational & educational purposes only.

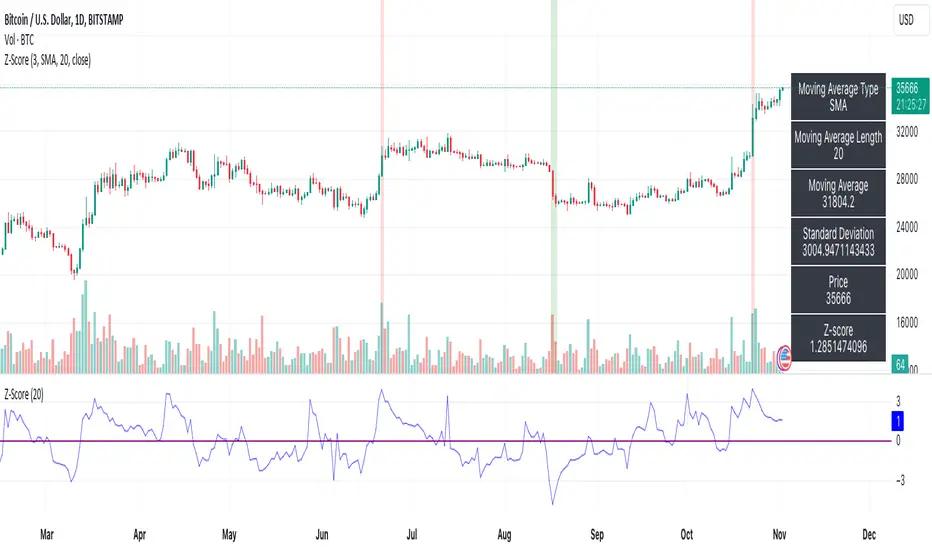
Z-ScoreThe "Z-Score" indicator is a unique and powerful tool designed to help traders identify overbought and oversold conditions in the market. Below is an explanation of its features, usefulness, and what makes it special:
Features:
Z-Score Calculation: The indicator calculates the Z-Score, a statistical measure that represents how far the current price is from the moving average (MA) in terms of standard deviations. It helps identify extreme price movements.
Customizable Parameters: Traders can adjust key parameters such as the Z-Score threshold, the type of MA (e.g., SMA, EMA), and the length of the moving average to suit their trading preferences.
Signal Options: The indicator offers flexibility in terms of signaling. Traders can choose whether to trigger signals when the Z-Score crosses the specified threshold or when it moves away from the threshold.
Visual Signals : Z-Score conditions are represented visually on the chart with color-coded background highlights. Overbought conditions are marked with a red background, while oversold conditions are indicated with a green background.
Information Table: A dynamic information table displays essential details, including the MA type, MA length, MA value, standard deviation, current price, and Z-Score. This information table helps traders make informed decisions.
Usefulness:
Overbought and Oversold Signals: Z-Score is particularly valuable for identifying overbought and oversold market conditions. Traders can use this information to potentially enter or exit positions.
Statistical Analysis: The Z-Score provides a statistical measure of price deviation, offering a data-driven approach to market analysis.
Customization: Traders can customize the indicator to match their trading strategies and preferences, enhancing its adaptability to different trading styles.
Visual Clarity: The visual signals make it easy for traders to quickly spot potential trade opportunities on the price chart.
In summary, the Z-Score indicator is a valuable tool for traders looking to incorporate statistical analysis into their trading strategies. Its customizability, visual signals, and unique statistical approach make it an exceptional choice for identifying overbought and oversold market conditions and potential trading opportunities.
Z-Score - AsymmetrikZ-Score-Asymmetrik User Manual
Introduction
The Z-Score Indicator is a powerful tool used in technical analysis to measure how far a data point is from the mean value of a dataset, measured in terms of standard deviations. This indicator helps traders identify potential overbought or oversold conditions in the market.
This user manual provides a comprehensive guide on how to use the Z-Score Indicator in TradingView.
0. Quickstart
- Set the thresholds based on your asset (number of standard deviations that you consider being extreme for this asset / timeframe).
- Red background indicates a possible overbought situation, green background an oversold one.
- The color and direction of the Z-Score Line acts as a confirmation of the trend reversal.
1. Indicator Overview
The Z-Score Indicator, also known as the Z-Score Oscillator, is designed to display the Z-Score of a selected financial instrument on your TradingView chart. The Z-Score measures how many standard deviations an asset's price is from its mean (average) price over a specified period.
The indicator consists of the following components:
- Z-Score Line: This line represents the Z-Score value and is displayed on the indicator panel.
- Background Color: The background color of the indicator panel changes based on user-defined thresholds.
2. Inputs
The indicator provides several customizable inputs to tailor it to your specific trading preferences:
- Number of Periods: This input allows you to define the number of periods over which the Z-Score will be calculated. A longer period will provide a smoother Z-Score line but may be less responsive to recent price changes.
- Z-Score Low Threshold: Sets the lower threshold value for the Z-Score. When the Z-Score crosses below this threshold, the background color of the indicator panel changes accordingly.
- Z-Score High Threshold: Sets the upper threshold value for the Z-Score. When the Z-Score crosses above this threshold, the background color of the indicator panel changes accordingly.
3. How to Use the Indicator
Here are the steps to use the Z-Score Indicator:
- Adjust Parameters: Modify the indicator's inputs as needed. You can change the number of periods for the Z-Score calculation and set your desired low and high thresholds.
- Interpret the Indicator: Observe the Z-Score line on the indicator panel. It fluctuates above and below zero. Pay attention to the background color changes when the Z-Score crosses your specified thresholds.
4. Interpreting the Indicator
- Z-Score Line: The Z-Score line represents the current Z-Score value. When it is above zero, it suggests that the asset's price is above the mean, indicating potential overvaluation. When below zero, it suggests undervaluation.
- Background Color: The background color of the indicator panel changes based on the Z-Score's position relative to the specified thresholds. Green indicates the Z-Score is below the low threshold (potential undervaluation), while red indicates it is above the high threshold (potential overvaluation).
- Z-Score Line Color: The color of the Z-Score line shows that the Z-Score is trending up compared to its moving average. This can be used as a validation of the background color.
5. Customization Options
You can customize the Z-Score Indicator in the following ways:
- Adjust Inputs: Modify the number of periods and the Z-Score thresholds.
- Change Line and Background Colors: You can customize the colors of the Z-Score line and background by editing the indicator's script.
6. Troubleshooting
If you encounter any issues while using the Z-Score Indicator, make sure to check the following:
- Ensure that the indicator is applied correctly to your chart.
- Verify that the indicator's inputs match your intended settings.
- Contact me for more support if needed
7. Conclusion
The Z-Score Indicator is a valuable tool for traders and investors to identify potential overbought and oversold conditions in the market. By understanding how the Z-Score works and customizing it to your preferences, you can integrate it into your trading strategy to make informed decisions.
Remember that trading involves risk, and it's essential to combine technical indicators like the Z-Score with other analysis methods and risk management strategies for successful trading.

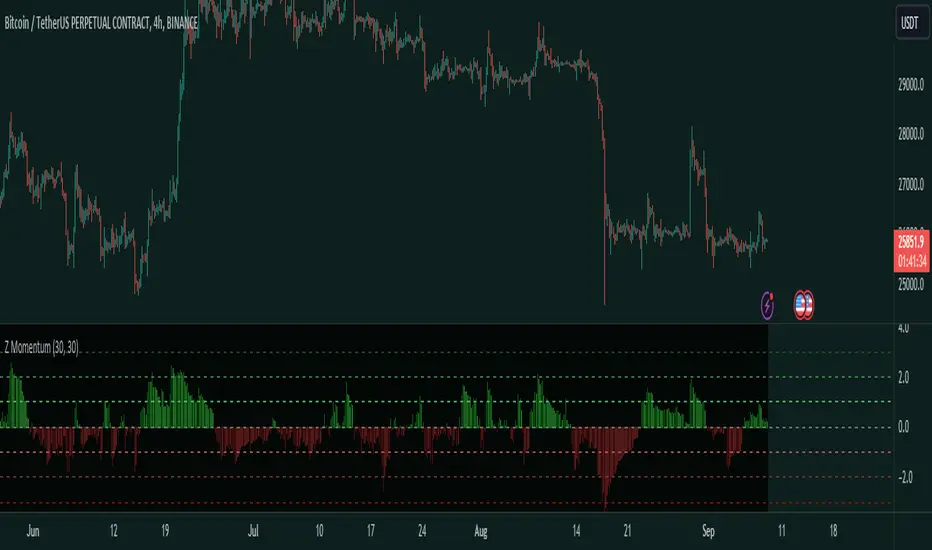
Z MomentumOverview
This is a Z-Scored Momentum Indicator. It allows you to understand the volatility of a financial instrument. This indicator calculates and displays the momentum of z-score returns expected value which can be used for finding the regime or for trading inefficiencies.
Indicator Purpose:
The primary purpose of the "Z-Score Momentum" indicator is to help traders identify potential trading opportunities by assessing how far the current returns of a financial instrument deviate from their historical mean returns. This analysis can aid in recognizing overbought or oversold conditions, trend strength, and potential reversal points.
Things to note:
A Z-Score is a measure of how many standard deviations a data point is away from the mean.
EV: Expected Value, which is basically the average outcome.
When the Z-Score Momentum is above 0, there is a positive Z-Score which indicates that the current returns of the financial instrument are above their historical mean returns over the specified return lookback period, which could mean Positive, Momentum, and in a extremely high Z-Score value, like above +2 Standard deviations it could indicate extreme conditions, but keep in mind this doesn't mean price will go down, this is just the EV.
When the Z-Score Momentum is below 0, there is negative Z-Score which indicates that the current returns of the financial instrument are below their historical mean returns which means you could expect negative returns. In extreme Z-Score situations like -2 Standard deviations this could indicate extreme conditions and the negative momentum is coming to an end.
TDLR:
Interpretation:
Positive Z-Score: When the Z-score is positive and increasing, it suggests that current returns are above their historical mean, indicating potential positive momentum.
Negative Z-Score: Conversely, a negative and decreasing Z-score implies that current returns are below their historical mean, suggesting potential negative momentum.
Extremely High or Low Z-Score: Extremely high (above +2) or low (below -2) Z-scores may indicate extreme market conditions that could be followed by reversals or significant price movements.
The lines on the Indicator highlight the Standard deviations of the Z-Score. It shows the Standard deviations 1,2,3 and -1,-2,-3.
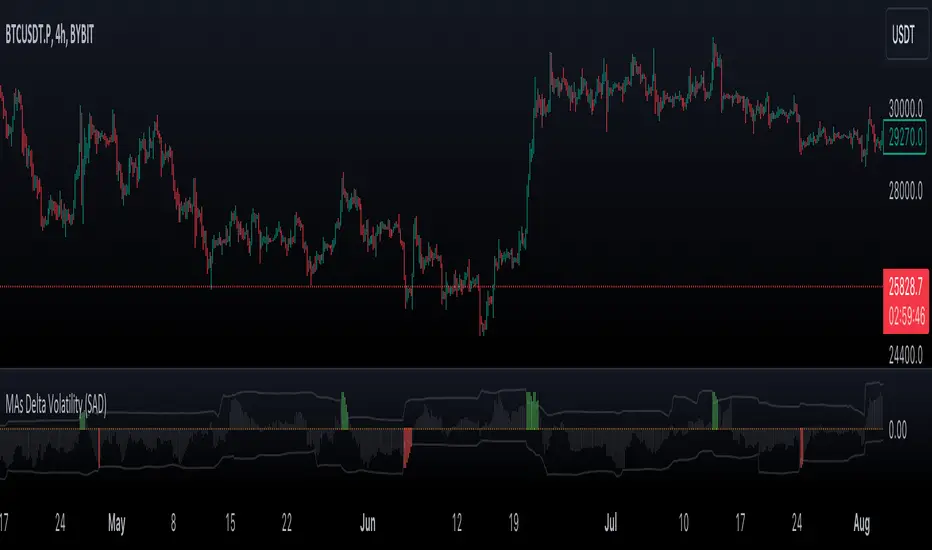
VWMA/SMA Delta Volatility (Statistical Anomaly Detector)The "VWMA/SMA Delta Volatility (Statistical Anomaly Detector)" indicator is a tool designed to detect and visualize volatility in a financial market's price data. The indicator calculates the difference (delta) between two moving averages (VWMA/SMA) and uses statistical analysis to identify anomalies or extreme price movements. Here's a breakdown of its components:
Hypothesis:
The hypothesis behind this indicator is that extreme price movements or anomalies in the market can be detected by analyzing the difference between two moving averages and comparing it to a statistically derived normal distribution. When the MA delta (the difference between two MAs: VWMA/SMA) exceeds a certain threshold based on standard deviation and the Z-score coefficient, it may indicate increased market volatility or potential trading opportunities.
Calculation of MA Delta:
The indicator calculates the MA delta by subtracting a simple moving average (SMA) from a volume-weighted moving average (VWMA) of a selected price source. This calculation represents the difference in the market's short-term and long-term trends.
Statistical Analysis:
To detect anomalies, the indicator performs statistical analysis on the MA delta. It calculates a moving average (MA) of the MA delta and its standard deviation over a specified sample size. This MA acts as a baseline, and the standard deviation is used to measure how much the MA delta deviates from the mean.
Delta Normalization:
The MA delta, lower filter, and upper filter are normalized using a function that scales them to a specific range, typically from -100 to 100. Normalization helps in comparing these values on a consistent scale and enhances their visual representation.
Visual Representation:
The indicator visualizes the results through histograms and channels:
The histogram bars represent the normalized MA delta. Red bars indicate negative and below-lower-filter values, green bars indicate positive and above-upper-filter values, and silver bars indicate values within the normal range.
It also displays a Z-score channel, which represents the upper and lower filters after normalization. This channel helps traders identify price levels that are statistically significant and potentially indicative of market volatility.
In summary, the "MA Delta Volatility (Statistical Anomaly Detector)" indicator aims to help traders identify abnormal price movements in the market by analyzing the difference between two moving averages and applying statistical measures. It can be a valuable tool for traders looking to spot potential opportunities during periods of increased volatility or to identify potential market anomalies.
Realized Profit & Loss [BigBeluga]The Realized Loss & Profit indicator aims to find potential dips and tops in price by utilizing the security function syminfo.basecurrency + "_LOSSESADDRESSES".
The primary objective of this indicator is to present an average, favorable buying/selling opportunity based on the number of people currently in profit or loss.
The script takes into consideration the syminfo.basecurrency, so it should automatically adapt to the current coin.
🔶 USAGE
Users have the option to enable the display of either Loss or Profit, depending on their preferred visualization.
Examples of displaying Losses:
Example of displaying Profits:
🔶 CONCEPTS
The concept aims to assign a score to the data in the ticker representing the realized losses. This score will provide users with an average of buying/selling points that are better to the typical investor.
🔶 SETTINGS
Users have complete control over the script settings.
🔹 Calculation
• Profit: Display people in profit on an average of the selected length.
• Loss: Display people in loss on an average of the selected length.
🔹 Candle coloring
• True: Color the candle when data is above the threshold.
• False: Do not color the candle.
🔹 Levels
- Set the level of a specific threshold.
• Low: Low losses (green).
• Normal: Low normal (yellow).
• Medium: Low medium (orange).
• High: Low high (red).
🔹 Z-score Length: Length of the z-score moving window.
🔹 Threshold: Filter out non-significant values.
🔹 Histogram width: Width of the histogram.
🔹 Colors: Modify the colors of the displayed data.
🔶 LIMITATIONS
• Since the ticker from which we obtain data works only on the daily timeframe, we are
restricted to displaying data solely from the 1D timeframe.
• If the coin does not have any realized loss data, we can't use this script.

MEO Reversal and AlertHello; This indicator offers a suite of diverse analytical features. These features are typically triggered in unusual overbought and oversold conditions and are primarily used to identify excessive buying or selling and for general monitoring in suspicious cases.
Below is a general overview of the various features of this indicator:
RSI Overbought and Oversold Zones: This feature determines whether the RSI is in the overbought or oversold zones.
RSI Peak and Trough Points: Identifies the peak and trough points of the RSI.
Stoch RSI Peak and Trough Points: Identifies the peak and trough points of the Stoch RSI.
MACD Peak and Trough Points: Identifies the peak and trough points of the MACD.
MACD Overflow Points: Detects the overflow points of the MACD.
WaveTrend Reversal Points: Identifies the reversal points of the WaveTrend.
Money Flow Index (MFI) Potential Reversals: Determines the potential reversal points of the MFI.
Z-Score Outliers: Identifies the deviation points of the Z-Score.
Momentum Reversal Points: Identifies the reversal points of Momentum.
SR Support Resistance Breakouts: Determines the breakout points of support and resistance.
Rate of Change (ROC) Rapid Price Change Points: Identifies the rapid price change points of the ROC.
You can set alert conditions for each feature.
The inspiration for this indicator came from the idea of making a few indicators easier and faster to use together. Instead of tracking three basic indicators as shown in the image, I thought it might be more straightforward to follow the Reversal indicator. I imagined this could generally be a handy tip-off indicator and wanted to share it with you. Please write if you have any questions or if there's something you'd like to ask.
However, remember that this should not be considered as investment advice and should not be used for direct buying or selling operations. Each trade is under the individual user's responsibility.
For frequently asked questions, you can check the TradingView support page here: tr.tradingview.com

Extreme Reversal SignalThe Extreme Reversal Signal is designed to signal potential pivot points when the price of an asset becomes extremely overbought or oversold. Extreme conditions typically signal a brief or extensive price reversal, offering valuable entry or exit points. It's important to note that this indicator may produce multiple signals, making it essential to corroborate these signals with other forms of analysis to determine their validity. While the default settings provide valuable insights, it might be beneficial to experiment with different configurations to ensure the indicator's efficacy.
Two primary conditions define extremely overbought and oversold states. The first condition is that the price must deviate by two standard deviations from the 20-day Simple Moving Average (SMA). The second condition is that the 3-day SMA of the 14-day Stochastic Oscillator (STO) derived from the 14-day Relative Strength Index (RSI) is above or below the upper or lower limit.
Oversold states arise when the first condition is met and the 3-day SMA of the 14-day Stochastic RSI falls below the lower limit, suggesting a buy signal. These are visually represented by green triangles below the price bars. Overbought states arise when the first condition is met and the 3-day SMA of the 14-day Stochastic RSI rises above the upper limit, suggesting a sell signal. These are visually represented by red triangles above the price bars. It's also possible to set up automated alerts to get notifications when either of these two conditions is met to avoid missing out.
While this indicator has traditionally identified overbought and oversold conditions in various different assets, past performance does not guarantee future results. Therefore, it is advisable to supplement this indicator with other technical tools. For instance, trend indicators can greatly improve the decision-making process when planning for entries and exit points.

Volume-Weighted Trend Filter CloudThe Volume-Weighted Trend Filter Cloud is a powerful technical analysis tool designed to identify trend directions and potential buy/sell signals in a trading instrument. The indicator combines volume-weighted moving averages, average true range (ATR), and cloud plotting techniques to provide a comprehensive view of the market trend.
Inputs:
Length: Specifies the length of Algo used for trend analysis. Default value is 14.
Multiplier: Adjusts the width of the trend filter bands based on the ATR. Default value is 2.0.
Tenkan-sen Period: Defines the period for calculating the Tenkan-sen line. Default value is 200.
Kijun-sen Period: Sets the period for calculating the Kijun-sen line. Default value is 400.
Senkou Span Period: Determines the period for calculating the Senkou Span A and Senkou Span B lines. Default value is 600.
Calculation:
Average True Range (ATR): The indicator calculates the ATR based on the specified moving average length.
Trend Filter Bands: The basic upper and lower bands are calculated using the highest high and lowest low values, respectively, along with the multiplier and ATR. These bands are then adjusted to create the final upper and lower bands, taking into account the previous values.
Trend Direction: The indicator determines the trend direction by comparing the close price with the lower and upper bands. If the close price is above the lower band, it indicates an upward trend (trendUp = 1). If the close price is below the upper band, it indicates a downward trend (trendDown = 1).
Volume-Weighted Z-Score: The indicator calculates the volume-weighted Z-Score by determining the mean and standard deviation of the close price with volume weighting. The Z-Score represents the deviation of the close price from the mean in terms of standard deviations.
Tenkan-sen, Kijun-sen, Senkou Span A, and Senkou Span B: These lines are calculated using the respective periods and the average of the high and low prices.
Sigmoid Transformation: The indicator applies the sigmoid function to the Z-Score values to obtain sigmoid-transformed values for open, high, low, and close prices. These transformed values help in visualizing the trend strength.
Plotting:
Trend Filter: The trend filter is plotted as a line that changes color based on the trend direction. The lower band is displayed for an upward trend, while the upper band is displayed for a downward trend.
Trend Cloud: The cloud plot represents the Senkou Span A and Senkou Span B lines. The cloud color changes based on the trend direction, providing a visual representation of the market trend.
Buy and Sell Signals: The indicator generates buy and sell signals based on the crossover of fast and slow moving averages, Z-Score values, trend direction, and other conditions. These signals are labeled on the chart, indicating potential entry points for traders.
The indicator generates buy and sell signals based on specific conditions, including the intersection of fast and slow moving averages, Z-Score values, trend direction, and more.
Buy signals are described as a "buy signal" on the chart, which indicates potential entry points for buy trades.
Sell signals are described as a "sell signal", which indicates potential entry points for sell trades. The signals in light color represent that they are signals in the opposite direction of the cloud that can be considered as exit points

The Z-score The Z-score, also known as the standard score, is a statistical measurement that describes a value's relationship to the mean of a group of values. It's measured in terms of standard deviations from the mean. If a Z-score is 0, it indicates that the data point's score is identical to the mean score. Z-scores may be positive or negative, with a positive value indicating the score is above the mean and a negative score indicating it is below the mean.
The concept of Z-score was introduced by statistician Carl Friedrich Gauss as part of his "method of the least squares," which was an important step in the development of the normal distribution and Z-score tables. It's a key concept in statistics and is used in various statistical tests.
In financial analysis, Z-scores are used to determine whether a data point is usual or unusual. You can think of it as a measure of how many standard deviations an element is from the mean. For instance, a Z-score of 1.0 would denote a value that is one standard deviation from the mean. Z-scores are also used to predict probabilities, with Z-scores having a distribution that is expected to be normal.
In trading, a Z-score is used to determine how often a trading system may produce a string of winners or losers. It can help a trader to understand whether the losses or profits they see are something that the system would most likely produce, or if it's a once in a blue moon situation. This helps traders make decisions about when to start or stop a system.
I just wanted to play a bit with the Z-score I guess.
Feel free to share your findings if you discover additional applications for this strategy or identify timeframes where it appears to perform more optimally.
How it works:
This strategy is based on a statistical concept called Z-score, which measures the number of standard deviations a data point is from the mean. In other words, it helps determine how unusual or usual a data point is.
In the context of this strategy, Z-score is applied to a 10-period EMA (Exponential Moving Average) of Heikin-Ashi candlestick close prices. The Z-score is calculated over a look-back period of 25 bars.
The EMA of the Z-score is then calculated over a 20-bar period, and the upper and lower thresholds (bounds for buy and sell signals) are defined using the 90th and 10th percentiles of this EMA score.
Long positions are taken when the Z-score crosses above the lower threshold or crosses above the mid-line (50th percentile). An additional long entry is made when the Z-score crosses above the highest value the EMA has been in the past 100 periods.
Short positions are initiated when the EMA crosses below the upper threshold, lower threshold or the highest value the EMA has been in the past 100 periods.
Positions are closed when opposing entry conditions are met, for example, a long position is closed when the short entry condition is true, and vice versa.
Set your desired start date for the strategy. This can be modified in the timestamp("YYYY MM DD") function at the top of the script.

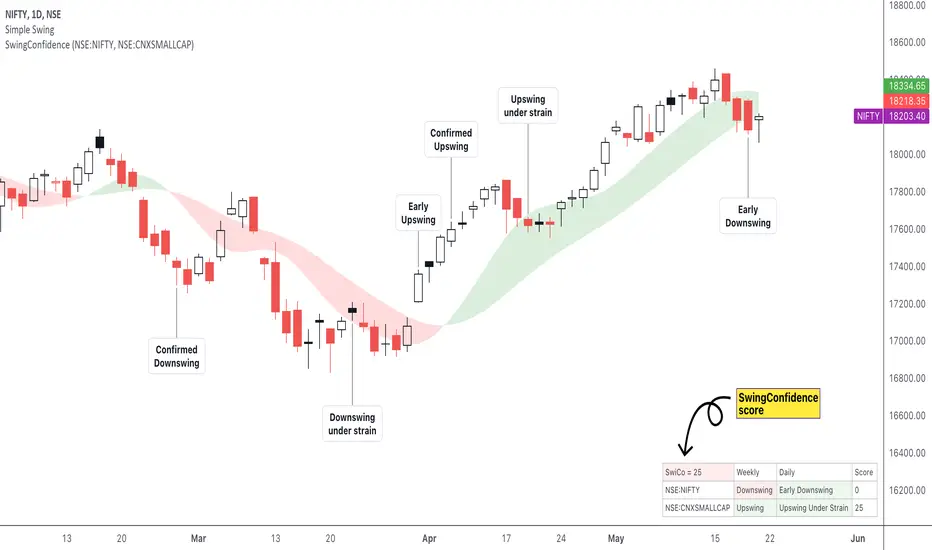
SwingConfidence ScoreSwingConfidence is a scoring system that helps us quantitatively manage risk & position size in swing trading.
SwingConfidence uses T3 moving average to determine the swing state in which the instrument is in. So, this is supposed to be used with my previously posted Simple Swing with T3MA indicator . The T3MA ribbon consists of a fast and a slow moving average (MA). The ribbon is green when the fast MA is above the slow MA. This green ribbon represents the upswing. Similarly, the red ribbon represents the downswing.
The score takes into account the swing state of 2 chosen benchmark indices (by default, these are NIFTY & CNXSMALLCAP). It has 2 components:
- Weekly Swing
- Daily Swing
Weekly Swing
The script uses the Simple Swing indicator on weekly charts of of 2 benchmark indices to determine whether the index is in a weekly upswing or downswing.
- If the color of the weekly ribbon is green, we are in a weekly Upswing.
- If the color of the weekly ribbon is red, we are in a weekly Downswing.
Daily Swing
The script uses the Simple Swing indicator on daily charts of 2 benchmark indices to determine the daily swing state. There can be any one of total 6 swing states on a daily chart:
- Early Upswing (close above red ribbon)
- Confirmed upswing (green ribbon)
- Upswing under strain (close inside green ribbon)
- Early Downswing (close below green ribbon)
- Confirmed downswing (red ribbon)
- Downswing under strain (close inside red ribbon)
SwingConfidence Scoring
The script prints the Weekly & Daily Swing states, & assigns a score to each index from 0 to 50, where 0 is the most bearish score, & 50 is the most bullish score. The sum of the scores is the final SwingConfidence score. e.g. If both indices are in a confirmed upswing, then the score reads 50 + 50 = 100.
How to use the SwingConfidence score?
There are multiple ways by which we can use the SwingConfidence score:
- If the SwingConfidence value is 100%, then we can go in with the maximum open risk our strategy allows. As the score starts decreasing, we keep on closing/modifying our positions, so as to keep the open risk proportionately down. Once the score reaches to zero, we must not be having any open risk. We can achieve this by either going in all-cash, or bringing the stop losses to breakeven.
- Another way is to use this is via a progressive exposure method. If the SwingConfidence value is 100%, then we go with full position size (e.g. 1% capital-at-risk). If the value is 0%, we sit out in cash. Between these 2 extremes, we reduce/increase our position size accordingly.
Please note that this script will display only on the daily timeframe.
MVRV Z Score and MVRV Free Float Z-ScoreIMPORTANT: This script needs as much historic data as possible. Please run it on INDEX:BTCUSD , BNC:BLX or another chart of sufficient length.
MVRV
The MVRV (Market Value to Realised Value Ratio) simply divides bitcoins market cap by bitcoins realized market cap. This was previously impossible on Tradingview but has now been made possible thanks to Coinmetrics providing us with the realized market cap data.
In the free float version, the free float market cap is used instead of the regular market cap.
Z-Score
The MVRV Z-score divides the difference between Market cap and realized market cap by the historic standard deviation of the market cap.
Historically, this has been insanely accurate at detecting bitcoin tops and bottoms:
A Z-Score above 7 means bitcoin is vastly overpriced and at a local top.
A Z-Score below 0.1 means bitcoin is underpriced and at a local bottom.
In the free float version, the free float market cap is used instead of the regular market cap.
The Z-Score, also known as the standard score is hugely popular in a wide range of mathematical and statistical fields and is usually used to measure the number of standard deviations by which the value of a raw score is above or below the mean value of what is being observed or measured.
Credits
MVRV Z Score initially created by aweandwonder
MVRV initially created by Murad Mahmudov and David Puell

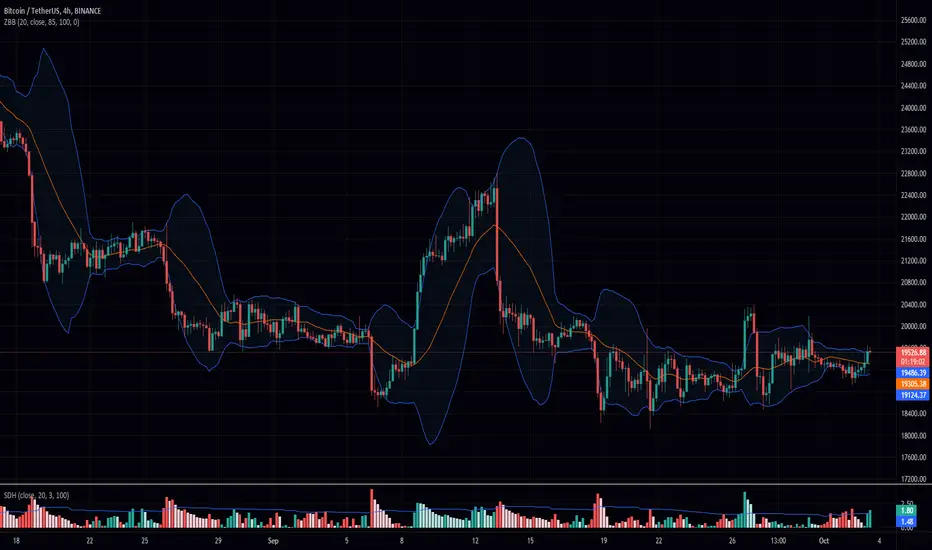
Z Pack BollingerOur new "Z Pack" indicator is a modified version of the traditional Bollinger Bands indicator, with a bunch of additional features what makes it a powerful tool that allows traders to make informed decisions based on the market's volatility and short-term trend.
The z-score of the Bollinger Bands indicator is a measure of how many standard deviations the current price is away from the moving average. This provides a more normalized view of the price action, which can be especially useful in identifying potential trend changes. In this form of indicator it is much easier to notice the most extreme deviations from the mean.
One of the main advantages of using this indicator is that it can help traders identify market conditions that are unusually far away from the mean, which can be indicative of a potential trend reversal or that, with sustained momentum a new trend may be about to begin.
Another advantage of the Z-Score Bollinger Bands indicator is that it can help traders identify when a market is trending. This is because when the Z-score is consistently high or low, it can indicate that a trend is in progress or that a trend may be reversing, respectively.
As for the additional features with which we have charged this indicator, there are many of them and they will be explained now.
Capital line
"Capital line" is based on a kernel regression of z score value over time.
The kernel regression is a non-parametric method that allows to estimate the underlying probability density function of a random variable and this way provides a smooth representation of the data. By using this method, the "Сapital line" is able to react to market changes much faster than traditional methods and gives traders a more accurate representation of the short-term trend.
Also we have developed a filter that reduces the number of false signals (you can toggle it in the settings). It is also possible to enable the display of only the capital line to focus only on it.
Divergence search
One of the unique features of the indicator is its ability to search for divergence between the z score and the price. A divergence occurs when the indicator and the price are moving in opposite directions, indicating a potential trend reversal. This allows traders to identify potential market turning points and make informed decisions.
It is possible to search for divergence on a Z-score, although it is not a common practice. In technical analysis, divergence is a method of comparing the movement of an asset's price with an indicator, such as an oscillator, in order to identify potential trend reversals. The same concept of divergence can be applied to a Z-score by comparing the movement of a value's Z-score to the underlying data, for example, by comparing the change in Z-score to the change in the underlying price of a stock. However, this is not a widely used approach and requires thoughtful analysis, but according to our observations, it provides quite important information about the potential exhaustion of the current trend.
By combining the z-score with the price, traders can look for divergences that might not be as obvious when looking at the indicator or the price alone. For example, if the z-score is trending higher while the price is trending lower, this could indicate a potential bullish reversal. Similarly, if the z-score is trending lower while the price is trending higher, this could indicate a potential bearish reversal.
Price Labels
The labels indicating the price of an asset that corresponds to a specific level of the standard deviation are a useful feature for traders because it allows them to quickly identify key levels of support and resistance. By placing limit orders at these levels, traders can potentially enter or exit trades at more favorable prices. This can help to improve the risk-reward ratio of their trades, as well as potentially increase the chances of a profitable outcome. Additionally, having these labels readily available can save traders time in identifying key levels of support and resistance, allowing them to focus on other aspects of their trading strategy.
Additionally, there is an option to analyze the previous volatility of the instrument for a specified time period. If the instrument has crossed the maximum standard deviation level at least once during the specified time period, a separate dashed line will be drawn on the z score chart, demonstrating how volatile the instrument is in the context of the specified time period. This is known as Extreme Mode.
The feature of analyzing the previous volatility of an instrument using the z score indicator can be beneficial for traders in a number of ways. One major advantage is that it allows traders to quickly assess the historical volatility of an instrument and compare it to current volatility levels. This can be useful for determining if an instrument is currently experiencing unusually high or low volatility, which can in turn inform trading decisions.
Another advantage of this feature is that it allows traders to quickly identify key levels of volatility that have been historically significant for the instrument. For example, if an instrument has frequently crossed the maximum deviation level during a specified time period, a trader may choose to place limit orders at that level in anticipation of the instrument reaching it again in the future.
The ability to see the price at a particular moment in time when the price breaks through the 4th(selectable) level of the z score can be an advantage for traders as it allows them to quickly identify key price levels and potentially place limit orders at those levels. This feature can be useful for traders who want to take advantage of market volatility or for those who want to set stop-loss or take-profit levels.
Additionally, the feature can be useful for identifying key levels of support and resistance, as well as for identifying potential entry and exit points for trades. By having the ability to quickly identify these key levels, traders can make more informed decisions about their trades and potentially increase their chances of success in the market.
Alerts
The "Z pack" indicator also includes an advanced, customisable alerting system, with alerts for z level touches, zero crossings, changes in the direction of the capital line, and confirmed or potential divergence. It allows them to stay informed of key developments in the market in real-time and take action accordingly.
For example, if the indicator generates an alert for a z level touch, a trader can place a market order at that level knowing that the price has reached a significant level of volatility. Similarly, an alert for a zero crossing (up/down) can indicate a change in trend, and a trader can use this information to adjust their strategy accordingly.
The alerts of confirmed or potential divergence can be especially useful for identifying potential turning points in the market and make decisions based on that.
NB! Remember, it is important to have a solid trading plan in place and to properly manage risk when trading. Our custom indicator can be a useful tool, but it should not be the only factor considered when making trade decisions.

Z Bollinger BandsThis version of Bollinger Bands measures the average volatility. By taking the 75th percentile of the average absolute value of the difference between the Source and the Mean divided by the Standard Deviation and using that as our multiplier for our Bollinger bands we can have a statistically safe trading zone.
You notice that its dynamic, this is because it take into account the real volatility levels of a window and uses that to determine an appropriate multiplier. As always I hope you enjoy this release.
Improved Z-ScoreStandard Z-Score scripts lack customization of parameters that I personally desire when doing quantitative analysis. This is an improved Z-Score Indicator to add to your charts that lets you customize various inputs.
Below are the current features:
1) Ticker Type - which data would you like to use for the ticker input - Open, High, Low, Close, OHLC4
2) Ticker Smoothing? - sometimes if you have noisy data, it could be useful to smooth the ticker with a very fast EMA. If this is set to true, the ticker data will be smoothed with an EMA with period that you specify.
3) Ticker Smoothing Period - if Ticker Smoothing? is set to true, this will allow you to specify the smoothing period of the fast EMA - I usually use a 3-period for all of my quantitative analysis, if I am using smoothing.
4) MA Type - Z-Scores are normalized by subtracting a moving average. This allows you to select either a Simple Moving Average (SMA) or an Exponential Moving Average (EMA) - the standard is to use SMA.
5) MA Period - the previous X number of bars that you would like to use for normalization. The default is set to 21 (this is roughly 1 month of trading days data for a daily chart).
5) Standard Deviation Period - Z-Scores are normalized by dividing by the standard deviation over X previous periods. This allows you the chance to customize. Default is 252 (this is roughly 1 year of trading days data for a daily chart).
I can add more features if folks are interested, let me know! I hope you like the script.
Best regards,
-Jim Bosse-

[Sidders]Std. Deviation from Mean/MA (Z-score)This indicator visualizes in a straight forward way the distance price is away from the mean in absolute standard deviations (Z-score) over a certain lookback period (can be configured). Additionally I've included a moving average of the distance, the MA type can be configured in the settings.
Personally using this indicator for some of my algo mean reversion strategies. Price reaching the extreme treshold (can be configured in settings, standard is 3) could be seen as a point where price will revert to the mean.
I've included alerts for when price crosses into extreme areas, as well as alerts for when crosses back into 'normal' territory again. Both are also plotted on the indicator through background coloring/shapes.
Since I've learned so much from other developers I've decided to open source the code. Let me know if you have any ideas on how to improve, I'll see if I can implement them.
Enjoy!

Z-Score DeltaHeavily modified from Z Score by jwammo12
Compares the z-score of two assets, the onscreen one and the reference one configured. If you're familiar, you can think of it as Bollinger Band Percent of Onscreen Asset minus the Bollinger Band Percent of Reference Asset.
It's compared off a simple moving average, due to how standard deviation is calculated.
I view this a more literal meaning of relative strength.
Has the ability to offset or delay in time one to another.
TODO: add MAD and MAD/STD.DEV views
Not my greatest work, but it's functional.

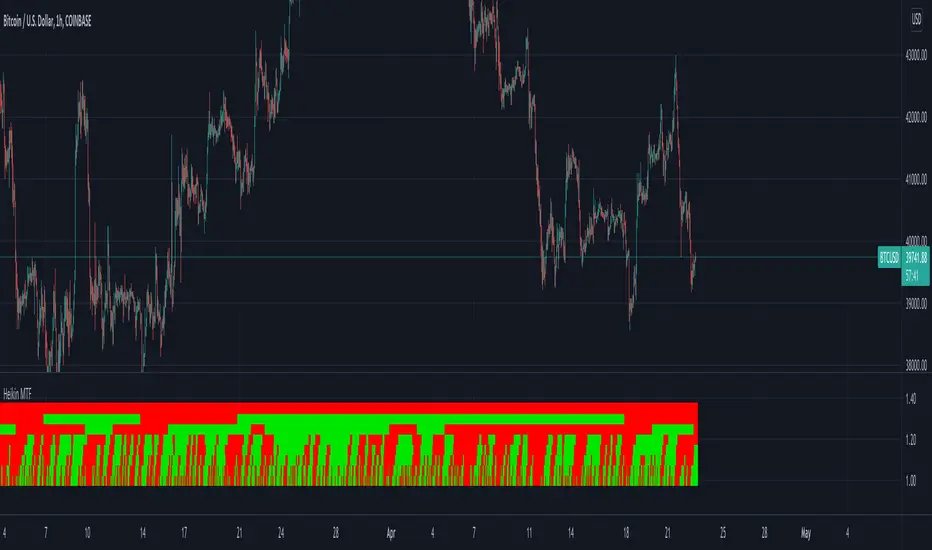
Heikin Multi Time Frame// How it Works \\
This script calculates the open and close prices of Heikin Ashi candles across multiple timeframes,
If the candle formed on that timeframe is green it will display in the table a green square, If the candle is red, the square will display red.
// Settings \\
You can change the colours of the plots
You can also Change any of the timeframes which the Heikin Ashi candles are being calculated on
// Use Case \\
Heikin Ashi candles are often used to give a smoother trend direction and help cancel out some of the noice/consolidation.
It can also be use as trend detection for multiple timeframes at once
/ / Suggestions \\
Happy for anyone to make any suggestions on changes which could improve the script,
// Terms \\
Feel free to use the script, If you do use the scrip please just tag me as I am interested to see how people are using it. Good Luck!
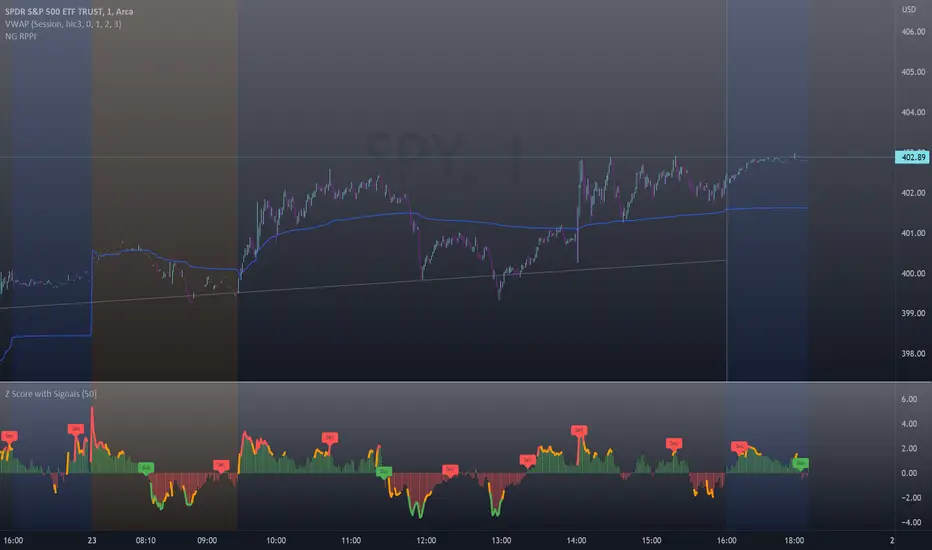
Z-Score with Buy & Sell SignalsThis is my open-source indicator of z-score with buy and sell indicators.
I see there are other z-score indicators, I just am particular about how I like my z-scores calculated and so decided to make my own and add buy and sell signals to help guide me. And I figured I could share it openly here!
What is a Z-Score
A z-score is a statistical measures of the distance, in standard deviations, a value is from its given mean. It is expressed as a standard deviation (or SD). The further a value (in this case, a stock) is from their mean, the more likely a regression to the mean is possible (i.e. a return to the average). So if a stock is trading at 3 standard deviations away from its mean, then we can anticipate it wanting to regress back towards 1 to 0 standard deviations from its mean (i.e. sell off back to a value that brings it closer to that SD).
The inverse is true if it is trading below.
Z-Scores and Stocks
Stocks, like everything in nature, like to trade between -1 and +1 SD away from its mean. Anything above this, we can interpret that there is "stress" on the stock. Anything over 2.50 is tremendous stress on the stock and we can anticipate that it will want to revert to its mean in the near future and bring that value down to at least 1, ideally between the -0.5 and 0.5 range.
Please note, I set the standard VERY high for the indicator to issue a buy and sell signal (/=2.50). Lately with the volatility, stocks have been entering these ranges frequently and so there have been plenty of signals, but traditionally in a stable environment you may not get these signals. I set the bar extremely high because I want to avoid false buy and sell signals (you will still get them though, nothing is perfect!). So the value in this indicator is in interpreting the actual z-score itself, so please be sure you understand exactly what the Z-score is (see the description above).
How the indicator works
The indicator works by calculating the average Z-Score between a stocks high and low. This indicator will present the average deviation a stock has from its high and low average. The higher the Z-Score, the more "overbought" the stock is. The lower the z-score, the more "oversold" the stock is. It uses the previous 500 candles worth of data to calculate its SMA and its Standard deviation in order to calculate the z-score.
Anytime a stock trades 2.50 SDs or more above or below its mean, you will be presented with a Buy or Sell signal, as generally, statistically speaking, after something has travelled 2.50 SDs aware from its mean, there is an increased probability of a reversion happening.
You can use this indicator to determine whether the stock is trading within normal parameters or not and to help you in your analysis as to whether or not a stock could be shorted or longed.
I personally like this for swing trading on the 1 hour chart; however, this can be used on any time from 1 minute to 1 hour. It also allows you to track a stocks progress in its reversion to the mean.
Examples of it in Use:
Gold ETF (ARCA: GLD) on 1 minute
Dow Jones ETF (ARCA: DIA) on 1 minute (my favourite Stock!)
SPY ETF (ARCA: SPY) on 1 hour chart
Disclaimer:
This is not meant to be placed as a sole and single strategy. It should be used in COJUNCTION with your other strategies to help you make a determination.
No indicator is infallible and should never be relied on 100%!
Please let me know your questions/comments/experiences/recommendations below!
Thanks everyone!
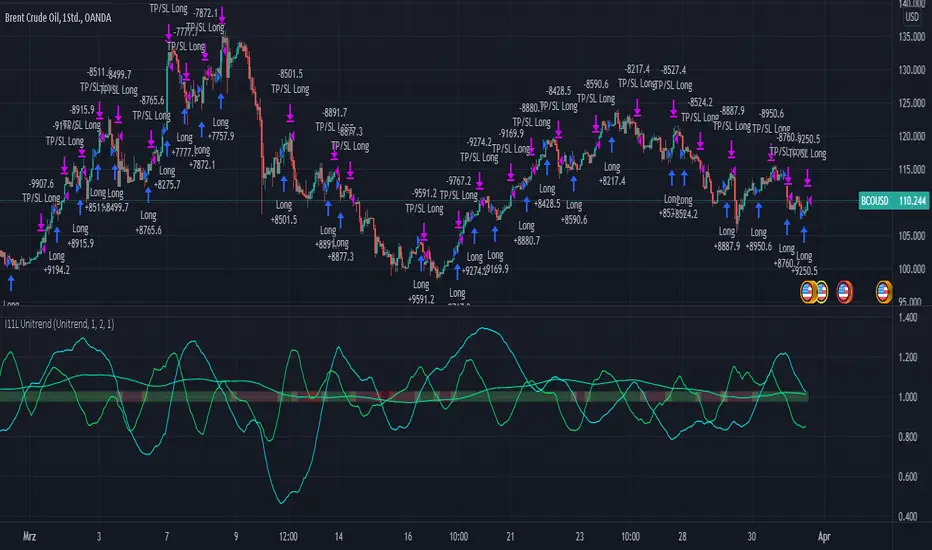
RSI, EMA, SMA Trendtrading - Oil Daytrading 1HThe Unitrend trading System produces trading recommendations on a pure Trend basis.
It is a Score based system.
--- How to use the System --
Simply adjust your capital you want to risk per trade and your TP Factor.
The TP Factor is the multiple of your risked Capital, also known as Risk/Reward ratio.
Furthermore you can toggle between a always Buy mode, to see if the System is better then market.
Compounding mode helps you to get a better understanding of your maximum drawdown with a total equity based approach.
--- How are Signals produced? ---
A score of 2 or 3 is a BUY signal.
You can count the score by looking at the lines above 1, or by reading the color.
Green is 3, yellow 2, orange 1 and red is 0.
The score is calculated by 3 conditions.
Each applying condition yields one point for the score.
The score resets each bar.
The rules are:
RSI > 45: Well known indicator, usually looks for reversal points but seems to produce above average results when above 45.
EMA(RSI) > SMA(RSI): My approach to momentum detection for the RSI movement, I consider a faster growing RSI as a good thing.
EMA(close) > SMA(close): My approach to trend detection for the market movement. Common Wisdom would be a fast SMA > slow SMA which I found to be too slow for the modern market.
Uptrend and Oversold Index Swing Trading System 8H--- Foreword ---
The Overbought and Oversold Index Swing Trading System or short: I11L Hypertrend primarily uses money management Strategies, EMA and SMA and my momentum Ideas for trying to produce satisfactory Alpha over a timespan of multiple years.
--- How does it Work? ---
It uses 20 different EMA's and SMA's to produce a score for each Bar.
It will credit one Point If the EMA is above the SMA.
A high score means that there is a strong Uptrend.
Spotting the strong Uptrend early is important.
The I11L Hypertrend System trys to spot the "UPTREND" by checking for a crossover of the Score(EMA) / Score(SMA).
A low score means that there is a strong Downtrend.
Its quite common to see a reversal to the mean after a Downtrend and spotting the bottom is important.
The System trys to spot the reversal, or "OVERSOLD" state by a crossunder of the Score(EMA) / Score(SMA).
--- What can i customize? ---
-> Trading Mode: You can choose between two different trading modes, Oversold and Overbought(trend) and Random Buys to check if your systems Profitfactor is actually better then market.
-> Work with the total equity: The system uses the initial capital per default for Backtesting purposes but seeing the maximum drawdown in a compounding mode might help!
-> Use a trailing SL: A TSL trys to not lose too much if the trade goes against your TP
-> Lookbackdistance for the Score: A higher Lookbackdistance results in a more lagging indicator. You have to find the balance between the confirmation of the Signal and the frontrunning.
-> Leverage: To see how your strategie and your maximum Drawdown with the total equity mode enabled would have performed.
-> Risk Capital per Trade unleveraged: How much the underlying asset can go against your position before the TSL hits, or the SL if no TSL is set.
-> TPFactor: Your risk/reward Ratio. If you risk 3% and you set the ratio to 1.2, you will have a TP at 3 * 1.2 = 3.6%
-> Select Date: Works best in the 8H Timeframe for CFD's. Good for getting a sense of what overfitting actually means and how easy one can fool themself, find the highest Profitfactor setting in the first Sector (Start - 2012) and then see if the second Sector (2012 - Now) produces Alpha over the Random Buy mode.
--- I have some questions about the System ---
Dear reader, please ask the question in the comment Section and i will do my best to assist you.

(FireflyTA) Algo Score MTFAlgo Score MTF
The Algo Score MTF is a meta-analytic oscillator telling you about the technical market strength . It is analyzing a variety of different indicators and metrics to come up with a score that gives you an impression on whether the medium timeframes have fuel to go higher or if it's running out and the risk increases to see corrective price action.
----------------------
About Technical Market Strength
Algo measures the technical strength with a score between -10 and 10 . A bullish or bearish technical market strength shows a high correlation with bullish or bearish PA soon after the score reaches the significant levels deviating from 0. However, optimal treshold values (meaning the score after which the strength can be considered bullish or bearish) vary depending on the market looked at. For BTCUSD, the default values used can be seen as reference. If you want to apply Algo to other markets, you will have to calibrate the tresholds yourself.
It is important to know that market strength is the fuel to drive price higher or lower, but it is not the trigger. The trend is of superior importance. So when price is in a strong uptrend (in this case on the MTF), and the score reaches a value of -4 or lower (which can be considered bearish), it can still take a while for the trend to shift because of the strong momentum. The score in this case can be used as an indicator to show you times when it is wise to take profits / de-risk or take extra care in your risk management in general.
----------------------
Indicators used
All the indicators mentioned are calculated separately and weighted by the significance value you can customize in the indicator UI. It is also possible to (1) deactivate certain indicators and (2) force them as required, so that a signal in the oscillator only occurs when the indicator(s) that is/are required support the thesis (bullish vs. bearish).
Daily VWAP
MTF Trend
Traditional Bollinger Bands
RSI
MTF RSI Divergence
Stoch RSI
Ichimoku Cloud
Fib Retracement Levels
MACD
TTM Squeeze
Moneyflow
Custom Levels you can define (3 categories: Major, medium, minor)
For some indicators, there are specific settings to customize how they contribute to the overall score (i.e. MACD cross vs. shift vs. trending phase). It is also important to know that Algo fetches the indicator data from multiple timeframes, thereby adding reliability to the overall results.
----------------------
Algo Custom Logic
Algo is using my custom logic on when a certain indicator can be interpreted as bullish or bearish in the MTF horizon. If you want to find out about the reliability of certain indicators, I recommend disabling all the indicators except for the one you want to examine, and then see how the score reacts to price action.
----------------------
Timeframes
Due to script limitations, this version can only analyze the medium timeframes . It is best used with charts 2H+, it works on some 90m as well but ceases to work at 1H and below . It is also not compatible with higher timeframes . Upon using the same settings on the same ticker with different timeframes, you will see that the score shows a minor variance. This is because data is consolidated to match the timeframe, so it ultimately leads to minor differences. Find out for yourself what timeframe is the best to use with which market and which settings.
----------------------
How to Use
I'm going to add tooltips for the settings in the indicator UI with upcoming updates, so it becomes more clear on how to set Algo up properly. To prevent a loss of your customized settings, write them down somewhere in case a script update reverts the settings back to default.
You can find in-depth tutorials on how to use this indicator by browsing the links and resources in my signature.
