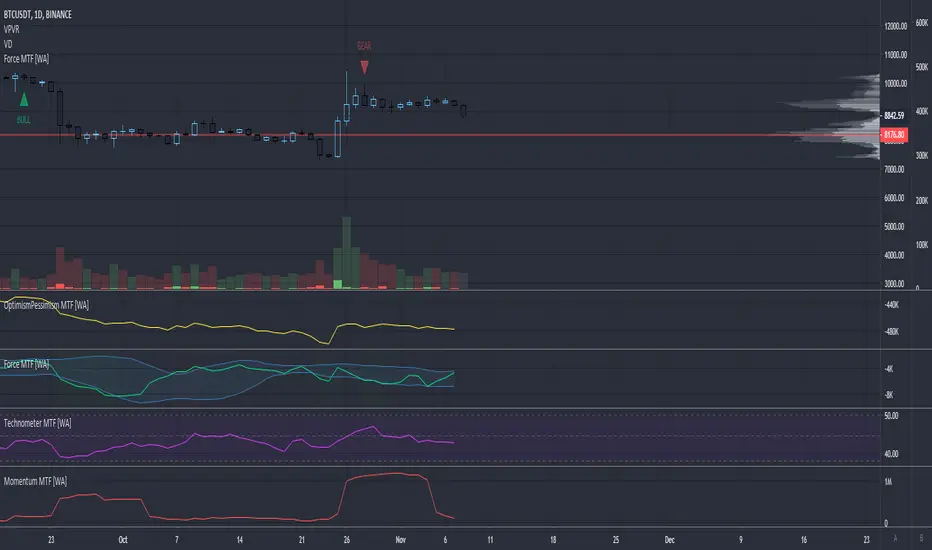
Technometer - Multi Timeframe [WYCKOFF ARSENAL]WYCKOFF ARSENAL is now available on TradingView!
Based on <> (Richard D. Wyckoff)
Noted Indicators:
▪ Optimism Pessimism Index
▪ Force Index
▪ Technometer ◄
▪ Momentum
Main Features:
▪ Multi Timeframe is available
▪ Volume based indicators
▪ Can be used on pairs that have volume data
────────────────────────────
Highlights
> Optimism Pessimism Index or OP
The value of the OP is not important.
The action of the OP is important.
The action of the index must be compared to its previous action or to the price index over the same period of time.
> Technometer or TEC
The purpose of the Technometer is to provide a mathematical indication of the degree to which the market is overbought or oversold.
The value of the Technometer could be as high as 100 or as low as 0.
The other possible values would represent degrees of overbought or oversold.
How to read the Technometer:
| Overbought means vulnerable to a reaction |
100 - completely overbought market.
── 60 - actual overbought extreme.
──── 50 or higher is considered to be clearly over bought.
────── lower than 50 - relatively overbought.
──────── Everything in between clearly overbought and clearly oversold is neutral.
────────── A reading of 44.4 is absolute neutrality.
──────── Everything in between clearly overbought and clearly oversold is neutral.
────── higher than 38 - relatively oversold.
──── 38 or lower is considered to be clearly over sold.
── 28 - actual oversold extreme.
0 - completely oversold market.
| Oversold means vulnerable to a rally |
> Force
The purpose of the Force Index is to provide an indication of the pressure being applied to push the market lower or the pull being applied to the market to pull it higher.
> Momentum
The purpose of the Momentum is to provide a measure of the speculative interest in the market.
Wyckoff

R100 Wave Volume v2 (*v*)This indicator is similar to the Weis Wave Volume indicator in that it shows cumulative volume for each up and down price wave. However it is calculated differently, using the Jurik moving average to determine turning points. Use this in conjunction with the R100 Wave indicator to determine the best fit Jurik length and power settings.
A great indicator to help analyse the strength of pullbacks, continuation moves and changes in behaviour.
I hope you get some value out of it. Only conditions of use are that if you improve it, let me know and if you publish something that uses it, don't hide the code! Enjoy!
Code pinched and modified from Zero Lag ZigZag by Duyck - thankyou
Jurik Moving Average (for turning points) by Everget - thankyou
and Weis Wave by Modhelius - thankyou
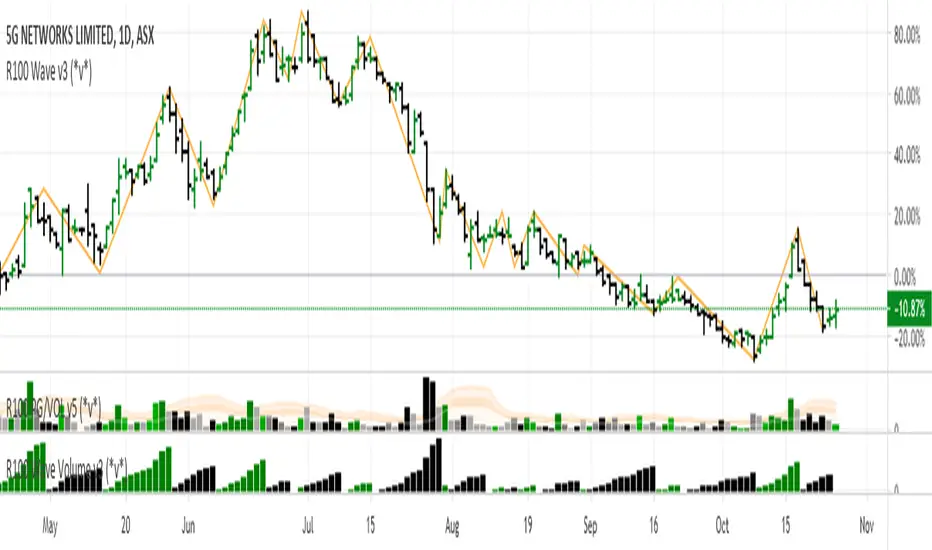
R100 Wave v2 (*v*)This is a Wave (or Zig Zag) indicator I made to use in conjunction with the Wave Volume indicator I use.
It uses the Jurik moving average to determine turning points, and will plot the tops and bottoms of the wave based on the most recent high- so you can also use to quickly find pivot highs and lows. If you are using with the R100 Wave Volume indicator, first adjust the wave to fit better (if required) using the Jurik length and/or power, and then use the same settings on the Wave Volume indicator. Default settings work pretty well for most stocks, but adjusting the length between 8 and 14 should be enough for a good fit, or adjust the power between 1 and 3, or get fussy and tweak it with both.
The Jurik MA has been modified to include a VWAP component, so will only work where you have volume. The last "leg" of the wave will move about until the next pivot high or low is found and then will remain fixed.
I hope you find some value with it. Only conditions of use are that if you improve it, let me know and if you publish something that uses it, don't hide the code! Enjoy!
Code pinched and modified from Zero Lag ZigZag by Duyck - thankyou
Jurik Moving Average (for turning points) by Everget - thankyou
and Weis Wave by Modhelius - thankyou

Force Index - Multi Timeframe [WYCKOFF ARSENAL]WYCKOFF ARSENAL is now available on TradingView!
Based on <> (Richard D. Wyckoff)
Noted Indicators:
▪ Optimism Pessimism Index
▪ Force Index ◄
▪ Technometer
▪ Momentum
Main Features:
▪ Multi Timeframe is available
▪ Volume based indicators
▪ Can be used on pairs that have volume data
────────────────────────────
Highlights
> Optimism Pessimism Index or OP
The value of the OP is not important.
The action of the OP is important.
The action of the index must be compared to its previous action or to the price index over the same period of time.
> Technometer or TEC
The purpose of the Technometer is to provide a mathematical indication of the degree to which the market is overbought or oversold.
The value of the Technometer could be as high as 100 or as low as 0.
The other possible values would represent degrees of overbought or oversold.
How to read the Technometer:
| Overbought means vulnerable to a reaction |
100 - completely overbought market.
── 60 - actual overbought extreme.
──── 50 or higher is considered to be clearly over bought.
────── lower than 50 - relatively overbought.
──────── Everything in between clearly overbought and clearly oversold is neutral.
────────── A reading of 44.4 is absolute neutrality.
──────── Everything in between clearly overbought and clearly oversold is neutral.
────── higher than 38 - relatively oversold.
──── 38 or lower is considered to be clearly over sold.
── 28 - actual oversold extreme.
0 - completely oversold market.
| Oversold means vulnerable to a rally |
> Force
The purpose of the Force Index is to provide an indication of the pressure being applied to push the market lower or the pull being applied to the market to pull it higher.
> Momentum
The purpose of the Momentum is to provide a measure of the speculative interest in the market.
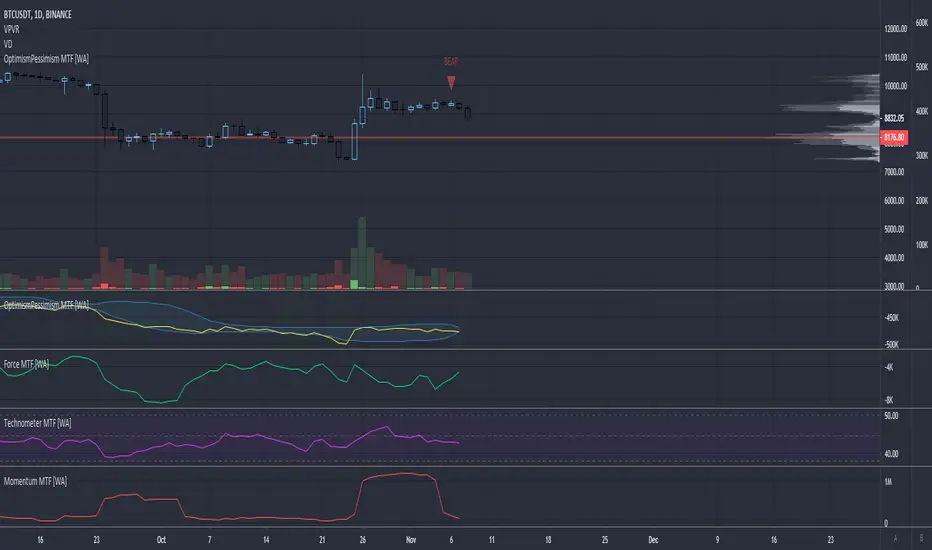
Optimism Pessimism Index - Multi Timeframe [WYCKOFF ARSENAL]WYCKOFF ARSENAL is now available on TradingView!
Based on <> (Richard D. Wyckoff)
Noted Indicators:
▪ Optimism Pessimism Index ◄
▪ Force Index
▪ Technometer
▪ Momentum
Main Features:
▪ Multi Timeframe is available
▪ Volume based indicators
▪ Can be used on pairs that have volume data
────────────────────────────
Highlights
> Optimism Pessimism Index or OP
The value of the OP is not important.
The action of the OP is important.
The action of the index must be compared to its previous action or to the price index over the same period of time.
> Technometer or TEC
The purpose of the Technometer is to provide a mathematical indication of the degree to which the market is overbought or oversold.
The value of the Technometer could be as high as 100 or as low as 0.
The other possible values would represent degrees of overbought or oversold.
How to read the Technometer:
| Overbought means vulnerable to a reaction |
100 - completely overbought market.
── 60 - actual overbought extreme.
──── 50 or higher is considered to be clearly over bought.
────── lower than 50 - relatively overbought.
──────── Everything in between clearly overbought and clearly oversold is neutral.
────────── A reading of 44.4 is absolute neutrality.
──────── Everything in between clearly overbought and clearly oversold is neutral.
────── higher than 38 - relatively oversold.
──── 38 or lower is considered to be clearly over sold.
── 28 - actual oversold extreme.
0 - completely oversold market.
| Oversold means vulnerable to a rally |
> Force
The purpose of the Force Index is to provide an indication of the pressure being applied to push the market lower or the pull being applied to the market to pull it higher.
> Momentum
The purpose of the Momentum is to provide a measure of the speculative interest in the market.
[djt] wv2Display volume totals of each wave of movement. With this you can generally determine when a trend is weakening by lesser relative wave volume in the trend direction whilst increasing volume in the reverse direction.
You can also identify absorption based on high volume waves with less wave distance.
Currently limited to around 50 wave counts per chart due to tradingview limits.
For best results, work through timeframes in the structure you're looking at to obtain the clearest vision of the directional waves.

Renko Weis Wave VolumeA volume bulls vs bears power indicator that is based entirely on Wyckoff Weis Wave Volume trends. This indicator is part of my DIVINE series RENKO indicators that run on an engine capable of extracting Renko brick information from a time series. As with the Renko RSI and Renko Trend Momentum indicators, swapping between Renko and time series type charts(bar, candlestick , heikin ashi) is seamless.
The algorithm uses the cumulative volume sum during the lifetime of a Renko brick formation. It tries hard to dissect and distribute volume when multiple bricks are formed during a single time candle (bar, candlestick , heikin ashi). Both positive and negative volume are plotted simultaneously, so that any instance where multiple bricks are created in a single time candle, positive and negative volume will be shown.
4 color themes as with all of the other DIVINE series indicators and strategies.
Shows ares of accumulation, distribution, capitulation. volatility .
Shows volatile brick locations with counts that indicate the number of nested bricks that were contained in a single time based candle.
Works well with Renko Price Bars Overlay script.
Reference to explanation of volatile brick information tips.
All feature requests are welcome. PM for access.

Wyckoff Historical VolatilityHi all this is a Historical volatility script that someone on youtube posted, his channel is Trade With Trend he is a very good trader, this script is mainly designed to work with the wyckoff method, im unsure if it works for any other trading style, this was designed mainly for swing trading if you do work with wyckoff method you should try it and check his video on his channel called: How To Use Wyckoff Trading Method For Price Action Trading - Swing Trading Strategies 🔥🔥
---i only compiled this--- for people that had no clue how to find it or how to do it just like i had a few hours ago i don't think anyone will use this but if you are searching for it feel free to use it.

TH_Accumulation/Distribution+Custom Accumulation / Distribution indicator enhanced with a cloud formed by moving averages for longer term bias.
Beware the way Acc/Dist indicator should be used is to map the levels and swing points to identify supply levels and not focus too much on the clouds.

Wyckoff Volume, Wyckoff Trend Tracking Trading SystemWyckoff Volume by Wyckoff Trend Tracking Trading System

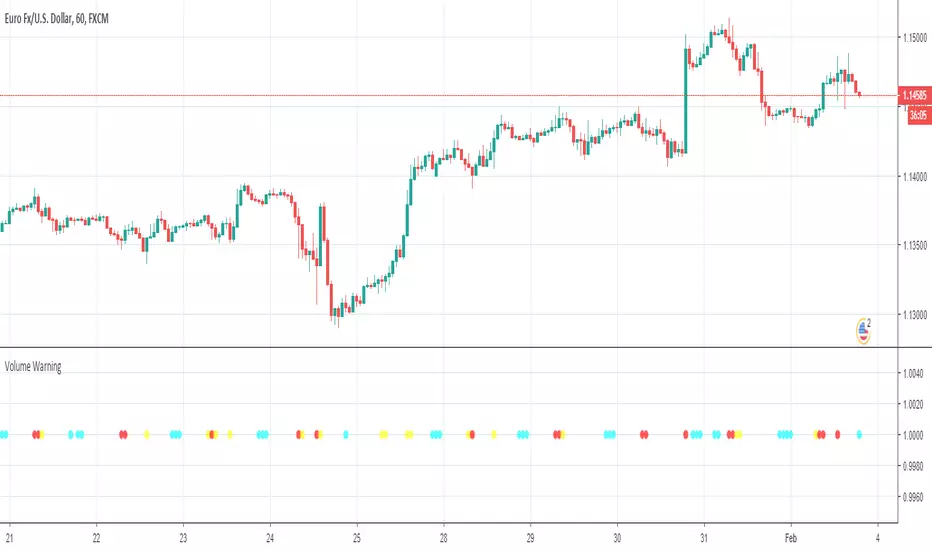
Volume Warning, Wyckoff Trend Tracking Trading SystemVolume Warning by Wyckoff Trend Tracking Trading System
Wyckoff Volume on Price, Wyckoff Trend Tracking Trading SystemWyckoff Volume on Price by Wyckoff Trend Tracking Trading System

Trend Strength, Wyckoff Trend Tracking Trading SystemTrend Strength by Wyckoff Trend Tracking Trading System

Wyckoff Trend Following, Wyckoff Trend Tracking Trading SystemWyckoff Trend Following by Wyckoff Trend Tracking Trading System

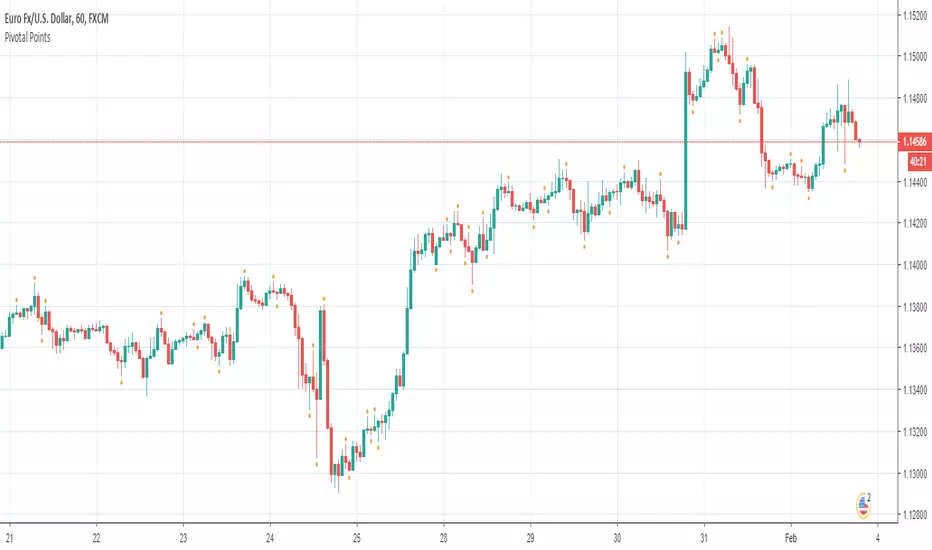
Pivotal Points, Wyckoff Trend Tracking Trading SystemPivotal Points by Wyckoff Trend Tracking Trading System
High Volatility Bar, Wyckoff Trend Tracking Trading SystemHigh Volatility Bar by Wyckoff Trend Tracking Trading System

Trend Strength Indicator, Wyckoff Trend Tracking Trading SystemTrend Strength Indicator by Wyckoff Trend Tracking Trading System

Wyckoff Trend Following, Wyckoff Trend Tracking Trading SystemWyckoff Trend Following by Wyckoff Trend Tracking Trading System

High Volatility Bar, Wyckoff Trend Tracking Trading SystemHigh Volatility Bar by Wyckoff Trend Tracking Trading System
Pivotal Points, Wyckoff Trend Tracking Trading SystemPivotal Points by Wyckoff Trend Tracking Trading System
Volume Warning, Wyckoff Trend Tracking Trading SystemVolume Warning by Wyckoff Trend Tracking Trading System
Wyckoff Volume, Wyckoff Trend Tracking Trading SystemWyckoff Volume by Wyckoff Trend Tracking Trading System

Wyckoff Volume on Price, Wyckoff Trend Tracking Trading SystemWyckoff Volume on Price by Wyckoff Trend Tracking Trading System
