PFA_PahadiPFA Pahadi Indicator
Market Structure through Swing Triangles
What is the PFA Pahadi Indicator?
The **PFA Pahadi Indicator** is a *price-structure visualization tool* that converts raw market movement into a series of **connected swing triangles**. By linking **Pivot Low → Pivot High → Pivot Low** and additionally connecting the **bases (Low → Low)**, the indicator visually resembles a *mountain (pahadi) range*—hence the name.
It focuses purely on **market structure**, not prediction, helping traders and analysts understand how price is *actually climbing, resting, and declining* over time.
Key Benefits
• Clear Market Structure
The indicator highlights **higher highs, higher lows, lower highs, and lower lows** in a clean, uncluttered way, making trend identification intuitive even on higher timeframes.
• Noise Reduction
By relying only on **confirmed pivots**, minor fluctuations are filtered out. This helps traders avoid reacting to short-term volatility and focus on meaningful swings.
• Visual Trend Strength Assessment
The *slope and shape* of the triangles reveal whether the trend is:
* Expanding (strong trend)
* Contracting (distribution / accumulation)
* Flattening (range / base building)
• Excellent for Positional & Swing Trading
Works particularly well on **weekly and daily charts**, where price structure matters more than intraday noise.
• No Repainting
All lines are drawn only after pivot confirmation. Once plotted, the structure does **not change retroactively**, ensuring analytical integrity.
• Complements Moving Averages & Volume
When combined with long-term averages or volume trends, the PFA Pahadi Indicator helps identify:
* Healthy pullbacks
* Structural breakdowns
* Failed rallies
Practical Use-Cases
• Trend Continuation Analysis
Higher base lines (Low → Low) indicate sustained accumulation and trend continuation.
• Structural Weakness Detection
Flattening or declining bases despite new highs may indicate **distribution** or **trend exhaustion**.
• Long-Term Support Mapping
The connected bases often act as *dynamic structural support zones* rather than exact price levels.
Limitations
• Not a Timing Indicator
The PFA Pahadi Indicator does **not provide entry or exit signals** on its own. It is a *context tool*, not a trigger.
• Lag Due to Confirmation
Because pivots require confirmation, the structure appears **after the move has occurred**. This is intentional for accuracy but unsuitable for scalping.
• Sensitive to Pivot Length Settings
Short pivot lengths may create too many triangles; longer lengths may miss smaller but tradable swings.
• Works Best in Trending Markets
In sideways or choppy conditions, the structure may appear flat and less informative.
Disclaimer
The PFA Pahadi Indicator is a market structure visualization tool and does not constitute investment advice, trading recommendations, or a guarantee of future performance. It is designed for educational and analytical purposes only.
All market decisions should be taken in conjunction with other tools such as volume analysis, risk management rules, broader market context, and individual financial suitability. Past price structures do not ensure future outcomes. Users are advised to validate the indicator across multiple securities and timeframes before applying it in live trading.
Philosophy Behind the Name
Markets don’t move in straight lines. They climb, pause, retrace, and climb again—just like a pahadi path. This indicator simply helps you see that path clearly.
Análise de Ondas

Bullish Structure (PAID) by @Crypto_alphabitTVC:GOLD
This script is for bullish structure........
___________________________________
to confirm the bullish structure , the price has to confirm the second higher low to confirm the uptrend ( ⬜️ The key level ) then the other levels will be automatic calculated with mathematic formula .
This indicator contains some important levels as below ....
__________________________________________________
🟥Stop Loss / lowest point
This level is the lowest point or 0 level & you can consider it as Stop Loss
🟫Strong support(0)
This level is very strong support and the price may not come back to that price after making the key level
⬜️The key Level
This level is the second higher low so the bullish structure confirmed for uptrend
🟪accumulation level(1) , 🟪accumulation level(2) , 🟪accumulation level(3)
The price is slowly moving between the 3 accumulation levels but if the price crossed the 3 levels with momentum , means we are in a very strong uptrend
🟫Strong Support(1) , 🟫Strong Support(2)
Those 2 levels are very strong support and strong resistance in the same time
⬜️Resistance
This level is very important as if the price closed above it so it is high probability that the price will go to the safe Exit
🟩Safe Exit
This is safest exit
🟨Golden Exit
This level is the golden exit if the price reached
🟦Extra Exit(1) , 🟦Extra Exit(2) , 🟦Extra Exit(3)
The price may or may not reach the 3 extra exit levels , it depends on the chart analysis, Gaps and momentum .
🟦Final Exit
This is the final target for that wave
In this indicator you can change some inputs to make it perfect as below ....
__________________________________________________
* Lookback Period for High/Low
* Line Width
* Show/ Hide Price Labels
* Label Size
* Extend Drawing for X Bars
* Swing Sensitivity ( Very important)
*** To confirm the bullish momentum you can add MACD indicator as a helper ***
*** To confirm the targets you can match the targets with Gaps ***
________________________________________________________________
This script is by @Crypto_alphabit

CD + NX (with CD Bottom Alert)It combines custom bands with optional buy & sell signals, making it easier to spot potential entry and exit opportunities across multiple timeframes.
梯子NX指标,显示长短周期趋势
the buy & sell signals is no repaint or using the future functionality.
cd指标,无未来函数 repaint的抄底卖出指标
after buying, I will provide a PDF and more information for how to use this one.
添加抄底警报,详细用法/打法付费后会有详细教程

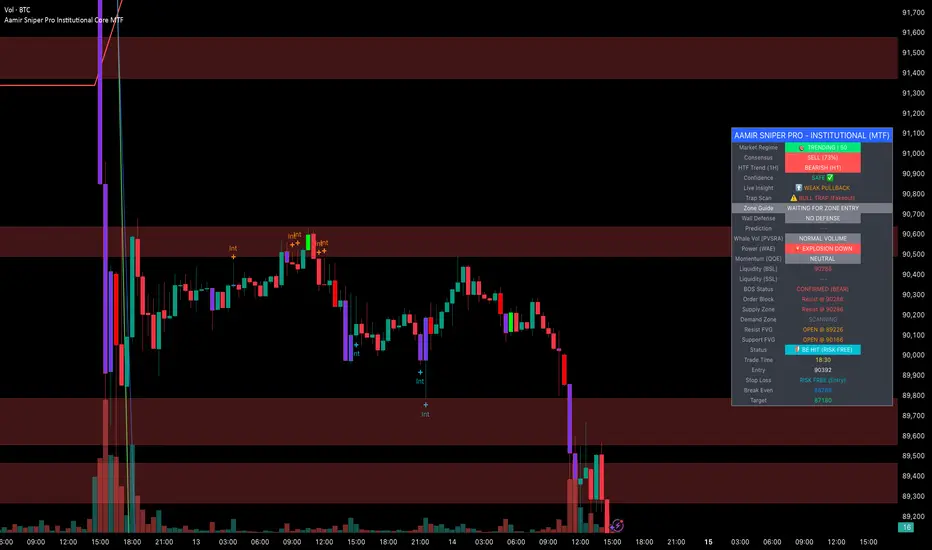
Aamir Sniper Pro Institutional Core MTFConcept & Utility: This script is a comprehensive "Multi-Factor Confluence System" designed to filter out market noise by requiring agreement between Trend, Momentum, Volatility, and Market Structure before generating a signal.
Many traders struggle with false signals generated by single indicators. This script solves that problem by using a Consensus Engine. Instead of relying on just one moving average or oscillator, this script aggregates data from over 20 different technical methods. It then applies strict filters (WAE, ADX, and MTF) to ensure that trades are only suggested during high-probability market conditions.
How the Components Work Together:
1. The Consensus Engine (The Core Logic): At the heart of the script is a voting system. It calculates the slope and direction of:
Fast/Slow EMAs, SMAs, WMAs, and Hull MA.
Ichimoku Cloud (Baseline/Conversion line).
SuperTrend and Parabolic SAR.
Oscillators (RSI, Stochastic, CCI).
Result: It generates a "Consensus Score" (0-100%). A signal is ONLY considered if the Bullish or Bearish score exceeds the user-defined threshold (Default: 70%).
2. The Filtering Layers (Why this is not just a mashup): A high consensus score alone is not enough. The script validates the signal through three mandatory filters:
Volatility Filter (WAE): Uses Waddah Attar Explosion logic to ensure there is enough volume/power to sustain the move.
Regime Filter (ADX): Checks the Average Directional Index. If the market is choppy (ADX < 25), the signal is blocked to prevent whipsaws.
MTF Filter: Checks the trend on a Higher Timeframe (Default: 1 Hour). It forces the user to trade only in the direction of the dominant trend.
3. Structural Context (SR Zones): We have integrated Dynamic Support & Resistance Zones based on Pivot Points.
Purpose: This provides immediate structural context. Even if the Consensus Engine gives a "BUY" signal, the trader can see if price is currently sitting at a "Resistance Box." This visual aid prevents buying into supply or selling into demand.
4. Institutional Volume (PVSRA): Candles are colored based on Volume Spread Analysis (PVSRA) concepts.
Purple/Blue Candles: Indicate "Whale Activity" (Volume > 200% of average). This helps confirm if institutional money is backing the move identified by the Consensus Engine.
5. Momentum Confirmation (QQE): The Qualitative Quantitative Estimation (QQE) is displayed on the dashboard to confirm short-term momentum direction, acting as the final trigger.
Features:
Sniper Mode: Option to wait for a candle retest before entry.
Dashboard: Displays the live Consensus Score, Market Regime, and Trend Status.
Risk Management: Auto-calculates SL/TP based on Swing High/Low or ATR.
Credits & Attribution:
WAE Logic: Adapted from the work of Waddah Attar.
PVSRA: Volume concepts adapted from the Traderathome/PVSRA community.
QQE: Adapted from standard open-source logic.
SR Zones: Logic derived from standard Pivot Point calculations.
Harmonic Patterns (Experimental) [Kodexius]Harmonic Patterns (Experimental) is a multi pattern harmonic geometry scanner that automatically detects, validates, and draws classic harmonic structures directly on your chart. The script continuously builds a pivot map (swing highs and swing lows), then evaluates the most recent pivot sequence against a library of harmonic ratio templates such as Gartley, Bat, Deep Bat, Butterfly, Crab, Deep Crab, Cypher, Shark, Alt Shark, 5-0, AB=CD, and 3 Drives.
Unlike simple “pattern exists / pattern doesn’t exist” indicators, this version scores candidates by accuracy . Each pattern includes “ideal” ratio targets, and the script computes a total error score by measuring how far the observed ratios deviate from the ideal. When multiple patterns could match the same pivot structure, the script selects the best match (lowest total error) and displays that one. This reduces clutter and makes the output more practical in real market conditions where many ratio ranges overlap.
The end result is a clean, information rich visualization of harmonic opportunities that is:
-Pivot based and swing aware
-Ratio validated with configurable tolerance
-Direction filtered (bullish, bearish, or both)
-Ranked by accuracy to prefer higher quality matches
Note: This is an experimental pattern engine intended for research, confluence and chart study. Harmonic patterns are probabilistic and can fail often. Always combine with your own risk management and confirmation tools.
🔹 Features
🔸Pivot Detection
The script uses pivot functions to detect structural turning points:
-Pivot Left Bars controls how many bars must exist on the left of the pivot
-Pivot Right Bars controls confirmation delay on the right (smaller value reacts faster)
Additionally, a Min Swing Distance (%) filter can ignore tiny swings to reduce noise. Pivots are stored separately for highs and lows and capped by Max Pivots to Store to keep the script efficient.
🔸Pattern Library (XABCD and Beyond)
Supported structures include:
-Gartley, Bat, Deep Bat, Butterfly, Crab, Deep Crab
-Cypher (uses XC extension and CD retracement logic)
-Shark and Alt Shark (0-X-A-B-C mapping)
-5-0 (AB and BC extensions with CD retracement)
-AB=CD (symmetry and proportionality checks)
-3 Drives (6 point structure, drive and retracement ratios)
Each pattern is defined by ratio ranges and also “ideal” ratio targets used for scoring.
🔸 Pattern Fibonacci Rules (Detailed Ratio Definitions)
This script validates each harmonic template by measuring a small set of Fibonacci relationships between the legs of the pattern. All measurements are computed using absolute price distance (so the ratios are direction independent), and then a directional sanity check ensures the geometry is positioned correctly for bullish or bearish cases.
How ratios are measured
Most patterns in this script use the standard X A B C D harmonic structure. Four ratios are evaluated:
1) XB retracement of XA
This measures how much price retraces from A back toward X when forming point B .
xbRatio = |B - A| / |A - X|
2) AC retracement of AB
This measures how much point C retraces the AB leg.
acRatio = |C - B| / |B - A|
3) BD extension of BC
This measures the “drive” from C into D relative to the BC leg.
bdRatio = |D - C| / |C - B|
4) XD retracement of XA
This is the most important “completion” ratio in many patterns. It measures where D lands relative to the original XA swing.
xdRatio = |D - A| / |A - X|
Important: the script applies a user defined Fibonacci Tolerance to each accepted range, meaning the pattern can still pass even if ratios are slightly off from the textbook values.
🔸 XABCD Pattern Ratio Templates
Below are the exact ratio rules used by the templates in this script.
Gartley
-XB must be ~0.618 of XA
-AC must be between 0.382 and 0.886 of AB
-BD must be between 1.272 and 1.618 extension of BC
-XD must be ~0.786 of XA
In practice, Gartley is a “non extension” structure, meaning D usually remains inside the X boundary .
Bat
-XB between 0.382 and 0.50 of XA
-AC between 0.382 and 0.886 of AB
-BD between 1.618 and 2.618 of BC
-XD ~0.886 of XA
Bat patterns typically complete deeper than Gartley and often create a sharper reaction at D.
Deep Bat
-XB ~0.886 of XA
-AC between 0.382 and 0.886 of AB
-BD between 1.618 and 2.618 of BC
-XD ~0.886 of XA
Deep Bat uses the same completion zone as Bat, but requires a much deeper B point.
Butterfly
-XB ~0.786 of XA
-AC between 0.382 and 0.886 of AB
-BD between 1.618 and 2.618 of BC
-XD between 1.272 and 1.618 of XA
Butterfly is an extension pattern . That means D is expected to break beyond X (in the completion direction).
Crab
-XB between 0.382 and 0.618 of XA
-AC between 0.382 and 0.886 of AB
-BD between 2.24 and 3.618 of BC
-XD ~1.618 of XA
Crab is also an extension pattern . It often produces a very deep D completion and a strong reaction zone.
Deep Crab
-XB ~0.886 of XA
-AC between 0.382 and 0.886 of AB
-BD between 2.0 and 3.618 of BC
-XD ~1.618 of XA
Deep Crab combines a deep B point with a strong XA extension completion.
🔸 Cypher Fibonacci Rules (XC Based)
Cypher is not validated with the same four ratios as XABCD patterns. Instead it uses an XC based completion model:
1) B as a retracement of XA
xb = |B - A| / |A - X| // AB/XA
Must be between 0.382 and 0.618 .
2) C as an extension from X relative to XA
xc = |C - X| / |A - X| // XC/XA
Must be between 1.272 and 1.414 .
3) D as a retracement of XC
xd = |D - C| / |C - X| // CD/XC
Must be ~ 0.786 .
This makes Cypher structurally different: the “completion” is defined as a retracement of the entire XC leg, not XA.
🔸 Shark and Alt Shark Fibonacci Rules (0-X-A-B-C Mapping)
Shark patterns are commonly defined as 0 X A B C . In this script the pivots are mapped like this:
0 = pX, X = pA, A = pB, B = pC, C = pD
So the final pivot (stored as pD) is labeled as C on the chart.
Three ratios are validated:
1) AB relative to XA
ab_xa = |B - A| / |A - X|
Must be between 1.13 and 1.618 .
2) BC relative to AB
bc_ab = |C - B| / |B - A|
Must be between 1.618 and 2.24 .
3) OC relative to OX
oc_ox = |C - 0| / |X - 0|
For Shark it must be between 0.886 and 1.13 .
For Alt Shark it must be between 1.13 and 1.618 (a deeper / more extended completion).
🔸 5-0 Fibonacci Rules
5-0 is validated as a sequence of extensions and then a fixed retracement:
1) AB extension of XA
ab_xa = |B - A| / |A - X|
Must be between 1.13 and 1.618 .
2) BC extension of AB
bc_ab = |C - B| / |B - A|
Must be between 1.618 and 2.24 .
3) CD retracement of BC
cd_bc = |D - C| / |C - B|
Must be approximately 0.50 .
Note that for 5-0 the script does not rely on an XA completion ratio like 0.786 or 1.618. The defining completion is the 0.5 retracement of BC.
🔸 AB=CD Fibonacci Rules
AB=CD is a symmetry pattern and is treated differently from the harmonic templates:
1) AB and CD length symmetry
The script checks if CD is approximately equal to AB within tolerance.
2) BC proportion
BC/AB is expected to fall in a common Fibonacci retracement zone:
-approximately 0.618 to 0.786 (with a looser tolerance in code)
3) CD/BC expansion
CD/BC is expected to be an expansion ratio:
-approximately 1.272 to 1.618 (also with a looser tolerance)
This allows the script to capture both classic equal leg AB=CD and common “expanded” variations.
🔸 3 Drives Fibonacci Rules (6 Point Structure)
3 Drives is a 6 point structure and is validated using retracement ratios and extension ratios:
Retracement rules
Retracement 1 must be between 0.618 and 0.786 of Drive 1
Retracement 2 must be between 0.618 and 0.786 of Drive 2
Extension rules
Drive 2 must be between 1.272 and 1.618 of Retracement 1
Drive 3 must be between 1.272 and 1.618 of Retracement 2
This pattern is meant to capture rhythm and proportional repetition rather than a single XA completion ratio.
🔸 Why the script can show “ratio labels” on legs
If you enable Show Fibonacci Values on Legs , the script prints the measured ratios near the midpoint of each leg (or diagonal, depending on pattern type). This makes it easy to visually confirm:
-Which ratios caused the pattern to pass
-How close the structure is to ideal harmonic values
-Why one template was preferred over another via the accuracy score
🔸 Fibonacci Tolerance Control
All ratio checks use a single tolerance input (percentage). This tolerance expands or contracts the acceptable ratio ranges, letting you decide whether you want:
-Tight, high precision matches (lower tolerance)
-Broader, more frequent matches (higher tolerance)
🔸 Direction Filter (Bullish Only / Bearish Only / Both)
You can restrict scanning to bullish patterns, bearish patterns, or allow both. This is useful if you are aligning with higher timeframe bias or only trading one side of the market.
🔸 Best Match Selection (Anti Clutter Logic)
When a new pivot confirms, the script evaluates all enabled patterns against the latest pivot sequence and keeps the one with the smallest total error score. This is especially helpful because many harmonic templates overlap in real time. Instead of drawing multiple conflicting labels, you get one “most accurate” candidate.
🔸 Clean Visual Rendering and Optional Details
The drawing system can display:
-Main structure lines (X-A-B-C-D or special mappings)
-Dashed diagonals for geometric context (XB, AC, BD, XD)
-Pattern fill to visually highlight the structure zone
-Point labels (X,A,B,C,D or 0..5 for 3 Drives, 0-X-A-B-C for Shark)
-Leg Fibonacci labels placed around midpoints for fast ratio reading
All colors (bullish and bearish line and fill) are configurable.
🔸 Pattern Spacing and Display Limits
To keep charts readable, the script includes:
-Max Patterns to Display to limit on-chart drawings
-Min Bars Between Patterns to avoid repeated signals too close together in the same direction
Older patterns are automatically deleted once the display limit is exceeded.
🔸 Alerts
When enabled, alerts trigger on new confirmed detections:
-Bullish Pattern Detected
-Bearish Pattern Detected
Alerts fire once per bar when a new pattern is confirmed by a fresh pivot.
🔹 Calculations
This section summarizes the core logic used under the hood.
1) Pivot Detection and Swing Filtering
The script confirms pivots using right side confirmation, then optionally filters them by minimum swing distance relative to the last opposite pivot.
// Pivot detection
float pHigh = ta.pivothigh(high, pivotLeftBars, pivotRightBars)
float pLow = ta.pivotlow(low, pivotLeftBars, pivotRightBars)
// Example swing distance filter (conceptual)
abs(newPivot - lastOppPivot) / lastOppPivot >= minSwingPercent
Pivots are stored in capped arrays (high pivots and low pivots), ensuring performance and stable memory usage.
2) Ratio Measurements (Retracement and Extension)
The engine measures harmonic ratios using two core helpers:
Retracement measures how much the third point retraces the previous leg.
Extension measures how much the next leg extends relative to the previous leg.
// Retracement: (p3 - p2) compared to (p2 - p1)
calcRetracement(p1, p2, p3) =>
float leg = math.abs(p2.price - p1.price)
float retr = math.abs(p3.price - p2.price)
leg != 0 ? retr / leg : na
// Extension: (p4 - p3) compared to (p3 - p2)
calcExtension(p2, p3, p4) =>
float leg = math.abs(p3.price - p2.price)
float ext = math.abs(p4.price - p3.price)
leg != 0 ? ext / leg : na
For a standard XABCD pattern the script evaluates:
-XB retracement of XA
-AC retracement of AB
-BD extension of BC
-XD retracement of XA
3) Tolerance Based Range Check
Ratio validation uses a flexible range check that expands min and max by the tolerance percent:
isInRange(value, minVal, maxVal, tolerance) =>
float tolMin = minVal * (1.0 - tolerance)
float tolMax = maxVal * (1.0 + tolerance)
value >= tolMin and value <= tolMax
This means even “fixed” ratios (like 0.786) still allow a user controlled deviation.
4) Positional Sanity Check for D (Beyond X or Not)
Some harmonic patterns require D to remain within X (non extension patterns), while others require D to break beyond X (extension patterns). The script enforces that using a boolean flag in each template.
Conceptually:
-If the pattern is an extension type, D should cross beyond X in the expected direction
-If the pattern is not extension type, D should stay on the correct side of X
This prevents visually incorrect “ratio matches” that violate the intended geometry.
5) Template Definitions (Ranges + Ideal Targets)
Every pattern includes ratio ranges plus ideal values. The ideal values are used only for scoring quality, not for pass/fail. Example concept:
-Ranges determine validity
-Ideal targets determine ranking
6) Accuracy Scoring (Total Error)
When a candidate passes all validity checks, the script computes an accuracy score by summing absolute deviations from ideal ratios:
calcError(value, ideal) =>
math.abs(value - ideal)
// Total error is the sum of the four leg errors (as available for the pattern)
totalError =
calcError(xbRatio, xbIdeal) +
calcError(acRatio, acIdeal) +
calcError(bdRatio, bdIdeal) +
calcError(xdRatio, xdIdeal)
Lower score means closer to the “textbook” harmonic proportions.
7) Best Match Resolution (Choosing One Winner)
When multiple enabled patterns match the same pivot structure, the script selects the one with the lowest totalError:
updateBest(currentBest, newCandidate) =>
result = currentBest
if not na(newCandidate)
if na(currentBest) or newCandidate.totalError < currentBest.totalError
result := newCandidate
result
This is a major practical feature because it reduces clutter and highlights the highest quality interpretation.
8) Bullish and Bearish Scanning Logic
The scanner runs when pivots confirm:
-Bullish patterns are evaluated on a newly confirmed pivot low (potential D)
-Bearish patterns are evaluated on a newly confirmed pivot high (potential D)
From that D pivot, the script searches backward through stored pivots to build a valid pivot sequence (X,A,B,C,D). If 3 Drives is enabled, it also attempts to find the extra preceding point needed for the 6 point structure.
9) Rendering: Lines, Fill, Labels, and Leg Fib Text
After detection the script draws:
-Primary legs with thicker lines
-Geometric diagonals with dashed lines (for XABCD types)
-Optional fill between selected legs to emphasize the structure area
-A summary label showing direction, pattern name, and ratios
-Optional point labels and leg ratio labels placed near midpoints
To avoid overlapping with candles, the script offsets labels using ATR:
float yOff = math.max(ta.atr(14) * 0.15, syminfo.mintick * 10)
10) Pattern Lifecycle and Cleanup
To respect chart limits and keep visuals clean, the script deletes old drawings once the maximum visible patterns threshold is exceeded. This includes lines, fills, and labels.

GeoWave v1.0See what other traders can't. GeoWave is the most sophisticated geometric indicator ever built for TradingView - a real-time pattern recognition engine that transforms raw price action into precise harmonic measurements and time cycle projections.
Advanced XABCD Pattern DNA
Automatically detects and measures the last 4 swings, calculating 6 critical harmonic ratios that reveal the hidden mathematical relationships governing market movements:
BcD Ratio (CD/BC) - Classic retracement relationships that predict reversal zones
AB/CD Ratio (CD/AB) - Primary harmonic structure defining complete market cycles
X1 Ratio (AD/BC) - Diagonal extensions that extend beyond traditional boundaries
X2 Ratio (AD/XC) - Complex cross relationships uncovering multi-dimensional patterns
XcD Ratio (CD/XC) - Extended retracements that capture prolonged market phases
XaD Ratio (AD/XA) - Time-space intersections where temporal and spatial forces converge
Precision Targeting Engine
Projects multiple target zones simultaneously with unprecedented accuracy:
Retracement Targets: BcD-based levels (0.382, 0.618, 1.618, 2.618) that pinpoint exact reversal points
Extension Targets: AbCd projections beyond pattern completion that anticipate future movements
Cross Targets: AdBc & AdXc harmonic intersections that identify high-probability convergence zones
Time Cycle Mastery
Don't just predict price. Predict time. GeoWave projects historical swing durations forward, identifying when turning points are statistically likely to occur. Project time cycles at 50%, 100%, and 200% (and more) of historical durations to anticipate market rhythm.
Multi-Level Geometric Analysis
Scans across 18 swing levels simultaneously, revealing nested harmonic structures that single-level indicators completely miss. Each level uses advanced adaptive filtering for precision detection of market's fractal nature.
Square the Range Integration
Implements W.D. Gann's "Square the Range" theory, creating geometric boxes where price and time vectors intersect at critical confluence zones that define major market turning points.
Intelligent Signal Scoring
Proprietary scoring algorithm weighs Fibonacci proximity, ratio type importance, and multi-level confluence. Color-coded signals highlight high-probability setups with detailed breakdown tooltips revealing the mathematical strength of each opportunity.
Adaptive Noise Cancellation
Proprietary filtering technology eliminates insignificant market noise, focusing only on structurally meaningful swing points that actually drive price direction and determine market fate.
Stop guessing. Start measuring. GeoWave doesn't draw pretty lines - it quantifies market geometry with mathematical precision, giving you the edge that institutional traders pay millions to develop.
Join the elite traders who've discovered the hidden geometric order behind every market move.

Dynamic MAs Zscore | Lyro RSThe Dynamic MAs Zscore is an adaptive momentum and valuation oscillator built around advanced moving averages and statistical Z-Score normalization. By combining a wide selection of moving average types with dynamic deviation bands, this indicator delivers clear insights into trend strength , directional bias , and relative valuation — all in a clean, visually intuitive format.
━━━━━━━━━━━━━━━
Key Features
━━━━━━━━━━━━━━━
Dynamic Moving Average Engine
Applies one of 12 selectable moving average types (SMA, EMA, WMA, VWMA, HMA, ALMA, TEMA, etc.) to the chosen source. This allows fine-tuning between responsiveness and smoothness depending on market conditions.
Z-Score Normalization
Transforms the selected moving average into a standardized Z-Score:
(MA − mean) / standard deviation
This normalization makes momentum strength comparable across assets and timeframes.
Adaptive Deviation Bands
Upper and lower bands are derived from the rolling standard deviation of the Z-Score:
Custom band length
Independent positive and negative multipliers
These bands dynamically expand and contract with volatility.
Dual Signal Modes
Trend Mode – Focuses on directional continuation. Color changes and signals occur when Z-Score breaks above or below deviation bands.
Valuation Mode – Highlights relative overvaluation and undervaluation using a gradient color scale and predefined value zones.
Advanced Visual System
Includes bold layered plots, gradient fills, background shading, and candle/bar coloring to clearly reflect current market state.
Custom Color Palettes
Choose from multiple preset themes (Classic, Mystic, Accented, Royal) or define your own bullish and bearish colors.
━━━━━━━━━━━━━━━
How It Works
━━━━━━━━━━━━━━━
MA Calculation – The selected moving average type is applied to the chosen price source.
Z-Score Computation – The MA is normalized over a user-defined lookback period to quantify deviation from its mean.
Band Construction – Standard deviation of the Z-Score is calculated over the band length and scaled by positive/negative multipliers.
Mode-Dependent Logic
Trend Mode – Breaks above the upper band signal bullish momentum; breaks below the lower band signal bearish momentum.
Valuation Mode – A gradient reflects relative valuation from undervalued to overvalued, with background highlights at extreme Z-Score levels.
━━━━━━━━━━━━━━━
Signal Interpretation
━━━━━━━━━━━━━━━
Trend Confirmation
In Trend Mode, sustained moves beyond deviation bands indicate strong directional bias.
Momentum Strength
The distance of the Z-Score from zero reflects the intensity of trend momentum.
Relative Valuation
In Valuation Mode, deep negative Z-Scores suggest undervaluation, while high positive Z-Scores suggest overvaluation.
Visual Clarity
Bar and candle coloring aligned with oscillator state allows for rapid assessment of market conditions.
━━━━━━━━━━━━━━━
Customization
━━━━━━━━━━━━━━━
Adjust MA type and length to balance speed vs. smoothness.
Modify Z-Score length to control sensitivity.
Tune band length and multipliers for volatility adaptation.
Switch between Trend and Valuation modes depending on strategy.
Personalize visuals using preset or custom color palettes.
━━━━━━━━━━━━━━━
Alerts
━━━━━━━━━━━━━━━
Bullish condition when Z-Score > 0
Bearish condition when Z-Score < 0
Overvalued and undervalued valuation alerts
⚠️ Disclaimer
This indicator is intended for technical analysis and educational purposes only. It does not guarantee profitable outcomes and should be used alongside other tools, confirmation methods, and sound risk management. The author is not responsible for any financial decisions made using this indicator.

Structure Pivot (LL-HL / HH-LH)Structure Pivot (LL-HL / HH-LH) - Indicator Guide
This indicator scans for market structure pivot patterns—specifically the bullish Higher Low (LL–HL) and the bearish Lower High (HH–LH) —across multiple lengths simultaneously.
It automatically selects the most optimal pattern based on a "Priority Mode" and plots the structure and breakout/breakdown levels on the chart.
1. Basic Calculation Method
The indicator builds upon TradingView’s ta.pivotlow and ta.pivothigh functions to identify structural points.
Bullish Structure (LL–HL)
1.LL (Lowest Low): A standard Pivot Low is identified.
2.HL (Higher Low): A subsequent Pivot Low forms higher than the previous LL. This completes the setup.
3.Pivot Line (Resistance): The indicator finds the highest price (High) that occurred between the LL and the HL. This level becomes the breakout trigger.
Bearish Structure (HH–LH)
1.HH (Highest High): A standard Pivot High is identified.
2.LH (Lower High): A subsequent Pivot High forms lower than the previous HH. This completes the setup.
3.Pivot Line (Support): The indicator finds the lowest price (Low) that occurred between the HH and the LH. This level becomes the breakdown trigger.
2. Multi-Length Scanning
Unlike standard indicators that use a single fixed length (e.g., Length = 5), this indicator scans a range of lengths simultaneously.
・Settings: Defined by Min Length and Max Length.
・Mechanism: If set to Min=2 and Max=10, the indicator internally runs 9 separate calculations (Length 2 through 10) in parallel.
This allows it to capture everything from small, short-term pullbacks to larger, significant structural pivots without manual adjustment.
3. Priority Mode System
Since multiple lengths are scanned, multiple valid patterns may appear at the same time. The Priority Mode determines which single pattern is the "winner" and gets displayed.
A. Tightest Structure (Default)
・For Bullish (Long): Selects the pattern with the lowest Pivot Line (Resistance).
・For Bearish (Short): Selects the pattern with the highest Pivot Line (Support).
・Advantage: It finds the "tightest" contraction (like a VCP). This offers the entry point closest to the stop-loss level, providing the best Risk/Reward ratio.
B. Longest Length
・Selects the pattern detected by the longest length setting.
・Advantage: Focuses on major structural points, filtering out short-term noise. Best for trend confirmation.
C. Shortest Length
・Selects the pattern detected by the shortest length setting.
・Advantage: Extremely sensitive. Best for scalping or catching immediate micro-pullbacks.
4. Real-Time Logic & Features
Structure Invalidation (Failure)
・Bullish: If the current price drops below the HL (the support of the structure), the setup is considered failed.
・Bearish: If the current price rises above the LH (the resistance of the structure), the setup is considered failed.
・Result: All lines and labels for that structure are immediately deleted to keep the chart clean.
Pivot Line Extension
・As long as the structure remains valid (price hasn't violated the HL or LH), the Pivot Line extends to the right, acting as a live reference for breakouts or breakdowns.
Alerts
・Bullish Breakout: Triggered when the Close price crosses over the Pivot Line.
・Bearish Breakdown: Triggered when the Close price crosses under the Pivot Line.

BTC Macro Regime & Stoch RSI SignalThis script is designed for traders who want to combine macro context with precise momentum timing on Bitcoin.
Instead of looking at isolated indicators, it aggregates several independent data streams into a single bias score and then uses a stochastic RSI engine to time entries and exits.
The goal is simple:
Filter the market into long / neutral / short regimes,
Only act when momentum aligns with the current regime,
Avoid overtrading in noisy or highly leveraged conditions.
What the indicator does (conceptually)
The script builds an internal “macro + momentum score” for BTC by combining:
Cycle / valuation regime
Tracks where BTC sits in the broader cycle (discount vs overheating) and whether conditions are favorable for medium-term upside or downside.
Network & miner trend regime
Monitors the health and trend of network activity / miners to detect stress, capitulation and recovery phases.
Derivatives / leverage regime
Looks at futures positioning to identify when leverage is excessive or has been flushed out, acting as a risk filter rather than a standalone entry trigger.
Price momentum (Stochastic RSI)
Uses a Stochastic RSI engine on price to capture short-term swings and turning points, especially at extremes.
All of this is compressed into a single score between −1 and +1, where:
Values near +1 indicate a supportive macro environment with bullish momentum,
Values near −1 indicate a risk-off / bearish environment,
Values around 0 indicate indecision or transition.
The exact construction, weights and thresholds are handled internally by the script.
Signals & visuals
The indicator provides:
A Total Score line:
Above a configurable upper level → long bias
Below a configurable lower level → short bias
In between → neutral / low conviction
Background shading:
Green tint when the regime favors long setups
Red tint when the regime favors short setups
Stochastic RSI panel:
K and D lines plotted on a 0–100 scale
The 0–10 zone is highlighted in green (deep oversold)
The 90–100 zone is highlighted in red (deep overbought)
Extreme cross markers:
A green marker when Stoch RSI crosses up in the lower extreme zone
A red marker when Stoch RSI crosses down in the upper extreme zone
Entry / exit markers (optional visual guide):
Long entry markers appear when:
The macro score is in long-bias territory, and
Stoch RSI confirms an upward cross from oversold conditions.
Short entry markers appear when:
The macro score is in short-bias territory, and
Stoch RSI confirms a downward cross from overbought conditions.
Exit markers appear when momentum flips against the active bias or the macro score degrades.
These markers are guides, not mechanical trading rules.
How to use it
Typical workflow:
Start with the Total Score
Use it as a regime filter:
Only look for longs when the score shows a sustained positive bias.
Only look for shorts when the score shows a sustained negative bias.
Then look at Stoch RSI
Use it to time pullbacks and reversals within the current bias:
In a long bias → favor bullish crosses from low levels.
In a short bias → favor bearish crosses from high levels.
Respect leverage conditions
When the internal risk engine flags crowded leverage, treat signals more conservatively:
Reduce size,
Tighten risk,
Or skip trades entirely if conditions look unstable.
This script is not meant to create a high-frequency scalping system. It is a context + timing framework for swing and positional trades on BTC.
Timeframes
The macro components are designed with higher-timeframe logic in mind.
Recommended:
Use 1D as the primary perspective for the bias,
Optionally refine entries on 4H if you want more precise timing.
Important notes & disclaimer
This tool is specifically tuned for Bitcoin, not for altcoins.
The internal logic, data processing and weighting are intentionally abstracted to keep the focus on the final score and signals rather than on raw formulas.
As with any indicator, it can produce false signals and whipsaws, especially during violent news events or regime shifts.
This is not financial advice. Always combine the script with your own analysis, sound risk management and position sizing. Use at your own risk.

FxAST Trend Force [ALLDYN]Attribution
This indicator is based on the original Trend Speed Analyzer created by Zeiierman .
FxAST Trend Force is a modified and simplified derivative that preserves the core methodology while focusing on clarity, usability, and practical trend interpretation .
This indicator is intended for educational and analytical use. Derivative works must retain attribution and license terms.
__________________________________________________________________________________
FxAST Trend Force
Overview
FxAST Trend Force is a directional pressure indicator designed to show who is in control of the market and how strong that control is, in real time.
Instead of measuring raw price speed or traditional momentum, this tool focuses on trend force — the sustained push of price relative to a dynamic trend baseline. The result is a clean, intuitive view of trend direction, strength, and condition without complex math or hard-to-interpret ratios.
This indicator is best used as a trend confirmation and trade management tool , not a standalone signal generator.
_________________________________________________________________________________
How It Works
FxAST Trend Force uses a Dynamic Moving Average (DMA) that adapts to changing market conditions. Price behavior relative to this adaptive trend line determines the current trend regime.
While price remains on one side of the trend:
Directional pressure accumulates
Strength builds or weakens
The regime resets only when price decisively crosses the trend
This creates a clear visual representation of trend persistence vs exhaustion , rather than short-term noise.
__________________________________________________________________________________
Core Concepts (Plain English)
Trend
Shows the current directional bias:
Bull → price above the dynamic trend
Bear → price below the dynamic trend
This answers: “Which side is currently in control?”
__________________________________________________________________________________
Strength
Displays how strong the current trend pressure is on a 0–100 scale , normalized to recent market conditions.
Strength is shown both as:
A simple label: Weak / Normal / Strong
A visual meter for quick interpretation
This answers: “Is this move weak, average, or meaningful?”
__________________________________________________________________________________
State
Indicates whether trend force is:
Building → pressure increasing
Fading → pressure weakening
This answers: “Is the trend gaining energy or losing it?”
__________________________________________________________________________________
Visual Meter
A compact bar at the bottom of the table represents trend force intensity at a glance.
Longer bar → stronger sustained pressure
Shorter bar → weaker or stalling trend
No ratios. No multipliers. Just visual clarity.
__________________________________________________________________________________
How to Use
Trend Confirmation
Favor longs when Trend = Bull and Strength = Normal/Strong
Favor shorts when Trend = Bear and Strength = Normal/Strong
__________________________________________________________________________________
Trade Management
Building state supports continuation
Fading state warns of exhaustion, consolidation, or potential reversal
__________________________________________________________________________________
Filtering Noise
Weak strength often signals chop or low-quality conditions
Strong force helps filter false breakouts
__________________________________________________________________________________
Settings (Simplified)
Maximum Length
Controls how smooth or responsive the dynamic trend is.
Accelerator Multiplier
Adjusts how quickly the trend adapts to price changes.
Lookback Period
Defines the window used to normalize trend force.
Enable Candles
Colors price candles by trend force for visual clarity.
Show Simple Table
Toggles the Trend / Strength / State display.
__________________________________________________________________________________
Philosophy
FxAST Trend Force is intentionally not a signal-spamming indicator.
It is designed to reduce cognitive load , not increase it.
If you need:
exact entries → use price action
exact exits → use structure
context and confirmation → use Trend Force
__________________________________________________________________________________
Disclaimer
This indicator is provided for educational purposes only and does not constitute financial advice. Trading involves risk, and users are responsible for their own decisions.

Previous Day Week Month Highs & Lows [MHA Finverse]Previous Day Week Month Highs & Lows is a comprehensive multi-timeframe indicator that automatically plots previous period highs and lows across Daily, Weekly, Monthly, 4-Hour, and 8-Hour timeframes. Perfect for identifying key support and resistance levels that often act as magnets for price action.
How It Works
The indicator retrieves the highest high and lowest low from the previous completed period for each selected timeframe. Lines extend forward into current price action, allowing you to see when price approaches or breaks these critical levels in real-time. The indicator tracks the exact bar where each high and low occurred, ensuring accurate historical placement.
---
Key Features
Multi-Timeframe Levels:
• Current Daily, Previous Daily, 4H, 8H, Weekly, and Monthly highs/lows
• Fully customizable colors and line styles (Solid, Dashed, Dotted)
• Adjustable line width and extension length
Visual Enhancements:
• Price labels showing exact level values
• Range position percentage (distance from high/low)
• Optional period boxes highlighting timeframe ranges
• Day and date labels for reference
Trading Tools:
• Breakout markers when price crosses key levels
• Touch count tracking (how many times price tested each level)
• Time at level display (consolidation detection)
• Customizable thresholds for touch and time analysis
Alert System:
• Individual alerts for each timeframe: Daily High/Low Break, 4H High/Low Break, 8H High/Low Break, Weekly High/Low Break, Monthly High/Low Break
• Toggle switches to enable/disable alerts per timeframe
• Clear messages showing which level was broken and at what price
---
How to Use
Setup:
1. Enable your preferred timeframes in "Highs & Lows MTF" settings
2. Customize colors and styles to match your chart
3. Turn on visual features like price labels and range percentages
4. Set up alerts by creating specific alert conditions or using toggle switches
Trading Applications:
Breakout Trading: Watch for strong momentum when price breaks above previous highs or below previous lows
Support/Resistance: Use these levels as potential reversal points for entry/exit signals
Range Trading: Trade between previous highs and lows using the range position indicator
Stop Loss Placement: Place stops just beyond previous highs (shorts) or lows (longs)
Multiple Timeframe Confirmation: Combine timeframes for stronger signals (e.g., Daily near Weekly support)
---
Best Practices
• Use Weekly/Monthly for swing trading, Daily/4H/8H for day trading
• Combine with volume or momentum indicators for confirmation
• Multiple timeframe levels clustering together create high-probability zones
• The more touches a level has, the more significant it becomes
---
Disclaimer
This indicator is a technical analysis tool for identifying price levels based on historical data. It does not guarantee profits or predict future movements. Trading involves substantial risk. Always use proper risk management and never risk more than you can afford to lose.

LL-HL PivotThis indicator scans for the bullish structure known as a Higher Low (HL) across multiple lengths simultaneously, automatically selects the most suitable pattern, and plots it on the chart.
Below is a detailed explanation of how it works.
1. Basic Calculation Method (Definition of LL and HL)
This indicator is built on TradingView’s ta.pivotlow function.
Detecting Pivot Lows
For a given length, a Pivot Low is identified as the lowest point among the candles within the specified range to the left and right.
LL and HL Determination
LL (Lowest Low): The most recent Pivot Low is treated as the previous low.
HL (Higher Low): When a new Pivot Low forms above the previous LL, it is recognized as an HL, and the setup is considered “complete.”
Identifying the Pivot Line
During the LL–HL structure, the highest high between them is identified and used as the breakout level (Pivot Line / resistance), where a horizontal line is drawn.
2. Multi-Length Scanning
Unlike standard indicators that use only one length (e.g., Length = 5), this indicator evaluates a full range of lengths.
Min Length to Max Length
Example: Min = 2, Max = 10
Internally, it functions as if nine separate indicators (Length 2, 3, 4 … 10) are running simultaneously.
This allows the indicator to capture:
Small waves (short-term pullbacks)
Larger waves (broader structural moves)
3. Priority Mode System
Because multiple lengths are calculated at the same time, different LL–HL patterns may appear simultaneously.Priority Mode determines which setup is selected and displayed.
A. Lowest LH
Selects the pattern with the lowest pivot line (intermediate high).
Advantages:
Produces the lowest possible entry price
B. Longest Length
Selects the pattern with the longest length.
Advantages:
Focuses on larger structures and broader waves
Filters out noise
C. Shortest Length
Selects the pattern with the shortest length.
Advantages:
Reacts quickly to small moves
Useful for scalping or fast trend-following
Captures very short-term pullbacks
4. Additional Behavior and Features
Real-Time Invalidation
If price breaks below the confirmed HL, the structure is immediately considered invalid.
All previously drawn lines and labels are removed instantly, preventing outdated structures from remaining on the chart.
Pivot Line Extension
As long as the HL remains intact, the Pivot Line (breakout level) continues extending to the right.
Alerts
An alert can be triggered the moment price breaks above the Pivot Line on a closing basis.

Structure Break ModelMAIN FEATURES
Supported Assets & Timeframe
This indicator is specifically designed and calibrated for 30 USDT trading pairs on the H4 timeframe, all of which have been actively traded for over 1,000 days, including:
BTCUSDT, ETHUSDT, XRPUSDT, BNBUSDT, SOLUSDT, TRXUSDT, DOGEUSDT, ADAUSDT, XLMUSDT, BCHUSDT,
ZECUSDT, LINKUSDT, HBARUSDT, UNIUSDT, LTCUSDT, AVAXUSDT, SHIBUSDT, DOTUSDT, AAVEUSDT, NEARUSDT,
ETCUSDT, ICPUSDT, FILUSDT, APTUSDT, ENSUSDT, ATOMUSDT, VETUSDT, QNTUSDT, CRVUSDT, INJUSDT
Using the script on other pairs or timeframes will trigger an automatic warning to prevent incorrect usage.
1. Structural Weakening Model (Core Logic)
At the heart of the system lies the Structural Weakening Model (SWM) — a multi-layered market-structure engine that identifies momentum exhaustion and confirms genuine reversals using pivot-based swing architecture.
Pivot Structure Mapping
The indicator continuously analyzes Pivot Highs and Pivot Lows (length = 5) to establish clean, stable swing structure.
Weakening Pattern Detection
The model evaluates directional fatigue by detecting pivot sequences:
2–6 Higher Lows → Weakening buyers → Potential SELL setup
2–6 Lower Highs → Weakening sellers → Potential BUY setup
This mechanism identifies “compression zones” where market pressure fades before a structural shift.
Breakout Confirmation Layer
A signal is only triggered when price breaks the final structural anchor of the pivot chain.
This ensures:
Optional Trend Filter (MA Alignment)
Users may select EMA, SMA, WMA, HMA and more.
Price above MA → BUY-only mode
Price below MA → SELL-only mode
This keeps signals aligned with broader market flow.
Visual Example – SELL Signal (TP Hit)
2. Signal Conditions (How the System Works)
SELL Setups
Triggered when:
Price forms 2–6 higher lows, signaling weakening buyers
Price breaks below the structural pivot anchor
(Optional) Price is below the MA filter
BUY Setups
Triggered when:
Price forms 2–6 lower highs, signaling weakening sellers
Price breaks above the structural pivot anchor
(Optional) Price is above the MA filter
Visual Example – SELL Signal (SL Hit)
3. Automatic Capital Management
The script integrates full risk-management utilities:
Starting capital (default 10,000 USDT)
Risk % per trade
Leverage (x10 → x100)
Automatic position sizing
Margin requirements
Real-time TP/SL calculations
This turns the indicator into not just a signal tool, but a complete trading assistant.
4. Flexible Stop-Loss System
Users may choose:
Swing-based SL (nearest structural pivot)
Fixed SL %
Custom TP based on R:R (1:1.5 → 1:5)
Default R:R = 1:2
SL/TP levels update instantly whenever settings change.
Input Settings Menu
5. Visual Interface
The chart displays:
Entry, TP, SL (extended 20 candles)
BUY/SELL labels
Real-time TP/SL hit status
Full info panel:
Latest signal
Entry price
TP/SL
Leverage
Risk %
Required margin
Win/loss & R statistics
Days on chart: The total number of trading days calculated from your chart’s visible data
All signals follow the exact same logic in historical and real-time charts.
Zero repainting.
6. Internal Backtest Engine (Not Official TradingView Backtesting)
The script includes an internal backtest calculator that evaluates:
SL methods
TP R:R settings
Signal quality
Aggregate R performance
⚠ This is an internal calculation tool, not the official TradingView Strategy Tester.
Its purpose is to help users understand how different settings behave when applied to past data.
7. 1-Day Free Trial
Users may message the author on TradingView to request:
1-day trial access
Ability to test signals in real-time
Compare different SL/RR settings
Verify that the indicator does not repaint
Inspect how the engine behaves on the supported 30-coin dataset
This allows users to evaluate the tool transparently before subscribing.
8. Market Coverage & Deep Backtest Basis This indicator is calibrated on the 30 largest USDT pairs, providing a deep historical dataset with stable liquidity and clearer structural swings. The long backtest range and high signal density help reduce noise and ensure more consistent behavior across different market conditions.
⚠ Disclaimer
This indicator is a quantitative analysis tool created for educational purposes only.
All “optimal settings” are derived from historical market behavior and do not guarantee future performance.
Market conditions change, and every trader must apply independent risk management.
Trading involves risk.
Use responsibly.

FOMC Federal Fund Rate Tracker [MHA Finverse]The FOMC Rate Tracker is a comprehensive indicator that visualizes Federal Reserve interest rate decisions and tracks market behavior during FOMC meeting periods. This tool helps traders analyze historical rate changes and anticipate market movements around Federal Open Market Committee announcements.
Key Features:
• Visual FOMC Periods - Automatically highlights each FOMC meeting period with colored boxes spanning from announcement to the next meeting
• Complete Rate Data - Displays actual rates, forecasts, previous rates, and rate differences for every meeting from 2021-2026
• Multiple Color Modes - Choose between cycle colors for visual distinction or rate difference colors (green for hikes, red for cuts, gray for holds)
• Smart Filtering - Filter periods by rate hikes only, cuts only, no change, or surprise moves to focus on specific market conditions
• Performance Metrics - Track average returns during rate hikes, cuts, and holds to identify historical patterns
• Volatility Analysis - Measure and compare price volatility across different FOMC periods
• Statistical Dashboard - View total hikes, cuts, holds, surprises, and longest hold streaks at a glance
• Built-in Alerts - Get notified 1 day before FOMC meetings, on meeting day, or when rates change
How It Works:
The indicator divides your chart into distinct periods between FOMC meetings, with each period showing a labeled box containing the meeting date, actual rate, forecast, previous rate, and rate difference. Future meetings are marked as "UPCOMING" to help you prepare for scheduled announcements.
Use Cases:
- Analyze how markets typically react to rate hikes vs. cuts
- Identify volatility patterns around FOMC announcements
- Backtest strategies based on monetary policy cycles
- Plan trades around upcoming Federal Reserve meetings
- Study the impact of surprise rate decisions on price action
Customization Options:
- Adjustable box transparency and outlines
- Customizable label sizes and colors
- Toggle individual dashboards on/off
- Filter specific types of rate decisions
- Configure alert preferences
This indicator is ideal for traders who incorporate fundamental analysis and monetary policy into their trading decisions. The historical data provides context for understanding market reactions to Federal Reserve actions.

FluxPulse Momentum [JOAT]FluxPulse Momentum - Adaptive Multi-Component Oscillator
FluxPulse Momentum is a composite oscillator that blends three distinct momentum components into a single, smoothed signal line. Rather than relying on a single indicator, it synthesizes adaptive RSI, normalized rate of change, and a Kaufman-style efficiency ratio to provide a multi-dimensional view of momentum.
What This Indicator Does
Combines RSI, Rate of Change (ROC), and Efficiency Ratio into one weighted composite
Applies EMA smoothing to reduce noise while preserving responsiveness
Displays overbought/oversold zones with optional background highlighting
Generates buy/sell signals when the oscillator crosses its signal line in favorable zones
Provides a real-time dashboard showing current state, momentum direction, and efficiency
Core Components
Adaptive RSI (50% weight) — Standard RSI calculation normalized around the 50 level
Normalized ROC (30% weight) — Rate of change scaled relative to its recent maximum range
Efficiency Ratio (20% weight) — Measures directional movement efficiency, inspired by Kaufman's adaptive concepts
The final composite is smoothed twice using EMA to create both a fast line and a signal line.
Signal Logic
// Buy signal: crossover in lower half
buySignal = ta.crossover(qmo, qmoSmooth) and qmo < 50
// Sell signal: crossunder in upper half
sellSignal = ta.crossunder(qmo, qmoSmooth) and qmo > 50
Signals are generated only when the oscillator is positioned favorably—buy signals occur below the 50 midline, sell signals occur above it.
Dashboard Information
The on-chart table displays:
Current oscillator value with gradient coloring
Momentum state (Overbought, Oversold, Bullish, Bearish, Neutral)
Momentum direction and acceleration
Efficiency ratio percentage
Active signal status
Inputs Overview
RSI Length — Period for RSI calculation (default: 14)
ROC Length — Period for rate of change (default: 10)
Smoothing Length — EMA smoothing period (default: 3)
Overbought/Oversold Levels — Threshold levels for zone detection
Await Bar Confirmation — Wait for bar close before triggering alerts
How to Use It
Watch for crossovers between the main line and signal line
Use overbought/oversold zones to identify potential reversal areas
Monitor the histogram for momentum acceleration or deceleration
Combine with price action analysis for confirmation
Alerts
Buy Signal — Bullish crossover in the lower zone
Sell Signal — Bearish crossunder in the upper zone
Overbought/Oversold Crosses — Level threshold crossings
This indicator is provided for educational purposes. It does not constitute financial advice. Always conduct your own analysis before making trading decisions.
— Made with passion by officialjackofalltrades

Linechart + Wicks - by SupersonicFXThis is a simple indicator that shows the highs and lows (wicks) on the linechart.
You can vary the colors.
Nothing more to say.
Hope some of you find it useful.

SuperWaveTrendWaveTrend with Crosses + HyperWave + Confluence Zones + Thresholds
SuperWaveTrend — Advanced Momentum System Integrating WaveTrend, HyperWave, Confluence Zones & Threshold Filters
SuperWaveTrend is an enhanced momentum indicator built upon the classic WaveTrend (WT) framework.
It integrates HyperWave extreme zones, top/bottom Confluence Zones, trend hesitation Threshold regions, WT crossover reversal signals, and more.
This indicator is suitable for:
• Trend following
• Swing trading
• Reversal spotting
• Overbought/oversold structure analysis
• Extreme market sentiment detection
Whether you’re scalping or planning swing entries, SuperWaveTrend offers a more precise and visually intuitive momentum structure.
Key Features
1. WaveTrend Core Structure (WT1 / WT2)
• WT1: Primary momentum line
• WT2: Signal line
• Momentum Spread Area (WT1 − WT2) visualization highlights shifts in trend strength
2. HyperWave Extreme Momentum Zones
Background highlight automatically appears during extreme momentum conditions:
• Purple-red: Extreme bullish zone
• Orange: Extreme bearish zone
Helps identify:
• Blow-off tops
• Panic sell-offs
• Extreme trend continuation phases
3. Confluence Zones (Top/Bottom Resonance)
Combines overbought/oversold signals with momentum structure to mark:
• Gold top zones → weakening bullish momentum
• Blue bottom zones → weakening bearish momentum
Useful for detecting:
• Bearish divergence tops
• Reversal bounces
• High-level exhaustion / low-level capitulation
4. Threshold Hesitation Zone (Gray)
When WT1 and WT2 converge tightly, a gray background highlights:
• Unclear direction
• Trend weakening
• Higher risk of false signals
Generally not recommended for new entries.
5. WT Crossover Signals (Cross Signals)
WT1 and WT2 crossovers are marked with color-coded dots:
• Green: Bullish cross
• Red: Bearish cross
A core signal for capturing reversal shifts.
⚠️ Creator’s Disclaimer & Usage Insights
***WARNING***
SuperWaveTrend is not designed for extremely strong one-sided trends.
During highly impulsive markets, signals may become delayed or less reliable.
Optimal Timeframes
Based on extensive backtesting, In swing-trading environments, the indicator performs most effectively on the 1H–4H timeframes, where momentum cycles form cleanly and Confluence Zones provide high-probability setups.
Trading Insights
• In swing-trading environments, Confluence Zones often coincide with excellent long/short opportunities, especially when momentum exhaustion is confirmed.
• When paired with a Bollinger Bands framework, the system exhibits significantly improved accuracy and structure clarity.
Have fun,
BigTrunks

ATR ZigZag - Volatility-Filtered Market StructureDescription
This indicator draws ZigZags using an ATR based threshold for direction switching to identify major swing highs and lows. Instead of relying on fractals or fixed bar-count swings, pivots are confirmed only when price moves beyond the prior extreme by:
threshold = ATR(length) × ATR_mult
This filters noise, enforces valid swing structure (high → low → high), and adapts automatically to volatility. The ATR ZigZag is ideal for traders who want a clean, objective view of swing structure without noise. This has many uses, including mapping swing structure, drawing chart patterns, and trading around extremes.
Lag and Repainting
Pivots are confirmed only after price moves sufficiently in the opposite direction. This creates necessary lag. The ZigZag is drawn when this occurs, and will anchor to the high/low in the past. Optional detection dot plots show exactly when confirmation occurred.
What You See
ZigZag: dashed gray line, repainted to anchor at the confirmed highs and lows
Latest Pivot Levels: Dashed horizontal lines at the most recent confirmed high/low.
Optional Live Swing Leg: A real-time line from the last confirmed pivot to the current swing extreme, updating until a new pivot forms.
Optional ATR Boxes: 1×ATR shaded zones around the latest pivot for structural context.
Optional Pivot Confirmation Dots: Markers show the bar where the threshold is crossed and a swing is officially confirmed. This is to understand the lag and see when the ZigZag repainted.

Volume Heatmap Oscillator (RSI-Normalized + M/B Format)Volume Heatmap Oscillator transforms raw volume into a 1–100 normalized strength scale, clearly showing where real volume enters the market instead of just displaying basic volume bars.
As seen in the example above, the color-based heatmap structure allows you to clearly identify:
Liquidity inflows
Early phase of price expansion
Aggressive buy/sell zones
Volume is tracked not only visually, but also numerically in M/B (Million / Billion) format, so you don’t rely on colors alone — you see the real size of participation.
Recommended Settings:
Normalization Length: 200
Smoothing: 60
M/B Labels: Optional
This tool is not designed as a standalone signal generator — it is built as a volume confirmation layer to strengthen your existing strategy.


Fib Green zone / Red zone + Elliott Wave 3═══════════════════════════════════════════
🎯 FIB GREEN ZONE / RED ZONE + ELLIOTT WAVE 3
═══════════════════════════════════════════
OVERVIEW
--------
A comprehensive technical analysis tool combining Fibonacci retracement levels
with Elliott Wave theory to identify high-probability trading opportunities.
KEY FEATURES
------------
✅ Dynamic Fibonacci Levels (0%, 23.6%, 38.2%, 50%, 61.8%, 78.6%, 100%)
✅ Color-Coded Trading Zones:
• Green Zone (0-23.6%): Strong support area
• Golden Zone (50-61.8%): High-probability reversal zone
• Red Zone (78.6-100%): Potential resistance area
✅ Elliott Wave 3 Detection:
• Automatic Wave 1 & 2 identification
• Wave 3 entry signals
• Golden Pocket setups (highest probability)
• Customizable retracement parameters
✅ Fully Customizable:
• Toggle individual levels on/off
• Customize all colors and line styles
• Adjust Elliott Wave sensitivity
• Show/hide labels and zones
IDEAL FOR
---------
- Day traders and swing traders
- Fibonacci-based trading strategies
- Elliott Wave practitioners
- Support/resistance trading
ALERT SYSTEM
------------
Built-in alerts for:
- Price crossing key Fibonacci levels
- Wave 3 entry signals
- Golden Pocket setups
HOW TO USE
----------
1. Apply to any timeframe (works best on 1min-1hr for intraday)
2. Watch for price action in zones
3. Wave 3 signals appear when setup criteria are met
4. Use with other confirmations (volume, price action, etc.)
IMPORTANT DISCLAIMER
-------------------
This indicator is for educational purposes only. It does not guarantee
profitable trades. Past performance does not indicate future results.
Always use proper risk management and conduct your own analysis.
═══════════════════════════════════════════
📧 For access requests or questions, please message me directly.

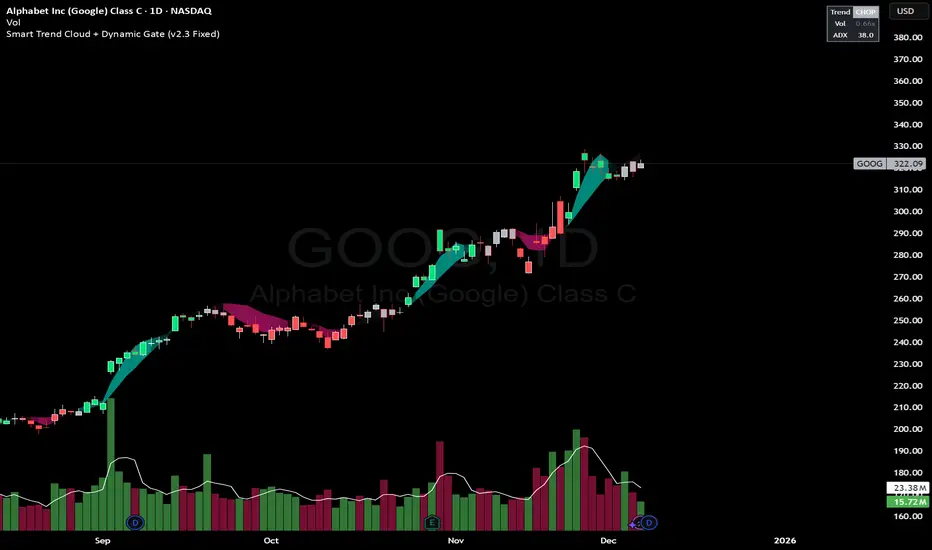
Smart Trend Cloud + Dynamic Gate (V 2.3)Smart Trend Cloud + Dynamic Gate
The Smart Trend Cloud + Dynamic Gate is a comprehensive trend-following system designed to filter out market noise and identify high-probability trend entries. Unlike simple Moving Average crossovers which often fail in ranging markets, this indicator employs a multi-stage validation system (The "Gate") combining Volume, Momentum, and Volatility filters to ensure you only trade when the market has conviction.
Key Features:
> Multi-Type Trend Cloud: Choose between HMA (Hull Moving Average), EMA, or ZeroLag EMA to define the trend baseline.
> The "Dynamic Gate" Filter: A crossover alone does not trigger a signal. The move must be validated by Relative Volume or MACD Histogram momentum within a specific window.
> Choppiness Suppression: Integrated ADX filter turns the candles gray during low-volatility consolidation zones to prevent over-trading.
> Stretch Bands: Optional ATR-based bands to highlight when price is over-extended from the mean.
> Live Dashboard: A table on the chart displaying current Trend State, Relative Volume strength, and ADX values.
How logic Works
1. Trend Definition & The Cloud The core trend is defined by the relationship between a Fast and Slow Moving Average.
Visuals: The space between these MA's forms the "Cloud". The cloud color transparency adjusts dynamically based on the strength of the trend (the spread between the MAs).
MA Options:
HMA: Best for scalping (1m/5m) due to low lag.
ZeroLag EMA: Custom calculation to reduce latency while retaining smoothness.
EMA: Standard trend following.
2. The Entry Gate (Validation) To avoid false signals during "whipsaw" price action, this script uses a logic gate. When a MA crossover occurs, it enters a "Pending" state. It only confirms a BULL or BEAR state if one of the following conditions is met within Gate Window bars:
Volume Spike: Relative Volume (Current Vol / Avg Vol) is greater than the defined threshold (default 1.2x).
Momentum Shift: The MACD Histogram confirms the direction of the trend.
3. Consolidation Filter The script calculates the ADX (Average Directional Index). If the ADX is below the Min ADX Strength threshold (default 20), the market is considered "Choppy."
Visual: Bars turn Gray.
Logic: Trend signals are suppressed until volatility expands.
4. Visual Dashboard A panel is located in the top-right corner providing real-time data:
Trend: Current State (Bull, Bear, or Chop).
Vol: Current Relative Volume (Green if > 1.0).
ADX: Current Trend Strength value.
Settings:
Trend Settings:
Adjust MA types and lengths to fit your timeframe.
Entry Gate: Toggle the Volume/Price gate on/off and adjust the Relative Volume requirement.
Consolidation: Enable/Disable the ADX filter to see all signals or only high-strength ones.
Visuals: Toggle the Cloud, Dashboard, or "Stretch Bands" (ATR bands) to declutter your chart.
Recommended Settings by Timeframe
Since different timeframes require different sensitivities to noise, here are the optimized settings for the Smart Trend Cloud:
⚡ 5 Minute Chart (Scalping)
Best for: Catching quick intraday momentum bursts while filtering chop.
MA Type: HMA (Hull Moving Average for speed)
Fast Length: 9
Slow Length: 21
Min Relative Volume: 1.3 (Requires higher volume to confirm entry)
Min ADX: 25 (Stricter chop filter)
⏱️ 15 Minute Chart (Intraday Swing)
Best for: Day trading with a balance of speed and stability.
MA Type: ZeroLag EMA (Reduces noise better than HMA)
Fast Length: 10
Slow Length: 30
Min Relative Volume: 1.2
Min ADX: 20
hrs 1 Hour Chart (Short-Term Swing)
Best for: Capturing the trend of the week.
MA Type: EMA or ZeroLag EMA
Fast Length: 12
Slow Length: 26 (Classic MACD correlation)
Min Relative Volume: 1.1
Min ADX: 20
📅 1 Day Chart (Position Trading)
Best for: Long-term trends and "Golden Cross" style entries.
MA Type: EMA (Standard Institutional Moving Average)
Fast Length: 20
Slow Length: 50
Min Relative Volume: 1.2
Min ADX: 15 (Allows for earlier entries on major trend shifts)
Alerts:
The script includes built-in alertcondition events for:
Trend Start: Bull (Valid trend detected after filtering).
Trend Start: Bear (Valid trend detected after filtering).
Access & Authorization
This is an Invite-Only script.
Sniper 50: The Trend Master [Pure Signal]Overview Sometimes, the simplest strategies are the deadliest. This indicator brings the legendary "EMA 50 Strategy" to your chart in its purest form. It is designed to capture major market trends and reversals immediately as they happen, stripping away complex filters that often cause lag.
Why the EMA 50? The 50-period Exponential Moving Average is widely regarded by institutional traders as the primary divider between bullish and bearish territory. This tool automates the monitoring of this key level.
How It Works The logic is raw and direct:
BUY Signal: Triggered immediately when the candle closes ABOVE the EMA 50.
SELL Signal: Triggered immediately when the candle closes BELOW the EMA 50.
Key Features
Zero Noise Technology: Includes a built-in state machine that prevents repetitive signals. You will receive exactly ONE signal when the trend flips, and silence until the next reversal.
Dynamic Visuals: The EMA line changes color (Green for Bullish, Red for Bearish) to give you instant context.
Lag-Free: unlike other tools that wait for multiple confirmations, this tool prioritizes speed to catch sharp moves (like sudden crashes or rallies).
Best For
Trend Following
Swing Trading (Crypto & Stocks)
Catching rapid reversals that complex indicators might miss.
