Institutional Volume RSI [Adaptive]The Institutional Volume RSI is a next-generation momentum oscillator designed to solve the two biggest problems with standard RSI: Price Deception and Static Thresholds.
Standard RSI uses fixed 70/30 levels to define "Overbought" and "Oversold." This is flawed because in a strong institutional trend, the market can stay "Overbought" for weeks. Selling just because RSI hit 70 is a guaranteed way to lose money.
This tool fixes that.
It replaces static lines with Adaptive Volatility Bands . These bands breathe with the market—expanding during trends and contracting during squeezes—giving you a dynamic, statistically significant view of true momentum.
How It Works
The engine runs on three institutional concepts:
1. Volume-Weighted Source (VWMA) 📊
We calculate RSI based on Volume Weighted Moving Average , not just Close price.
Low Volume Move: RSI ignores it (Fakeout).
High Volume Move: RSI reacts aggressively (True Momentum).
2. Adaptive Volatility Bands 🌊
Instead of fixed lines, we use dynamic bands (similar to Bollinger Bands) applied directly to the RSI.
The Trend Ride: As long as the RSI line stays inside or above the Upper Band, the trend is strong. Do not sell.
The Squeeze: When the bands contract (get tight), it signals that volatility is dead and a massive explosive move is imminent.
3. Dynamic Sentiment Coloring 🎨
Green Line: RSI is above the baseline (Bullish Control).
Red Line: RSI is below the baseline (Bearish Control).
White Dots: These appear when RSI breaks outside the bands, signaling an extreme statistical anomaly (often a climax top or bottom).
The "Elastic Snap" Strategy
Recommended Companion: Hooke's Law: Market Elasticity
This indicator is the perfect "Trigger" for a Mean Reversion system. We recommend pairing it with a Reversal indicator (like Hooke's Law) to create a complete Setup + Trigger system.
The Strategy Rules:
1. The Setup (The Stretch) 📏
Wait for your Reversal Indicator (e.g., Hooke's Law) to identify an overextended market condition (Overbought/Oversold).
Context: The rubber band is stretched tight.
2. The Trigger (The Snap) 🔫
Do not enter blindly! Look at the IV-RSI :
For Shorts: Wait for the RSI line to turn RED . This confirms that momentum has actually rolled over.
For Longs: Wait for the RSI line to turn GREEN . This confirms that buyers have stepped in.
3. The Filter (The Safety) 🛡️
If price hits your Stop Loss level before the IV-RSI changes color, cancel the trade . This prevents you from shorting a strong trend that is simply "melting up" without volume exhaustion.
Settings & Configuration
RSI Length: Default is 14.
Source Type: VWMA (Volume Weighted) is recommended for institutional analysis.
Bands Multiplier: Default is 2.0 (Standard Deviation). Increasing this to 2.5 will make the "White Dot" extremes rarer and more significant.
Disclaimer
Trading involves a high level of risk and is not suitable for all investors. The content provided here is for educational purposes only and does not constitute financial advice. Past performance is not indicative of future results. The author (abgthecoder) is not responsible for any financial losses incurred from the use of this indicator. Always use proper risk management and never trade with money you cannot afford to lose. This tool is provided "as is" with open source code for the benefit of the trading community.
Média Móvel Ponderada por Volume (MMPV)

AUTO FIB PRO - VWAP Bias and Retrace Breakouts (DAX NQ) v6AUTO FIB PRO by funnelzon automatically detects swing points (pivot highs/lows), draws dynamic Fibonacci levels, highlights the key retracement area (0.236–0.618), and prints continuation-style BUY/SELL signals after a retrace. It also includes VWAP + VWAP zone (ATR-based), a configurable trend filter (EMA200 / HTF EMA200 / VWAP / combined “BEST”), session & volatility filters, a CHOP blocker, a top-right “traffic light” status panel, and optional manual R/S zones (R1–R4 & S1–S4) with width presets and background highlighting.
1) Auto Swing → Auto Fibonacci
The script detects swing points using pivot highs/lows.
Once two valid swing points are available (P1 → P2), it plots Fibonacci levels:
0.236 / 0.382 / 0.500 / 0.618 / 0.786 / 1.000
Lines extend to the right and update automatically with new swings.
2) Retracement Box (0.236–0.618)
The yellow retracement box marks the key pullback area between 0.236 and 0.618.
Optional ATR padding can slightly widen the box (helps with “near touches”).
3) VWAP + VWAP Zone + VWAP Bias Label
VWAP line is optional.
VWAP zone is an ATR-based band around VWAP.
Bias label shows: BULL / BEAR / NEUTRAL, placed outside the chart (left/right selectable).
4) Filters (to avoid low-quality market phases)
Session Filter (DAX / NQ sessions in CET)
ATR-Min Filter (blocks low volatility)
CHOP Filter (blocks markets that get “stuck” inside the retracement zone for too long)
5) Signals (Continuation After Retrace)
Default behavior (Continuation ON):
Retracement zone must be touched first (setup becomes “armed”).
Signal triggers only when price breaks out across the box edge:
BUY: crossover above retrace top + bullish candle + filters OK
SELL: crossunder below retrace bottom + bearish candle + filters OK
Alternative (Continuation OFF):
More aggressive signals can trigger already inside the retracement box.
6) Signal Quality Modes
MORE Trades: looser rules, more signals (optional counter-trend allowed)
A+ ONLY: stricter rules (RSI + EMA slope + trend alignment)
7) Traffic-Light Panel (Top Right)
Shows in real time:
Auto preset type (DAX/NQ + Scalp/Swing + FAST/STABLE)
STATUS: TRADE OK / NO TRADE (and the reason)
Direction: LONG / SHORT / WAIT
Selected trend filter mode
VWAP bias
Pivot length
8) Manual Support/Resistance Zones (R1–R4 & S1–S4)
8 zones as price “areas” (boxes), extended left/right in time
Width presets: Narrow / Normal / Wide or Manual (Points/ATR)
Optional background highlighting when price is inside a zone
Key Features
Auto Swing Detection (Pivot High/Low) → builds P1 → P2 swing
Auto Fibonacci Levels: 0.236 / 0.382 / 0.500 / 0.618 / 0.786 / 1.000
Retracement Box: 0.236–0.618 (+ optional ATR padding)
VWAP Line + VWAP Zone (ATR-based)
VWAP Bias Label: BULL / BEAR / NEUTRAL (outside the chart)
Trend Filter Modes: OFF / EMA200 / HTF EMA200 / VWAP / HTF EMA200 + VWAP (BEST)
Trade Quality Modes:
MORE Trades (looser, more signals)
A+ ONLY (stricter: RSI + EMA slope + trend alignment)
Gate Filters:
Session filter (DAX / NQ CET sessions)
ATR-min filter (blocks low volatility)
CHOP filter (blocks extended sideways inside retrace zone)
Traffic Light Panel (Top Right): STATUS, DIR, FILTER, VWAP BIAS, PivotLen
Manual Zones (R1–R4 / S1–S4):
Width presets: Narrow / Normal / Wide (or Manual via Points/ATR)
Optional background highlight when price is inside a zone
Signals (Logic)
Default (Continuation ON):
Setup becomes “armed” after retracement zone touch
Signal triggers only on breakout:
BUY: close crosses above retrace top + bullish candle + filters OK
SELL: close crosses below retrace bottom + bearish candle + filters OK
Continuation OFF: more aggressive signals can trigger already inside the retracement box.
Recommended Setup (Quick Presets)
Clean & Reliable (recommended)
Auto Presets: ON
Mode: AUTO / SCALP (1/5/15)
Auto Fib Mode: STABLE
Quality: A+ ONLY
Continuation: ON
Trend Filter: HTF EMA200 + VWAP (BEST)
Session filter: ON
ATR-min: ON
CHOP filter: ON
More Trades
Auto Fib Mode: FAST
Quality: MORE Trades
Trend Filter: VWAP or EMA200
FAQ (Quick)
Q: Why do I see “NO TRADE” in the panel?
A: One of the gate filters blocks signals (outside session, ATR too low, or CHOP detected).
Q: Why no signals even though price is moving?
A: A valid swing (P1→P2) must exist, retrace zone must be touched (Continuation ON), and trend/quality filters must pass.
Q: What does CHOP mean here?
A: Price stayed inside the retracement zone for too many bars → higher noise → signals disabled until conditions improve.
Q: DAX vs NQ feels different — what should I change first?
A: Start with Market Preset, then adjust VWAP zone ATR mult and CHOP bars limit.
Disclaimer
Educational/analytical tool only. Not financial advice. Use risk management and confirm signals with market context.


VWMA Cross Buy SignalCore Components & Logic
1. The Entry Engine (VWMA + Filters)
The strategy triggers a long signal when a Volume Weighted Moving Average (VWMA) crossover occurs.
Unlike a standard Simple Moving Average, the VWMA gives more weight to bars with higher volume. This ensures the indicator responds faster to "Smart Money" moves and slower to low-volume noise.
It uses a secondary Trend Filter (defaulting to the 200 EMA). By only buying when the price is above this line, the indicator forces you to stay on the right side of the primary market trend.
It requires volume to be higher than its recent average (e.g., 1.1× or 10% higher). This prevents entries on weak, low-conviction price moves.
2. The Dynamic Exit System
You have two distinct ways to manage your risk and targets, toggleable in the settings:
ATR Based (Volatility Adjusted): It calculates the Average True Range (ATR) to determine how volatile the stock is. By setting your Stop Loss at 2.0×ATR, you avoid getting "shaken out" by normal daily price fluctuations. The Take Profit is set at 4.4×ATR to capture large trend extensions.
Fixed % (Static): A more rigid approach where you set a hard percentage target (e.g., 10% gain / 5% loss).
3. The Performance Analytics Table
The grey minimalist table in the bottom-right corner uses cumulative percentage-based math to show:
Realized RRR: The actual Reward-to-Risk ratio based on your closed trades.
Break-Even Win Rate: The minimum win rate you need to stay profitable with your current RRR. It uses the formula:
BE WR=1+RRR1
Current Win Rate: Highlighted in Green if you are beating the Break-Even rate, or Red if the strategy is currently losing money on that specific stock.
Max Drawdown %: The most important metric for risk. It shows the largest peak-to-trough decline in your equity curve, letting you know how much losing streak can hurt your equity.
Strategic Use Case
This indicator is optimized for Stock Screening. When you flip through your watchlist, the table updates instantly.
If you see a stock with a high Win Rate and a Max Drawdown under 10%, you have found a ticker where the VWMA crossover logic is highly compatible with that stock's specific volatility. If the Win Rate cell is Red, you know the strategy is "un-tuned" for that asset and needs adjustment.

Liquidation Bubbles [OmegaTools]🔴🟢 Liquidation Bubbles — Advanced Volume & Price Stress Detector
Liquidation Bubbles is a professional-grade analytical tool designed to identify forced positioning events, stop-runs, and liquidation clusters by combining price displacement and volume imbalance into a single, statistically normalized framework.
This indicator is not a repainting signal tool and not a simple volume spike detector. It is a contextual market stress mapper, built to highlight areas where one-sided positioning becomes unstable and the probability of forced order execution (liquidations, stops, margin calls) materially increases.
---
## 🔬 Core Concept
Market liquidations do not occur randomly.
They emerge when price deviates aggressively from its volume-weighted equilibrium while volume itself becomes abnormal.
Liquidation Bubbles detects exactly this condition by:
* Estimating a **dynamic equilibrium price** using an *inverted volume-weighted moving average*
* Measuring **directional price stress** relative to that equilibrium
* Measuring **volume stress** relative to its own adaptive baseline
* Normalizing both into **Z-score–like metrics**
* Highlighting only **statistically extreme, asymmetric events**
The result is a clear visual map of stress points where market participants are most vulnerable.
---
⚙️ Methodology (How It Works)
1️⃣ Advanced Inverted VWMA (Equilibrium Engine)
The script uses a custom Advanced VWMA, where:
* High volume bars receive less weight
* Low volume bars receive more weight
This produces a **robust equilibrium level**, resistant to manipulation and volume bursts.
This equilibrium is used for **both price and volume normalization**, creating a consistent statistical framework.
---
2️⃣ Price Stress (Directional)
Price stress is calculated as:
* The **maximum deviation** between high/low and equilibrium
* Directionally signed (upside vs downside)
* Normalized by its own historical volatility
This allows the script to distinguish:
* Aggressive upside exhaustion
* Aggressive downside capitulation
---
3️⃣ Volume Stress
Volume stress is measured as:
* Deviation from volume equilibrium
* Normalized by historical volume dispersion
This filters out:
* Normal high-volume sessions
* Illiquid noise
And isolates abnormal participation imbalance.
---
4️⃣ Liquidation Logic
A liquidation event is flagged when:
* Both price stress and volume stress exceed adaptive thresholds
* The imbalance is directional and statistically extreme
Optional Combined Score Mode allows aggregation of price & volume stress into a single composite metric for smoother signals.
---
🔵 Bubble System (Signal Hierarchy)
The indicator plots **two tiers of bubbles**:
🟢🔴 Small Bubbles
* Early warning stress points
* Localized stop-runs
* Micro-liquidations
* Often precede reactions or short-term reversals
🟢🔴 Big Bubbles
* Full liquidation clusters
* Forced unwinds
* High probability exhaustion zones
* Frequently align with:
* Intraday extremes
* Range boundaries
* Reversal pivots
* Volatility expansions
Bubble color:
* **Green** → Downside liquidation (sell-side exhaustion)
* **Red** → Upside liquidation (buy-side exhaustion)
Bubble placement is **ATR-adjusted**, ensuring visual clarity without overlapping price.
---
🔄 Cross-Market Volume Analysis
The script allows optional **external volume sourcing**, enabling:
* Futures volume applied to CFDs
* Index volume applied to ETFs
* Spot volume applied to derivatives
This is critical when:
* Your traded instrument has unreliable volume
* You want **institutional-grade confirmation**
---
🧠 How to Use Liquidation Bubbles
This indicator is **not meant to be traded alone**.
Best use cases:
* 🔹 Confluence with support & resistance
* 🔹 Contextual confirmation for reversals
* 🔹 Identifying fake breakouts
* 🔹 Liquidity sweep detection
* 🔹 Risk management (avoid entering into liquidation zones)
Ideal for:
* Futures
* Indices
* Crypto
* High-liquidity FX pairs
* Intraday & swing trading
---
🎯 Who This Tool Is For
Liquidation Bubbles is designed for:
* Advanced discretionary traders
* Order-flow & liquidity-based traders
* Macro & index traders
* Professionals seeking **context**, not signals
If you want **where the market is fragile**, not just where price moved — this tool was built for you.
---
📌 Key Characteristics
✔ Non-repainting
✔ Statistically normalized
✔ Adaptive to volatility
✔ Works on all timeframes
✔ Futures & crypto ready
✔ No lagging indicators
✔ No moving average crosses
---
Liquidation Bubbles does not predict the future.
It shows you where the market is most likely to break.
— OmegaTools

ATR-Normalized VWMA DeviationThis indicator measures how far price deviates from the Volume-Weighted Moving Average ( VWMA ), normalized by market volatility ( ATR ). It identifies significant price reversal points by combining price structure and volatility-adjusted deviation behavior.
The core idea is to use VWMA as a dynamic trend anchor, then measure how far price travels away from it relative to recent volatility . This helps highlight when price has stretched too far and may be due for a reversal or pullback.
How it works:
VWMA deviation is calculated as the difference between price and the VWMA.
That deviation is divided by ATR (Average True Range) to normalize for current volatility.
The script tracks the highest and lowest normalized deviations over the chosen lookback period.
It also tracks price structure (highest/lowest highs/lows) over the same period.
A reversal signal is generated when a historical extreme in deviation aligns with a price structure extreme, and a confirmed reversal candle forms.
You get visual signals and color highlights where these conditions occur.
Settings explained:
Lookback period defines how many bars the script uses to find recent extremes.
ATR length controls how volatility is measured.
VWMA length controls how the volume-weighted moving average is calculated.
Signal filters help refine entries based on price vs deviation behavior.
Display options let you customize how signals and levels appear on the chart.
This indicator is especially useful for spotting potential turning points where price has moved far from VWMA relative to volatility, suggesting possible exhaustion or overextension.
Tips for use:
Combine with broader trend context (higher timeframe support/resistance).
Use with risk management rules (position sizing, stops) — signals are guides, not guaranteed entries.
Adjust lookback and ATR settings based on your trading timeframe and asset volatility.

Bens Platypus Dual VWAP_Rolling 7D vs Weekly AnchoredBen’s Platypus Dual VWAP: Rolling 7D vs Weekly Anchored (optional σ bands)
Weekly-anchored VWAP resets on Monday (exchange time). That makes sense for assets tied to a traditional weekly “market open,” but BTC trades 24/7 and often doesn’t respect Monday as a real regime boundary—so the Monday reset can create a mechanical jump that looks like signal but is just arithmetic. If you drive entries/exits off that reset, some algos will get spooked into early entries, fake “stretch” readings, or sudden mean shifts that aren’t actually market behaviour.
This indicator fixes that by plotting:
• Rolling 7D VWAP (thick aqua): a continuous trailing VWAP that does not reset on Mondays, giving you a stable mean for reversion logic.
• Weekly Anchored VWAP (thin purple): kept for context, so you can see the reset effect rather than accidentally trade it.
Result: you can visually compare the two means and quantify when “weekly structure” is useful versus when it’s just a calendar artifact on a 24/7 market.

Percentile Rank Oscillator (Price + VWMA)A statistical oscillator designed to identify potential market turning points using percentile-based price analytics and volume-weighted confirmation.
What is PRO?
Percentile Rank Oscillator measures how extreme current price behavior is relative to its own recent history. It calculates a rolling percentile rank of price midpoints and VWMA deviation (volume-weighted price drift). When price reaches historically rare levels – high or low percentiles – it may signal exhaustion and potential reversal conditions.
How it works
Takes midpoint of each candle ((H+L)/2)
Ranks the current value vs previous N bars using rolling percentile rank
Maps percentile to a normalized oscillator scale (-1..+1 or 0–100)
Optionally evaluates VWMA deviation percentile for volume-confirmed signals
Highlights extreme conditions and confluence zones
Why percentile rank?
Median-based percentiles ignore outliers and read the market statistically – not by fixed thresholds. Instead of guessing “overbought/oversold” values, the indicator adapts to current volatility and structure.
Key features
Rolling percentile rank of price action
Optional VWMA-based percentile confirmation
Adaptive, noise-robust structure
User-selectable thresholds (default 95/5)
Confluence highlighting for price + VWMA extremes
Optional smoothing (RMA)
Visual extreme zone fills for rapid signal recognition
How to use
High percentile values –> statistically extreme upward deviation (potential top)
Low percentile values –> statistically extreme downward deviation (potential bottom)
Price + VWMA confluence strengthens reversal context
Best used as part of a broader trading framework (market structure, order flow, etc.)
Tip: Look for percentile spikes at key HTF levels, after extended moves, or where liquidity sweeps occur. Strong moves into rare percentile territory may precede mean reversion.
Suggested settings
Default length: 100 bars
Thresholds: 95 / 5
Smoothing: 1–3 (optional)
Important note
This tool does not predict direction or guarantee outcomes. It provides statistical context for price extremes to help traders frame probability and timing. Always combine with sound risk management and other tools.

OBV (Delta or regular)This is a quite simple script to apply some choices to OBV.
You can choose to use regular OBV values or you can choose to use delta OBV values.
Delta OBV values calculates the delta between selling volume and buying volume per bar to find discrepancies.
You can make the OBV a smoothed line or just keep the normal rigid line. Rigid line is default.
A secondary smoothed OBV line is added automatically with color change if the OBV is above or below the smoothed line.
You can set your desired MA from SMA, EMA, VWMA and WMA, The same will be applied to both lines if chosen to smooth them both.
Both lines are editable from the styles tab (visibility, color and line type)
If you for some reason don't want color change on the secondary line, chose the same color for both color 1 and 2.
Simple delta OBV example:
If a red bar has a long lower wick, OBV will calculate the entire bar towards bearish volume, while the delta will check if there's more buying or selling happening in total. Some times you'll be able to catch divergences in the volume which implies a reversal might be in the making.
For instance more selling on a green candle making the OBV drop instead of increasing or vise versa.
Hopefully someone finds is useful.

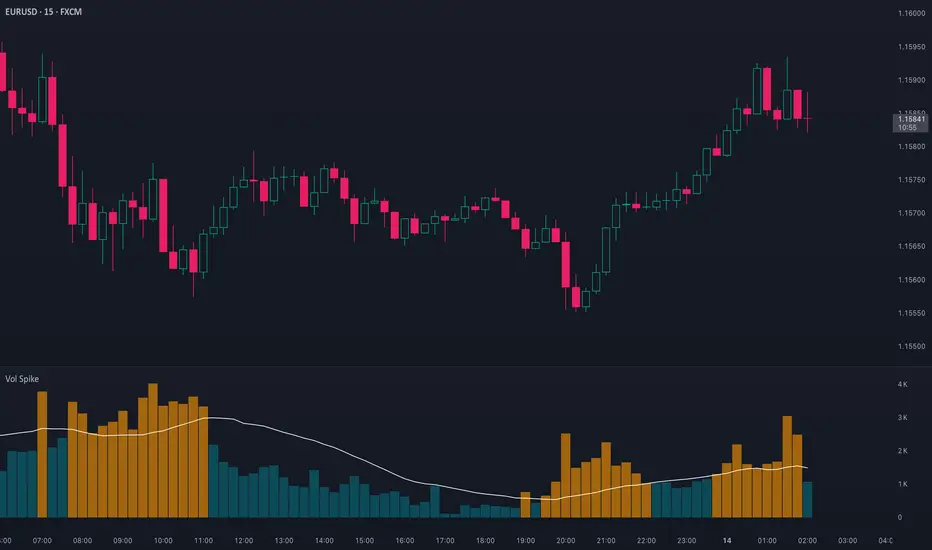
Volume Spike (Multi-Timeframe)Volume Spike (Multi-Timeframe)
Overview
Volume Spike (Multi-Timeframe) evaluates traded volume against its moving average on a selected timeframe so traders can identify when activity departs from recent norms.
What it does
Calculates volume on the chart timeframe or any alternate timeframe you select in the inputs.
Builds a configurable simple moving average to establish a rolling volume benchmark.
Applies distinct colors to spike and baseline volume columns to highlight deviations.
Plots the related moving-average line for reference.
Registers an alert condition when volume closes above its moving-average baseline.
How to use it
Choose the desired Volume Timeframe (leave blank to inherit the chart’s period).
Tune the Volume MA Length to balance responsiveness and noise.
Adjust the spike, base, and MA colors to align with existing chart styling.
Enable the alert condition when automated notification of spikes is needed.
Implementation notes
Timeframe selection is applied consistently to both the raw volume series and its moving average.
Color inputs allow visual adjustments without modifying code.
Alert messaging specifies that the event is a volume spike relative to the selected timeframe baseline.
Disclaimer
This indicator is designed as a technical analysis tool and should be used in conjunction with other forms of analysis and proper risk management.
Past performance does not guarantee future results, and traders should thoroughly test any strategy before implementing it with real capital.
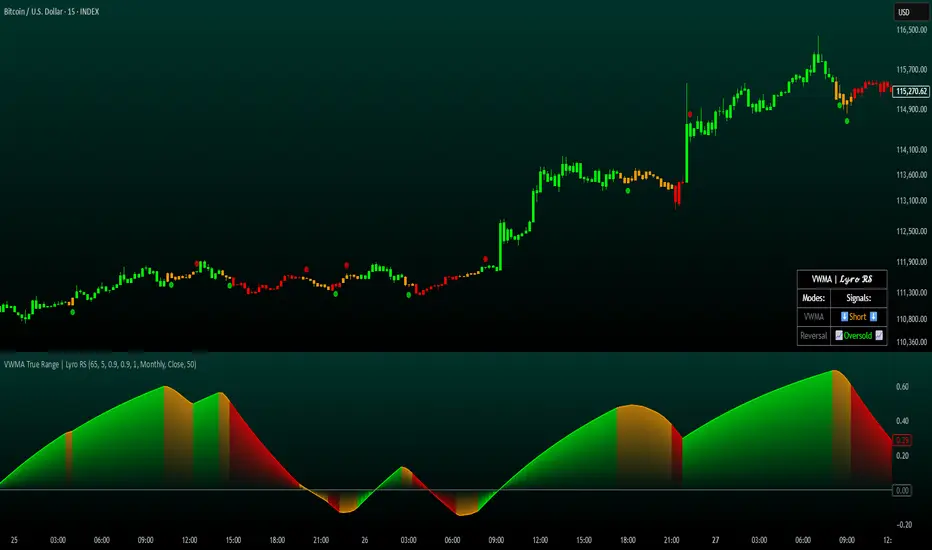
VWMA True Range | Lyro RSVWMA True Range | Lyro RS
This script is a hybrid technical analysis tool designed to identify trends and spot potential reversals. It employs a consensus-based system that uses multiple smoothed, Volume-Weighted Moving Averages (VWMA) to generate both trend-following and counter-trend signals.
Understanding the Indicator's Components
The indicator plots a main line on a separate pane and provides visual alerts directly on the chart.
The Main Line: This line represents a smoothed average of momentum scores derived from multiple VWMAs. Its direction and value are the foundation of the analysis.
Signal Generation: The tool provides two distinct types of signals:
Trend Signals: These trend-following signals ("⬆️Long" / "⬇️Short") activate when the indicator's consensus reaches a pre-set strength threshold, indicating sustained momentum in one direction.
Reversal Signals: These counter-trend alerts ("📈Oversold" / "📉Overbought") trigger when the main line breaks a previous period's level, hinting at exhaustion and a potential short-term reversal.
Visual Alerts:
Colored Background: The indicator's background highlights during strong trend signals for added visual emphasis.
Chart Shapes: Small circles appear on the main chart to mark where potential reversals are detected.
Colored Candles: You can choose to color the price candles to reflect the current trend signal.
Information Table: A compact table provides an at-a-glance summary of all currently active signals.
Suggested Use and Interpretation
Here are a few ways to incorporate this indicator into your analysis:
Following the Trend: Use the "Long" or "Short" trend signals to align your trades with the prevailing market momentum.
Spotting Reversals: Watch for "Oversold" or "Overbought" reversal signals, often accompanied by chart shapes, to identify potential market turning points.
Combining Signals: Use the primary trend signal for context and look for reversal signals that may indicate a pullback within the larger trend, potentially offering favorable entry points.
Customization Options:
You can tailor the indicator's behavior and appearance through several settings:
Core Settings: Adjust the Calculation Period and Smooth Length to make the main line more or less responsive to price movements.
Signal Thresholds: Fine-tune the Long threshold and Short threshold to control how easily trend signals are triggered.
Visual Settings: Toggle various visual elements like the indicator band, candle coloring, and the information table on or off.
Table Settings: Customize where the information table appears and its size to suit your chart layout.
⚠️Disclaimer
This indicator is a tool for technical analysis and does not guarantee future results. It should be used as part of a comprehensive trading strategy that includes other analysis techniques and strict risk management. The creators are not responsible for any financial decisions made based on its signals.
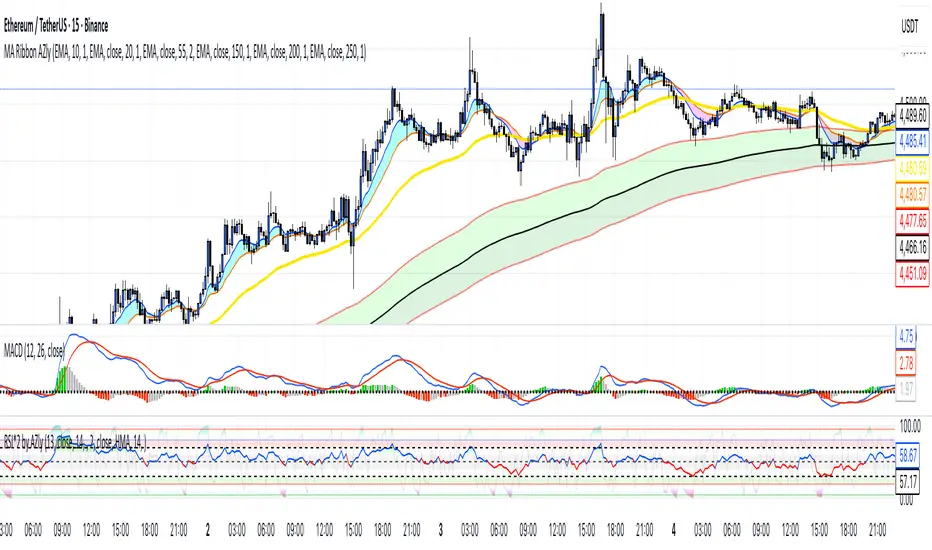
Moving Average Ribbon AZlyMoving Average Ribbon AZly
The Moving Average Ribbon AZly is a flexible trend-following indicator that visualizes market direction, strength, and transition phases using multiple customizable moving averages. It helps traders instantly identify when short-, medium-, and long-term trends align or diverge.
🔧 How it works
Up to six moving averages can be plotted, each with its own:
Type (SMA, EMA, SMMA, WMA, VWMA, or HMA)
Length, color, and width
Custom source input
The script also adds adaptive color fills between key pairs:
MA1–MA2: short-term momentum
MA4–MA5: mid-term bias
MA5–MA6: long-term trend
Bullish alignment paints green or blue ribbons, while bearish alignment turns them red or pink. The wider the ribbon, the stronger the trend separation.
💡 Why it’s better
Unlike typical ribbon indicators, this version offers full per-line customization, adaptive color fills, and a clean, high-contrast design that makes trend shifts instantly recognizable . It’s optimized for clarity, flexibility, and smooth performance on any market or timeframe.
🎯 Trading ideas
Trend confirmation: Trade only in the direction of the ribbon (green for long, red for short).
Early reversals: Watch for the fastest MAs (MA1–MA2) crossing the mid-term pair (MA4–MA5) as early signals of a trend shift.
Momentum compression: When the ribbon narrows or colors alternate rapidly, it signals consolidation or potential breakout zones.
Pullback entries: Enter trades when price bounces off the outer ribbon layer in the direction of the dominant trend.
Multi-timeframe use: Combine with a higher timeframe ribbon to confirm overall market bias.
📊 Recommended use
Works on all markets and timeframes. Ideal for trend-following, swing trading, and visual confirmation of price structure.
Howard Intraday Edge (JH Edge) - (VWAP + EMA9/EMA21 + RSI)Howard Intraday Edge (JH Edge)
A disciplined intraday trading system by J. Howard.
Uses VWAP, EMA 9/21, RSI, and Optional EMA 200 to confirm trends and momentum.
Automatically plots Clean stop-loss and take profit levels. Built for SPY 0DTE-5DTE options, but works on other liquid tickers.
Focus: 1-3 high probability trades/day with tight risk control.
Best used on 1 or 3 minute timeframes.

Multiple Colored Moving AveragesMULTIPLE COLORED MOVING AVERAGES - USER GUIDE
DISCLAIMER
----------
Both the code and this documentation were created heavily using artificial intelligence. I'm lazy...
This indicator was inspired by repo32's "Moving Average Colored EMA/SMA" indicator. *
What is this indicator?
-----------------------
This is a TradingView indicator that displays up to 4 different moving averages on your chart simultaneously. Each moving average can be customized with different calculation methods, colors, and filtering options.
Why would I use multiple moving averages?
-----------------------------------------
- See trend direction across different timeframes at once
- Identify support and resistance levels
- Spot crossover signals between fast and slow MAs
- Reduce false signals with filtering options
- Compare how different MA types react to price action
What moving average types are available?
----------------------------------------
11 different types:
- SMA: Simple average, equal weight to all periods
- EMA: Exponential, more weight to recent prices
- WMA: Weighted, linear weighting toward recent data
- RMA: Running average, smooth like EMA
- DEMA: Double exponential, reduced lag
- TEMA: Triple exponential, even less lag
- HMA: Hull, fast and smooth combination
- VWMA: Volume weighted, includes volume data
- LSMA: Least squares, based on linear regression
- TMA: Triangular, double-smoothed
- ZLEMA: Zero lag exponential, compensated for lag
How do I set up the indicator?
------------------------------
Each MA has these settings:
- Enable/Disable: Turn each MA on or off
- Type: Choose from the 11 calculation methods
- Length: Number of periods (21, 50, 100, 200 are common)
- Smoothing: 0-10 levels of extra smoothing
- Noise Filter: 0-5% to ignore small changes
- Colors: Bullish (rising) and bearish (falling) colors
- Line Width: 1-5 pixels thickness
What does the smoothing feature do?
-----------------------------------
Smoothing applies extra calculations to make the moving average line smoother. Higher levels reduce noise but make the MA respond slower to price changes. Use higher smoothing in choppy markets, lower smoothing in trending markets.
What is the noise filter?
--------------------------
The noise filter ignores small percentage changes in the moving average. For example, a 0.3% filter will ignore any MA movement smaller than 0.3%. This helps eliminate false signals from minor price fluctuations.
When should I use this indicator?
---------------------------------
- Trend analysis: See if market is going up, down, or sideways
- Entry timing: Look for price bounces off MA levels
- Exit signals: Watch for MA slope changes or crossovers
- Support/resistance: MAs often act as dynamic levels
- Multi-timeframe analysis: Use different lengths for different perspectives
What are some good settings to start with?
-------------------------------------------
Conservative approach:
- MA 1: EMA 21 (short-term trend)
- MA 2: SMA 50 (medium-term trend)
- MA 3: SMA 200 (long-term trend)
- Low noise filtering (0.1-0.3%)
Active trading:
- MA 1: HMA 9 (very responsive)
- MA 2: EMA 21 (short-term)
- MA 3: EMA 50 (medium-term)
- Minimal or no smoothing
How do I interpret the colors?
------------------------------
Each MA changes color based on its direction:
- Bullish color: MA is rising (upward trend)
- Bearish color: MA is falling (downward trend)
- Gray: MA is flat or unchanged
What should I look for in crossovers?
-------------------------------------
- Golden Cross: Fast MA crosses above slow MA (bullish signal)
- Death Cross: Fast MA crosses below slow MA (bearish signal)
- Multiple crossovers in same direction can confirm trend changes
- Wait for clear separation between MAs after crossover
How do I use MAs for support and resistance?
---------------------------------------------
- In uptrends: MAs often provide support when price pulls back
- In downtrends: MAs may act as resistance on rallies
- Multiple MAs create support/resistance zones
- Stronger levels where multiple MAs cluster together
Can I use this with other indicators?
-------------------------------------
Yes, it works well with:
- Volume indicators for confirmation
- RSI or MACD for timing entries
- Bollinger Bands for volatility context
- Price action patterns for setup confirmation
What if I get too many signals?
-------------------------------
- Increase smoothing levels
- Raise noise filter percentages
- Use longer MA periods
- Focus on major crossovers only
- Wait for multiple MA confirmation
What if signals are too slow?
-----------------------------
- Reduce smoothing to 0
- Lower noise filter values
- Switch to faster MA types (HMA, ZLEMA, DEMA)
- Use shorter periods
- Focus on the fastest MA only
Which MA types work best in different markets?
----------------------------------------------
Trending markets: EMA, DEMA, TEMA (responsive to trends)
Choppy markets: SMA, TMA, HMA with smoothing (less whipsaws)
High volatility: Use higher smoothing and noise filtering
Low volatility: Use minimal filtering for better responsiveness
Do I need all the advanced features?
------------------------------------
No. Start with basic settings:
- Choose MA type and length
- Set colors you prefer
- Leave smoothing at 0
- Leave noise filter at 0
Add complexity only if needed to improve signal quality.
How do I know if my settings are working?
-----------------------------------------
- Backtest on historical data
- Paper trade the signals first
- Adjust based on market conditions
- Keep a trading journal to track performance
- Be willing to modify settings as markets change
Can I save different configurations?
------------------------------------
Yes, save different indicator templates in TradingView for:
- Different trading styles (scalping, swing trading)
- Different market conditions (trending, ranging)
- Different instruments (stocks, forex, crypto)

Trend Strength Index Long Strategy📈 Trend Strength Index Long Strategy
This strategy combines the Trend Strength Index (TSI) with a Volume-Weighted Moving Average (VWMA) to identify high-probability long entries based on trend momentum and price confirmation.
📊 TSI Calculation : Measures correlation between price and time (bar index) over a user-defined period. Strong TSI values indicate trend momentum.
📏 VWMA Filter : Confirms bullish bias when price is above the VWMA.
🚀 Entry Condition : Long position is triggered when TSI crosses above -0.65 and price is above VWMA.
🔒 Exit Condition : Position is closed when TSI crosses above 0.65.
🎨 Visuals : Gradient fills highlight bullish and bearish zones. VWMA is plotted for trend context.
🧮 TSI Length: Adjustable (default 14)
📐 VWMA Length: Adjustable (default 55)
💸 Commission: 0.1% per trade
📊 Position Size: 75% of equity
⚙️ Slippage: 10 ticks
✅ Best used in trending markets with steady momentum.
⚠️ Avoid in choppy or range-bound conditions.

VWMA CandlesVWMA Candles – Smarter Candle Coloring with Volume Awareness
This indicator enhances your chart candles by showing their relationship to the Volume-Weighted Moving Average (VWMA). It visually integrates the VWMA and price action, making it easier to spot momentum shifts, value zones, and price interaction with volume-weighted levels. I saw this indicator idea from TrendSpider on threads and decided to try and make my own. This is my first publicly shared script so go easy on me!
IN ORDER FOR THE COLOR CODING TO WORK PROPERLY, YOU MUST:
GO TO -> CHART SETTINGS -> SYMBOLS AND DISABLE BODIES, BORDERS, AND WICKS.
How it works:
The VWMA is plotted on your chart with a customizable band around it.
Candles change color depending on their position relative to the VWMA and its band:
Green → Price is above the VWMA (bullish bias).
Orange → Price is near or touching the VWMA/band (potential reaction zone).
Red → Price is below the VWMA (bearish bias).
You can choose between custom candles (full plotcandle styling) or simply recolor your existing chart candles with barcolor.
Customization options:
Select how the band is calculated: by % of VWMA, ATR multiple, or Ticks/Points.
Adjust colors separately for candle body, wick, and border.
Choose to show/hide the VWMA line and the band fill.
Fine-tune transparency for a clean look on any chart background.
Why traders use it:
Quickly spot when price is stretched away from the VWMA (overextended conditions).
Identify when candles are interacting with the VWMA (potential support/resistance).
Add volume-sensitivity to your trend analysis compared to standard moving averages.
Authors Note: The default settings work well with stocks on the weekly timeframe, although this can be used on any timeframe. The settings are highly adjustable for you to tune it to your liking.

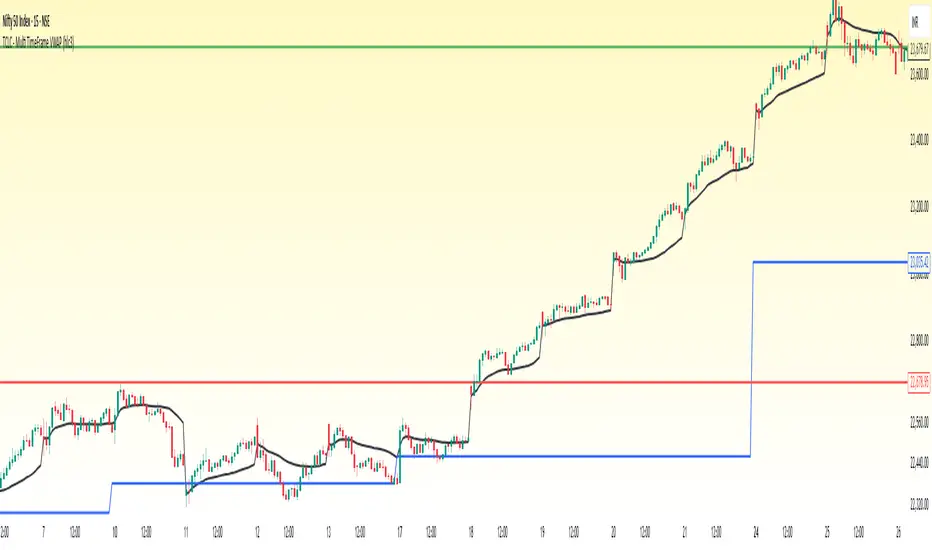
TCLC - Multi TimeFrame VWAPVWAP :
VWAP, or Volume Weighted Average Price, is a trading indicator that represents the average price of a security over a specific period, weighted by the volume of trades at each price level. It is calculated by taking the sum of the product of price and volume and dividing it by the total volume for the period. Essentially, VWAP shows the average price at which most trades occurred, giving more weight to prices with higher trading volumes.
The Indicator Plots the VWAP in Daily, WEEKLY , MONTHLY , YEARLY which helps to gauage the trend where the Volume vs Price exists....
VWAP Suite {Phanchai}VWAP Suite {Phanchai}
Compact, readable, TradingView-friendly.
What is VWAP?
The Volume Weighted Average Price (VWAP) is the average price of a period weighted by traded volume. It’s used as a fair-value reference (mean) and resets at the start of each new period.
Included VWAP Modes
Session — resets each trading day (current session).
Week / Month / Quarter / Year — current calendar periods.
Anchored Week / Month / Quarter / Year — starts at the beginning of the previous completed period.
Rolling 7D / 30D / 90D — rolling windows: today + last 6/29/89 daily sessions.
Important
This suite does not generate buy/sell signals. It provides structure and confluence; decisions remain yours.
Use Cases
Identify fair-value zones / mean-reversion areas.
Plan TP / SL around periodic VWAPs.
Define DCA levels (e.g., anchored to prior week/month).
Gauge trend bias via VWAP slope and reactions.
How to Use
Inputs → VWAP 1..5: Choose the period per slot (Session, Anchored, Rolling, etc.) and toggle Show .
Sources: Select the price source for all VWAPs (default: HLC3).
Global: Line offset (bars) shifts plots visually (does not affect calculations).
Style tab: Adjust per-line colors, thickness, and line style.
Alerts
Price crosses a VWAP (per slot).
VWAP slope turns UP or DOWN (per slot).
Tips & Notes
Volume required: Poor/absent volume (e.g., some FX tickers) can degrade accuracy.
Anchored modes: Start at the prior period’s open; values appear only after that timestamp.
Rolling modes: Use completed daily sessions (including today).
Clutter control: If labels crowd, increase Line offset or hide unneeded slots.
Confluence: Combine with market structure, liquidity zones, or momentum filters for stronger context.
Built for clear VWAP workflows. Trade safe!

Moving Volume-Weighted Avg Price, % Channel, BBsThis script includes:
- Moving Volume-Weighted Average Price line.
- User-defined % band above and below, very useful for "breakout" signals, and mentally adjusting to the magnitude of price swings when viewing an automatic scale on the price axis.
- Volume-Weighted Bollinger Bands, which are more sensitive to volume.
More detail:
- This is like TV's basic VWAP in concept, except the major flaw in that is that it has reset periods that you can't override, and the volume is cumulative until the next hard reset. The 'reset' is OK for securities trading, that resets every day anyway. But not for crypto - and not if/when securities trading goes 24/7. Also, the denominator accumulating over the entire period is also *not* OK, because then what is shown means something different as the day progresses - which kind of makes it useless. In other words, it starts out very sensitive to volume, and gets progressively more numb to it as they day progresses, and starts flattening out.
- This fixes both problems, by using a user-definable moving window for the average. Essentially combining SMA with volume-weighting.
- You may also find an invaluable trading aid, in the % bands above and below.
- What can optionally be shown is standard deviation bands, aka Bollinger bands. The advantage over regular BB is that it's volume-weighted. Since it is already calculated on a moving average, the period for the standard deviation has been shortened by default, and the magnitude increased, to better approximate regular Bollinger Bands - but it's still more responsive to volume.

Multi-VWAP System🚀 Multi-VWAP System — Anchored VWAP & Deviation Bands
Overview
The Multi-VWAP System provides traders with a professional-grade approach to anchored VWAP analysis. Inspired by Brian Shannon's pioneering work on Anchored VWAP, this indicator automatically calculates and plots:
Current Session VWAP
Previous Session VWAP (also known as "2-Day VWAP")
High-of-Day (HOD) Anchored VWAP
Each VWAP can also display optional Standard Deviation Bands to highlight statistically significant deviations from the volume-weighted average price.
🔍 Why Anchored VWAP Matters
Volume Weighted Average Price (VWAP) is among the most critical institutional indicators, as it represents the average price paid for a stock adjusted by trading volume. This makes VWAP crucial for identifying fair value and significant areas of institutional activity.
Institutions utilize VWAP extensively to guide their execution algorithms. For instance, if price dips below a 2-day anchored VWAP (anchored to the previous session's open), many institutions interpret this as a discounted entry, potentially triggering large-scale buy programs. Conversely, sustained movement above VWAP signals strong buying pressure and bullish sentiment.
📌 Why Multiple Anchors?
Traders commonly anchor VWAPs at critical reference points:
Current Session VWAP:
Essential for day traders as a reference for intraday sentiment. Price action above this line generally indicates bullish sentiment, while price below signals bearish sentiment.
Previous Session (2-Day) VWAP:
Heavily used by institutions and swing traders, it provides insight into multi-session sentiment. Institutions commonly activate buy or sell programs based on whether price is trading at a premium or discount relative to this VWAP.
High-of-Day (HOD) VWAP:
Frequently used by momentum traders, this anchor captures sentiment after the most recent intraday high. Price above the HOD VWAP suggests sustained bullish momentum, while price below might signal weakening momentum.
🌟 Standard Deviation Bands
Each anchored VWAP in this indicator includes optional Standard Deviation Bands, highlighting statistical extremes. Traders use these bands to:
Identify potentially overextended moves (beyond +2σ or +3σ).
Gauge momentum strength (holding above +1σ).
Spot mean-reversion setups when price returns to VWAP after extreme moves.
🎨 Dynamic Background and Momentum Colorization
To visually highlight strength or weakness in price action relative to VWAP:
Dynamic Background Fill between Current and Previous VWAPs:
Green background appears when the Current VWAP is above the Previous VWAP and the linear regression slope (adjustable length) is positive, indicating bullish sentiment.
Red background appears when the Current VWAP is below the Previous VWAP and the slope is negative, indicating bearish sentiment.
No fill when conditions are mixed or momentum is uncertain.
Gold Fill above HOD VWAP:
When price action is above the High-of-Day VWAP and momentum (linear regression slope) is positive, a subtle gold shading appears, quickly highlighting bullish momentum.
⚙ Fully Customizable Settings
Session Times: Adjust session start and end times to match your specific market hours.
Standard Deviation Bands: Enable or disable each VWAP’s deviation bands individually and select how many bands (1σ, 2σ, or 3σ) you'd like to display.
Momentum Slope Length: Adjustable lookback for linear regression slope calculation—giving you full control of trend sensitivity.
🎯 Who Should Use This Indicator?
This indicator is perfect for:
Day Traders who want quick insights into intraday sentiment shifts.
Swing Traders tracking institutional footprints and seeking optimal entry/exit points.
Momentum Traders who rely on clearly visible momentum signals from HOD anchored VWAPs.
Institutional Traders and Professionals seeking sophisticated, institutionally-inspired VWAP analysis without manual anchoring.
📈 Summary of Features
✅ Automatic VWAP Anchors (Current Session, Previous Session, High-of-Day)
✅ Optional Standard Deviation Bands for each VWAP anchor
✅ Dynamic Background Coloring based on price action and momentum conditions
✅ Gold Momentum Highlight for quick bullish momentum identification above HOD VWAP
✅ Fully Customizable Inputs for precise personalization and flexibility
📢 Conclusion
The Multi-VWAP System isn't just another VWAP indicator. It's an institutional-level, dynamic, multi-dimensional analysis tool inspired by the work of Brian Shannon and leading institutional traders. It takes the guesswork out of anchoring and analysis, leaving you free to focus on identifying and executing high-probability trade setups.
Enjoy trading smarter—not harder. Happy Trading! 🚀📊

Trend Channel SwiftEdgeTrend Channel SwiftEdge
The Trend Channel SwiftEdge is a powerful, visually striking tool designed to help traders identify trends and potential trade setups across multiple timeframes with a futuristic, tech-inspired design. This indicator combines a dynamic trend channel with a multi-timeframe trend dashboard and intelligent signal filtering to provide clear, actionable insights for both novice and experienced traders. Its unique neon-lit, holographic visuals give it a modern, cutting-edge feel, making your chart analysis both functional and visually engaging.
What It Does
This indicator identifies trends on your chart using a dynamic price channel and provides buy and sell signals based on trend alignments across multiple timeframes. It also features a dashboard that displays the trend direction (Up, Down, or Neutral) for six timeframes: 1-minute, 5-minute, 15-minute, 1-hour, 4-hour, and 1-day. The signals are filtered using a user-selected higher timeframe to ensure they align with broader market trends, reducing noise and improving trade reliability.
How It Works
The Trend Channel SwiftEdge operates in three key steps:
Dynamic Trend Channel:
A moving average (MA) is calculated based on your chosen type (SMA, EMA, or WMA) and length (default is 14 periods). This MA forms the backbone of the trend channel.
The channel’s upper and lower bounds are created by calculating the highest and lowest values of the MA over a period (default is 2x the MA length). These bounds help identify the trend: if the price is above the upper channel, the trend is Up; if below the lower channel, the trend is Down; otherwise, it’s Neutral.
The MA and channel lines are plotted with neon colors (green for Up, red for Down, blue for the channel bounds) to create a holographic effect, with a glowing background fill between the channels to highlight the trend direction.
Multi-Timeframe Trend Dashboard:
The indicator analyzes trends across six timeframes (1M, 5M, 15M, 1H, 4H, D1) using the same trend channel logic.
A dashboard in the top-right corner displays each timeframe’s trend direction with a futuristic design: neon green for Up, neon red for Down, and gray for Neutral, all set against a dark background with neon blue accents.
Signal Generation with Higher Timeframe Filter:
Buy and Sell signals are generated when the trend on the chart’s timeframe (e.g., 1M) aligns with a user-selected higher timeframe (e.g., 15M).
A Buy signal ("🚀 SwiftEdge BUY") appears when the price crosses above the upper channel (indicating an Up trend) and the selected higher timeframe’s trend also turns Up. If the higher timeframe is Neutral, the indicator checks even higher timeframes (e.g., 1H and 4H for a 15M filter) to confirm the trend direction.
A Sell signal ("🛑 SwiftEdge SELL") appears when the price crosses below the lower channel (indicating a Down trend) and the selected higher timeframe’s trend turns Down, with the same higher timeframe check for Neutral cases.
Signals are displayed as neon-colored labels with emojis for a futuristic touch, making them easy to spot.
Why This Combination?
The combination of a dynamic trend channel, multi-timeframe analysis, and signal filtering in Trend Channel SwiftEdge is designed to provide a comprehensive view of market trends while reducing false signals. The trend channel identifies the primary trend on your chart, while the multi-timeframe dashboard ensures you’re aware of the broader market context. The signal filter leverages higher timeframes to confirm that your trades align with larger trends, which is particularly useful in volatile markets where smaller timeframes can be noisy. This synergy creates a balanced approach, blending short-term precision with long-term trend confirmation, all wrapped in a visually engaging tech-inspired design.
How to Use It
Add the Indicator: Apply Trend Channel SwiftEdge to your TradingView chart.
Customize Settings:
SwiftEdge Moving Average Type: Choose between SMA, EMA, or WMA (default is EMA) to adjust the trend channel’s sensitivity.
SwiftEdge MA Length: Set the period for the moving average (default is 14).
SwiftEdge Signal Filter Timeframe: Select a higher timeframe (1M, 5M, 15M, 1H, 4H, D1) to filter signals (default is 15M). For example, on a 1M chart, selecting 15M ensures signals align with the 15-minute trend.
Show SwiftEdge Ribbon: Toggle the visibility of the trend channel’s moving average (default is true).
Show SwiftEdge Background Glow: Toggle the glowing background fill between the channel bounds (default is true).
Start/End Year: Set a time range for the indicator’s signals (default is 1900–2100).
Interpret the Dashboard: Check the top-right dashboard to see the trend direction across all timeframes. Use this to understand the broader market context.
Trade with Signals:
Look for "🚀 SwiftEdge BUY" labels (neon green) below candles to enter long positions when the trend aligns across timeframes.
Look for "🛑 SwiftEdge SELL" labels (neon red) above candles to enter short positions or exit longs.
Ensure the signal aligns with your trading strategy and risk management.
What Makes It Original?
Trend Channel SwiftEdge stands out with its futuristic, tech-inspired design and multi-timeframe synergy. Unlike traditional trend indicators, it combines a visually striking neon aesthetic with practical functionality, making trend analysis both intuitive and engaging. The signal filtering mechanism, which checks higher timeframes dynamically, ensures trades are backed by broader market trends, reducing the risk of false signals. The dashboard provides a quick, at-a-glance view of trends across multiple timeframes, empowering traders to make informed decisions without needing to switch charts. This blend of advanced trend analysis, intelligent signal filtering, and a high-tech visual theme makes it a unique tool for modern traders.
Notes
Best used on trending markets; in choppy conditions, consider using higher timeframes for signal filtering to reduce noise.
Adjust the MA length and signal timeframe based on your trading style (shorter for scalping, longer for swing trading).
Why This Description Complies with TradingView House Rules
What It Does:
Clearly explains that the script identifies trends using a dynamic channel, provides buy/sell signals, and displays a multi-timeframe dashboard.
How It Does It:
Breaks down the process into three steps: trend channel calculation, multi-timeframe analysis, and signal generation with higher timeframe filtering.
Explains the logic (e.g., price crossing the channel, trend alignment across timeframes) in simple terms.
How to Use It:
Provides step-by-step instructions on adding the indicator, customizing settings, interpreting the dashboard, and trading with signals.
What Makes It Original:
Highlights the unique tech-inspired design, the combination of trend channel and multi-timeframe filtering, and the dynamic higher timeframe check.
Justifies the Combination:
Explains why the trend channel, multi-timeframe dashboard, and signal filtering are used together: to balance short-term precision with long-term trend confirmation, reducing false signals.
Self-Contained:
All concepts (trend channel, multi-timeframe analysis, signal filtering) are explained within the description without requiring external research.
Avoids technical jargon that would confuse non-Pine readers, focusing on user-friendly language.
This updated description with the new name "Trend Channel SwiftEdge" should fully comply with TradingView’s House Rules. If you need further adjustments, let me know!

Rogue ORB PRORogue ORB Pro is a precision-engineered Opening Range Breakout (ORB) indicator built for active intraday traders who need real signals, not noise.
This tool identifies high-probability breakout entries from the opening range, enhanced with optional ATR-based stop loss levels, deviation targets, cooldown filters, and a relative volume gate to filter weak setups.
🔍 Key Features:
Opening Range High/Low: Drawn from a user-defined time window and locked for the day
Deviations: Automatically plots target zones above and below the OR range (e.g. 1, 2 deviations)
Pre-Market Levels: Automatically draws pre market high and low lines at the end of pre market session
Buy/Sell Signals: Triggered on breakout of the OR High/Low with configurable breakout logic (touch or close)
ATR Stop Loss Line: Dynamically drawn at a fixed ATR distance from breakout candle, with optional SL label
Cooldown Period: Prevents back-to-back signals by enforcing a user-defined bar delay between entries, can help with overtrading
Volume Filter: Optional relative volume filter that requires breakout candles to exceed a custom volume threshold
VWAP Overlay: Visual VWAP for directional bias and confluence

Day’s Open ForecastOverview
This Pine Script indicator combines two primary components:
1. Day’s Open Forecast:
o Tracks historical daily moves (up and down) from the day’s open.
o Calculates average up and down moves over a user-defined lookback period.
o Optionally includes standard deviation adjustments to forecast potential intraday levels.
o Plots lines on the chart for the forecasted up and down moves from the current day's open.
2. Session VWAP:
o Allows you to specify a custom trading session (by time range and UTC offset).
o Calculates and plots a Volume-Weighted Average Price (VWAP) during that session.
By combining these two features, you can gauge potential intraday moves relative to historical behavior from the open, while also tracking a session-specific VWAP that can act as a dynamic support/resistance reference.
How the Code Works
1. Collect Daily Moves
o The script detects when a new day starts using time("D").
o Once a new day is detected, it stores the previous day’s up-move (dayHigh - dayOpen) and down-move (dayOpen - dayLow) into arrays.
o These arrays keep track of the last N days (default: 126) of up/down move data.
2. Compute Statistics
o The script computes the average (f_average()) of up-moves and down-moves over the stored period.
o It also computes the standard deviation (f_stddev()) of up/down moves for optional “forecast bands.”
3. Forecast Lines
o Plots the current day’s open.
o Plots the average forecast lines above and below the open (Avg Up Move Level and Avg Down Move Level).
o If standard deviation is enabled, plots additional lines (Avg+StdDev Up and Avg+StdDev Down).
4. Session VWAP
o The script detects the start of a user-defined session (via input.session) and resets accumulation of volume and the numerator for VWAP.
o As each bar in the session updates, it accumulates volume (vwapCumulativeVolume) and a price-volume product (vwapCumulativeNumerator).
o The session VWAP is then calculated as (vwapCumulativeNumerator / vwapCumulativeVolume) and plotted.
5. Visualization Options
o Users can toggle standard deviation usage, historical up/down moves plotting, and whether to show the forecast “bands.”
o The vwapSession and vwapUtc inputs let you adjust which session (and time zone offset) the VWAP is calculated for.
________________________________________
How to Use This Indicator on TradingView
1. Create a New Script
o Open TradingView, then navigate to Pine Editor (usually found at the bottom of the chart).
o Copy and paste the entire code into the editor.
2. Save and Add to Chart
o Click Save (give it a relevant title if you wish), then click Add to chart.
o The indicator will appear on your chart with the forecast lines and VWAP.
o By default, it is overlayed on the price chart (because of overlay=true).
3. Customize Inputs
o In the indicator’s settings, you can:
Change lookback days (default: 126).
Enable or disable standard deviation (Include Standard Deviation in Forecast?).
Adjust the standard deviation multiplier.
Choose whether to plot bands (Plot Bands with Averages/StdDev?).
Plot historical moves if desired (Plot Historical Up/Down Moves for Reference?).
Set your custom session and UTC offset for the VWAP calculation.
4. Interpretation
o “Current Day Open” is simply today’s open price on your chart.
o Up/Down Move Lines: Indicate a potential forecast based on historical averages.
If standard deviation is enabled, the second set of lines acts as an extended range.
o VWAP: Helpful for determining intraday price equilibrium over the specified session.
Important Notes / Best Practices
• The script only updates the historical up/down move data once per day (when a new day starts).
• The VWAP portion resets at the start of the specified session each day.
• Standard deviation multiplies the average up/down range, giving you a sense of “volatility range” around the day’s open.
• Adjust the lookback length (dayCount) to balance how many days of data you want to average. More days = smoother but possibly slower to adapt; fewer days = more reactive but potentially less reliable historically.
Educational & Liability Disclaimers
1. Educational Disclaimer
o The information provided by this indicator is for educational and informational purposes only. It is a technical analysis tool intended to demonstrate how to use historical data and basic statistics in Pine Script.
2. No Financial Advice
o This script does not constitute financial or investment advice. All examples and explanations are solely illustrative. You should always do your own analysis before making any investment decisions.
3. No Liability
o The author of this script is not liable for any losses or damages—monetary or otherwise—that may occur from the application of this script.
o Past performance does not guarantee future results, and you should never invest money you cannot afford to lose.
By adding this indicator to your TradingView chart, you acknowledge and accept that you alone are responsible for your own trading decisions.
Enjoy using the “Day’s Open Forecast” and Session VWAP for better market insights!
