Force Index with Advanced Features [Quant_]This is the traditional Force Index indicator developed by Alexander Elder and described in his book "Trading For a Living" . As you probably know, the Force Index measures the amount of power used to move the price of an asset. The formula is pretty simple - the difference between the current and the previous close is multiplied by the volume of the current close. However, I wanted to add some additional features to the indicator, so that you have more control over it. Improvements include:
- Choose the length of the Force Index
- Choose the time frame of the FI (you can choose a smaller time frame and get a more detailed overview);
- Smoothing of the results through a Moving Average (Simple, Exponential, Weighted, Running or Hull);
- Choose the time frame of the smoothing MA for even greater control;
- Color changing depending on the increasing or decreasing smoothed Force Index;
I used to use Force Index for spotting divergences and exhaustions and it worked pretty well, but it does require some time until you get used to it. Bear in mind that you shouldn't jump against the trend on every divergence that occurs, but use it as a complementary indicator to your trading system. I am planning to add some additional features to this indicator to make it more robust, so stay tuned.
I hope you find this indicator useful. As usual, if you have any questions or suggestions on how to improve my indicators, please let me know. Thanks.
Volumespreadanalysis

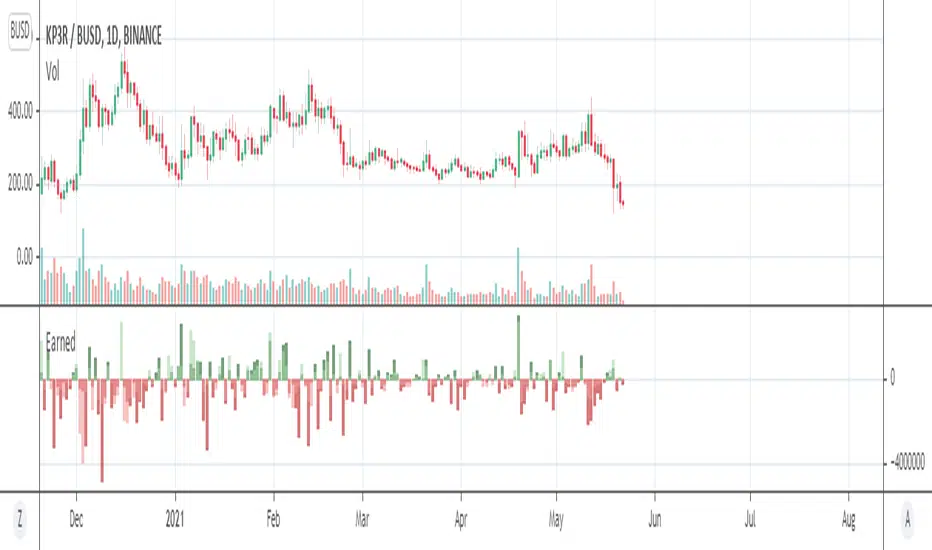
EarnedHello friends. I am glad to present for your attention one of my products based on the X-Volume indicator code. The "Earned" indicator shows how much money is earned on the market relative to actual timeframe. Accuracy is relative but nevertheless it is close to actual calculated figures.
How this information can help you? Moust easy interpritation -
1) Trend up - earnings up - bulls in the market.
2) Downward trend and earnings up - bears in the market.
3) Trend up - earnings down - fake growth.
4) Downward trend - earnings down - fake bears.
Heatmap Volume [xdecow]This indicator colors the volume bars and candles according to the volume traded. The calculation of the heat map zones is done as follows:
how many standard deviations the volume are distant from the average volume?
For a better visual experience, place the borders and wicks of the candles in a neutral color.

GreyPool VSA Signal ScannerThis Indicator combines powerful Climactic Action Volume Spread Analysis (VSA) signals and displays them on multiple time frames and 8 symbols simultaneously.
Climactic Action is defined as - Excessively large volume or an excessively large price change within a relatively short amount of time where "hidden" buying or selling is indicated.
Glossary:
Climactic Down Bar - A bar closing lower than the previous bar with above average volume and a large spread wherein the close of the bar is significantly higher than the low of the bar (Indicates "hidden" buying).
Climactic Up Bar - A bar closing higher than the previous bar with above average volume and a large spread wherein the close of the bar is significantly lower than the high of the bar (Indicates "hidden" selling).
Trap Down Bar - Also known as a "Shakeout" and occurs when price makes a new low and quickly retraces to close near the high of the bar with excessively large volume and a large spread (Indicates "hidden" buying).
Trap Up Bar - Also known as a "Shakeout" and occurs when price makes a new high and quickly retraces to close near the low of the bar with excessively large volume and a large spread (Indicates "hidden" selling).
Green Buy Signals:
- Created when Climactic Down or Trap Down bars are formed within a range of 3 bars wherein the volume is at the high or very high level and volume is consecutively increasing
Red Sell Signals:
- Created when Climactic Up or Trap Up bars are formed within a range of 3 bars wherein the volume is at the high or very high level and volume is consecutively increasing
How to Use:
1. Choose your favorite 8 trading pairs and signals will be generated for each and on the time frame that you set.
2. Setting the time frame of the indicator higher than your current chart time frame is a way to receive reliably powerful signals from this indicator the 1 hour and 2 hour time frames are particularly helpful.
3. It is also possible to add the indicator to your chart more than once and set a different time frame for each instance.
These signals do not occur often but when they do the market responds in the indicated direction with a high degree of probability.
ALERT FUNCTION INCLUDED
-You can set an alert to trigger when a signal occurs (buy or sell)

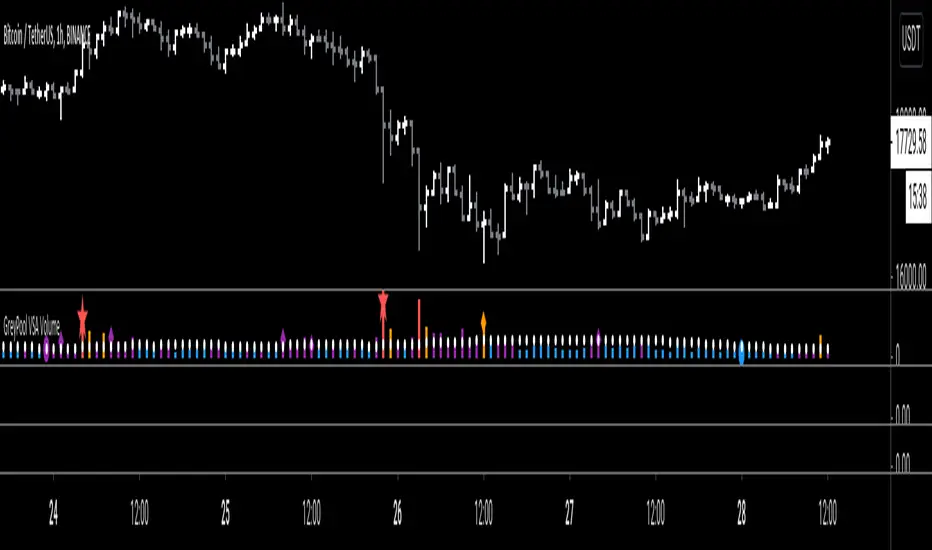
GreyPool VSA VolumeGreyPool VSA Volume Indicator
Color Key:
Blue = Below Average or Low Volume
Purple = Average Volume
Orange = High Volume
Red = Very High Volume
Symbol Key:
Circle = Test on Low Volume
Diamond = TrapUp or TrapDown Bar on High or Very High Volume
Star = Climactic Action Bar
Background Highlight Key:
Green Background = Last 3 bar were increasing high or very high volume including a climactic action DOWN bar or trap DOWN bar
Red Background = Last 3 bars were increasing high or very high volume including a climactic action UP bar or trap UP bar
Available Alerts:
When a Green or Red background appears
When a Climactic Action Up or Down bar appears
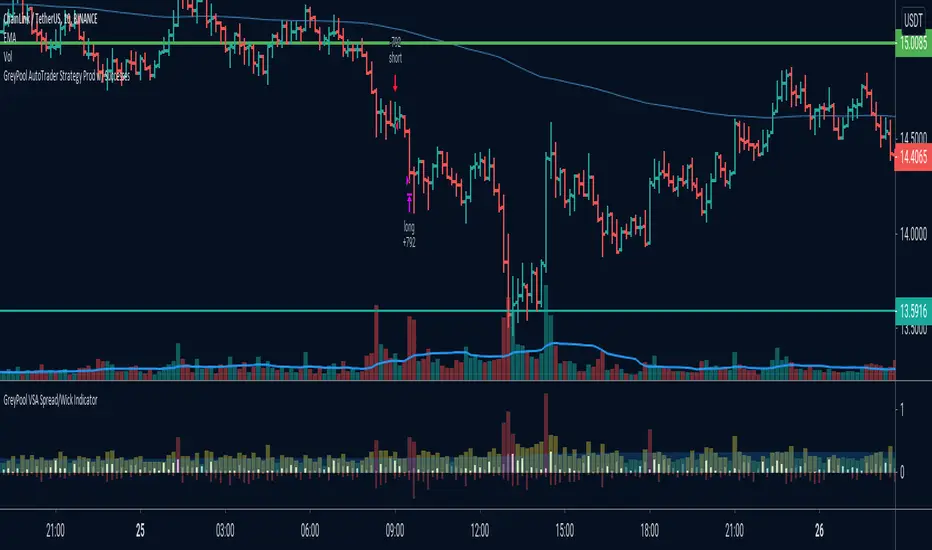
GreyPool VSA Spread/Wick Divergence IndicatorThe purpose of this indicator is to determine the distance between the spread of a bar/candle and the wick at a glance (Spread is defined as the range between the open and close and the wick is any part of the bar/candle that is beyond that range).
Climactic action bars typically have large spreads and a pronounced wick which indicates hidden buying or selling.
Definitions of Colors:
Light Blue Area - Average spread size of the last x bars where x is the set MA period
Red Column - Indicates a very high spread that is far beyond the average
Yellow Column - Indicates spreads that are at the average line or just above it
Green Column - Indicates a very low spread
Thin Red Histogram - Indicates the size of the bottom wick (Either the distance between the close and low of down bars or the open and low or up bars)
Thin Blue Histogram - Indicates the size of the top wick (Either the distance between the open and high for down bars or the close and high for up bars)
*** Please Click The LIKE Button to Support Us, Thank You ***
paratradevsa2Volume spread analysis is basically a tool to discover the correlation of price in relation to volume , in order to determine the short-term outcome of price action, in other words, where the market might be moving next.
I have developed this indicator called VSA. It tracks smart money activity and suggests the potential direction of the market.
This indicator gives signals which can be used in following ways-
-> SOW-
1. Buying Climax - For Sell.
2. Upthrust - For Sell.
-> SOS-
1. Selling Climax - For Buy.
2. Stopping Volume - For Buy.
I hope it helps people who use it and give them profitable results.
The script will be updated regularly if there are any issues.
THANK YOU.
No Repaint No Repaint on the closed candles
Access is through invite only
Do you want to use this Indicator .
To Get access - Send me a private chat message in tradingview.com to get access or request in comment section below.
If you like the script and if this useful like comment share.
Best regards and happy trading.

Volume Spread Analysis Indicators [Volume Trader]This indicator is based on Volume and Price spread analysis developed by tom williams.
It shows following indicators based on price range and volume data
Bearish Indicators
1. Buying climax
2. End of Rising Market
3. Upthrust
4. Smart selling
5. No Demand
6. VDD
Bullish Indicators
1. Selling Climax
2. End of falling
3. Stop Volume
4. Reverse Upthrust
5. Shakeout
6. VDU
6. No supply

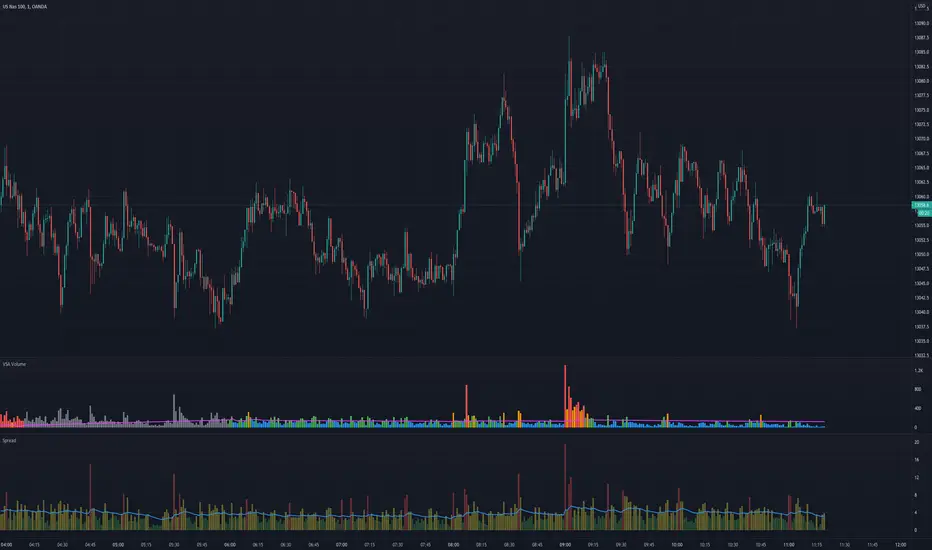
VSA VolumeVolume indicator judging level of volume per bar accordingly to Volume Spread Analysis rules. It allows either to set static volume levels or dynamic ones based on ratio comparable to Moving Average. Bars are coloured based on ratio or static levels, visually presenting level of Volume (low, average, high, ultra high).

VSA SpreadMeasures spread of the candle, useful especially for Volume Spread Analysis (VSA) and to measure trend strength. Spread is coloured based on level comparable to Moving Average.
VSA Trading Assistant DashboardThe VSA Trade Assistant is a fully featured data dashboard and information management tool that visually tracks, analyzes and displays key performance indicators in any BTC related market on Trading View
This indicator recognizes climatic up and down bars including when their vol is very high (at least 100 percent of the bar is above the average vol line) and when the subsequent bar is in the opposite direction of the climactic move.
The composite volume of 7 different exchanges is used by this indicator to determine when climactic volume has occurred.
Leave feedback, we'll be adding features to this indicator over time

Volume Price Analysis 2Best indicator for volume price analysis:
-Trend detection
-Breakout detection
-Fakeout detection
Use pure candlestick chart and volume .
No need to use any other indicator.
You can feel about the battle between bulls and bears.
Read my book for more information!
Volume Price Analysis Best indicator for volume price analysis:
-Trend detection
-Breakout detection
-Fakeout detection
Use pure candlestick chart and volume.
No need to use any other indicator.
You can feel about the battle between bulls and bears.
Read my book for more information!
Volume Spread IndicatorVolume Spread Indicator is based on my understanding of Volume Spread Analysis (VSA). VSA is the third approach for analyzing the price of a stock, forex or cryptocurrency. VSA looks for the difference between supply and demand that are created by a professional trader, institutional players which are called Smart Money.
This Indicator shows SV(Stopping Volume), NS (No Supply), ND (No Demand), -RC( Reverse Candle). Stopping volume and No supply appearing at key support level indicates Bullish Reversal. -RC and ND appearing at key resistance level indicate Bearish Reversal. This indicator can be used as Bottom and Top.
This Indicator can be used effectively with the combination of AutoFibe indicator, Scalping sell and buy Indicator.
Stopping Volume is shown as SV
No Demand is shown as a triangle down (Red)
No Supply is shown as a triangle up (Green)
Reverse Candle is shown as -RC

Relative Volume - VPA / VSA / Better VolumeVolume is important.
Volume is VERY important.
But all the existing methods of volume analysis and order flow analysis fall into the same trap: they're all extremely complicated, hard to learn, and difficult for the human brain to distill down to an actual, tradable signal.
The Relative Volume Gradient Paintbars indicator seeks to address this issue by reducing and simplifying concepts from Volume Price Analaysis (VPA), Volume Spread Analysis (VSA), and Market Profile / Volume Profile into a single indication with varying levels of intensity. Rather than adding more complex symbology and cluttering up your charts with arrows and signals and lines as many volume indicators do, relative volume intuitively takes advantage of the dimension of color, and plays to your brain's automatic recognition of color intensity to highlight areas of interest on a chart where large volumes are being traded. These areas can in turn point out levels of support and resistance, or show strength in a move, exposing the actions of larger market participants that are behind a move.
The Relative Volume indicator can calculate based on a time-segmented / time-based / bar-specific average of volume, adjusting for some of the typical spikes in volume that happen at the beginning and end of a trading day; Or it can be calculated based on any length and type of moving average of volume that is desired: simple, exponential, weighted, Wilders, price-weighted, Hull, or TEMA.
This indicator does more than just normal relative share volume. It can also do relative volume-per-range. The idea behind this setting is that when more volume is being traded but very little movement is happening, this can indicate substantial support or resistance, where a lot of trades are likely being absorbed by larger operators. You can choose your own range calculation for this setting, whether you prefer True Range, high-low range, candle body range, close to close range, or any of several other custom settings.
Moreover, the levels or thresholds at which the color intensity changes are completely user-controlled, so you can adjust them upward to tune out more noise, or downward to increase the level of sensitivity. In addition, all of the colors for each of the thresholds are completely user-controlled.
We hope to see TradingView add support for Richard Arms' CandleVolume or Equivolume before too long, as well as Tick Volume or Trade Count Volume data, all of which can add a lot of power to this method of trading.
SignalToSignal.com - Logical Volume Trading SystemOur Logical Volume Trading System is a vast improvement on ‘standard’ volume spread analysis. Based on 15+ year combined experience with our Smart Volume Spread Analysis software, we have refined our analysis and algorithms to provide the most powerful VSA indicator on TradingView.
Combining fundamental analysis, technical analysis, and volume analysis into a powerful methodology that enables you to trade the markets in a way that is uniquely accurate.
The Signal to Signal Logical Volume Trading System quickly handles time-consuming manual background analysis, volume analysis, and signal analysis leaving you free to make considered and knowledgeable trading decisions instantly.
We have refined our price action and volume analysis algorithms to focus on the core trading signals, which often precede large moves, providing you with clear insight and a roadmap to trading successfully.
Due to unique characteristics of the Pine programming language that TradingView indicators utilize, we have also made adjustments to the signal validation and advisor systems. The result is a clean, easy to read chart which allows you to recognize strong setups as soon as they form.
Lastly, our Logical Volume Trading System is customizable. You can choose which signals and advisor warnings are enabled, allowing you test any number of ideas and analysis combinations. Of course the system is optimized for most charts by default so you can get started right away.
To gain access to the Logical Volume Trading System, please visit our website .
If you have any questions, please contact us through the Contact link on our website - signaltosignal.com
