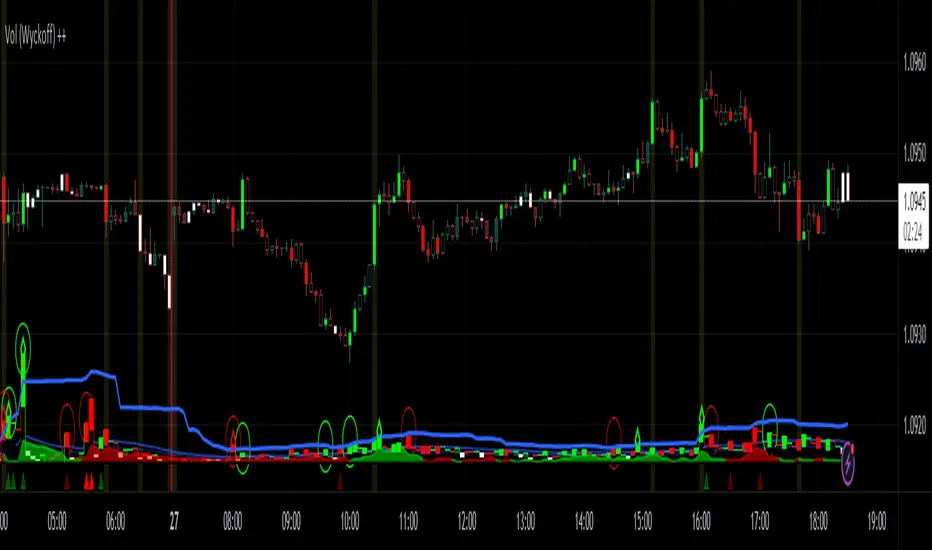
Vol (Wyckoff)I like TradingView Built-in Volume indicator, because it is overlay with price chart, and has appropriate scale.
I made similar style volume indicator and added concept of Laws of Wyckoff.
caution : You need {Chart settings} → {Appearance} → {Bottom margin} is set 0 %, to make chart look good.
: You need {Chart settings} → {Symbol} → {body} ,{Borders} and {Wick} are set dark color, to easier to identify the color of candles.
This 3 Laws of Wyckoff are my interpretation, not the original.
///////// The Law of Supply and Demand //////////
I define the Demand as volume that is larger than the previous volume and has close > open bar.
I define the Supply as volume that is larger than the previous volume and has close <= open bar.
Volume Flow is value difference between Demand MA and Supply MA.
I imitate the idea of "Volume Flow v3" by oh92.
///////// The Law of Cause and Effect //////////
Enough volume(Cause) makes reliable price movement(Effect).
If there is not enough volume, its price movement is suspicious.
I define enough volume as volume that is larger than previous volume.
I define large volume as volume that is larger than previous volume and over volume MA(using all volume).
I define "not enough volume" as volume that is smaller than previous volume.
I borrowed the idea from "The Lie Detector" by LucF.
Enough volume(increasing volume) is painted by dark color and Large volume(increasing volume and over volume MA) is painted by light color.
"Not enough volume"(decreasing volume) is painted by empty color(default is black).
This coloring are reflected to price candles.
So, you need {Chart settings} → {Symbol} → {body} ,{Borders} and {Wick} are set dark color, to easier to identify the color of candles.
///////// The Law of Effort and Result //////////
If volume (effort) cannot move price (result), it may be Absorption(potential reversal).
"Factor of Volume Density" determines the threshold of Absorption.
Small Absorption is displayed by gray square at bottom.
Large Absorption is displayed by white square at bottom.
///////// Volume Spike //////////
Volume Spike sometimes precede or confirm trend direction.
"Factor of Volume Spike" determines the threshold of Volume Spike.
Volume Spike is displayed by light bulb.
Volumespreadanalysis
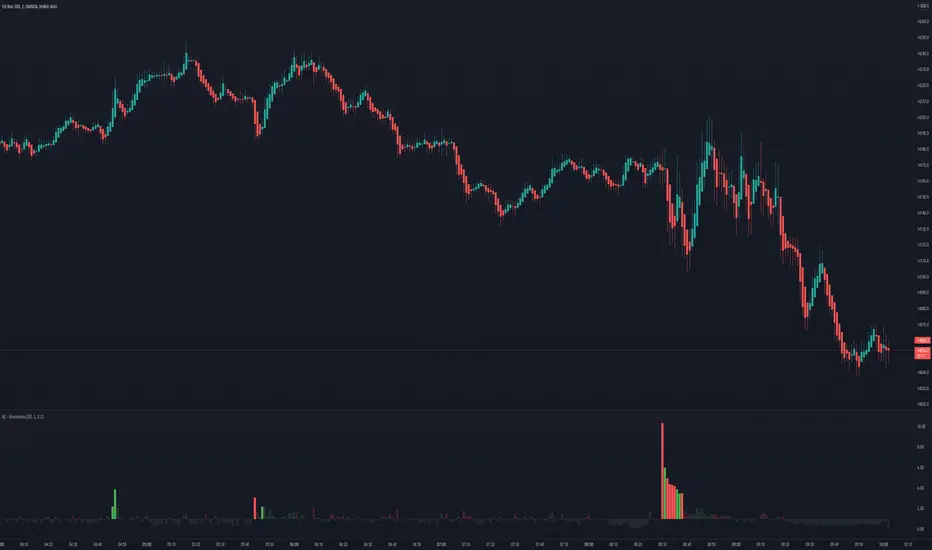
Delta Volume by SiddWolfDelta Volume is Difference between Buying Volume and Selling Volume. This indicator gives the Delta Volume based on Lower TimeFrame Candles. It utilizes security_lower_tf() function, a function that provides Lower TF candle data in Higher TF Chart.
security_lower_tf() is a new function provided by TradingView yesterday. If you are a PineScript Programmer, I suggest you to read about it, as it is a very powerful function that can extremely improve your trading strategy.
How this indicator works:
This indicator checks volume data on lower TimeFrame Candles and Shows it's delta in the current Chart Timeframe. For example: If you open 4 hours chart, this indicator checks volume of 1 minute chart and separates Buying-Selling volume. Then it subtracts Candle's Selling volume from Candle's Buying volume, finally calculating the Delta Volume.
This indicator also provides a Smooth Delta Volume, which is moving average of Delta Volume. As Delta Volume changes a lot, Smooth Delta Volume can be very helpful for identifying Trends . Goto settings and in "Show" section select "Smooth Delta Volume" to lay it on the chart.
Settings is the Key:
Settings are key to all of my indicators. Play around with it a bit. You can change what to show on the chart from settings. Smooth Delta Volume moving average length can be changed from the settings. You can also select "Show as Percentage", which shows Delta Volume as Percentage of Overall Candle's Volume. If you use Weekly or Monthly Timeframe, change increase lower timeframe from settings. Read the tooltips to understand what each settings mean. Tooltips are the (i) button in-front of each settings.
FAQs:
Q. Does the indicator Repaint ?
--- No. None of my indicators repaints. What you see now is what's drawn in real time.
Q. What TimeFrame is Best for this Indicator ?
--- It can be used on timeframes from 5 minutes to higher. But I would prefer to use it from timeframes higher than 30 minutes, as it gathers data from 1 minute TF.
Q. Indicator doesn't show anything ?
--- This indicator only works on security with Volume data. Also use it from higher timeframe than specified in Settings, because Volume Delta is calculated using Data from Lower TimeFrame.
Q. Delta volume is not provided by TradingView, So how exactly does this indicator work?
--- This indicator takes advantage of new pinescript function security_lower_tf(), and calculates volume for smaller timeframe data and calculates delta on higher timeframe.
Q. Does this indicator give financial advice?
--- No. Nope. Nein. Não. नहीं.
Conclusion:
This indicator is very basic but if used correctly it can be very powerful. If you have any questions or suggestions feel free to comment below. I'd love to connect with you. Thank you.
~ @SiddWolf

Waddah Attar Explosion V3 [NHK] -Bollinger - MACDWaddah Attar Explosion Version3 indicator to work in Forex and Crypto, This indicator oscillates above and below zero and the Bollinger band is plotted over the MACD Histogram to take quick decisions, Colors are changed for enhanced look. dead zone is plotted in a background area and option is provided to hide dead zone. One can easily detect sideways market movement using Bollinger band and volume. when volume is in between Bollinger band no trades are to be taken as volume is low and market moving in sideways
credits to: @shayankm and @LazyBear
Read the main description below...
- - - - - - - - - - - - - - - - - - - - - - - - - - - - - - - - - - - - - - -
This is a port of a famous MT4 indicator. This indicator uses MACD /BB to track trend direction and strength. Author suggests using this indicator on 30mins.
Explanation from the indicator developer:
"Various components of the indicator are:
Dead Zone Line: Works as a filter for weak signals. Do not trade when the up or down histogram is in between Dead Zone.
Histograms:
- Pink histogram shows the current down trend.
- Blue histogram shows the current up trend.
- Sienna line / Bollinger Band shows the explosion in price up or down.
Signal for ENTER_BUY: All the following conditions must be met.
- Blue histogram is raising.
- Blue histogram above Explosion line.
- Explosion line raising.
- Both Blue histogram and Explosion line above DeadZone line.
Signal for EXIT_BUY: Exit when Blue histogram crosses below Explosion line / Bollinger Band.
Signal for ENTER_SELL: All the following conditions must be met.
- Pink histogram is raising.
- Pink histogram above Explosion line.
- Explosion line raising.
- Both Pink histogram and Explosion line above DeadZone line.
Signal for EXIT_SELL: Exit when Pink histogram crosses below Explosion line.
All of the parameters are configurable via options page. You may have to tune it for your instrument.

Bogdan Ciocoiu - MakaveliDescription
This indicator integrates the functionality of multiple volume price analysis algorithms whilst aligning their scales to fit in a single chart.
Having such indicators loaded enables traders to take advantage of potential divergences between the price action and volume related volatility.
Users will have to enable or disable alternative algorithms depending on their choice.
Uniqueness
This indicator is unique because it combines multiple algorithm-specific two-volume analyses with price volatility.
This indicator is also unique because it amends different algorithms to show output on a similar scale enabling traders to observe various volume-analysis tools simultaneously whilst allocating different colour codes.
Open source re-use
This indicator utilises the following open-source scripts:

Bogdan Ciocoiu - GreuceanuDescription
This indicator is an entry-level script that simplifies volume interpretation for beginning traders.
It is a handy tool that removes all the noise and focuses traders on identifying potential smart money injections.
Uniqueness
This indicator is unique because it introduces the principle of a moving average in the context of volume and then compares it with tick-based volume.
Its uniqueness is reflected in the ability to colour code each volume bar based on the intensity of each relevant (volume) unit whilst comparing it with the volume moving average.
Another benefit of this indicator is the colour coding scheme that removes volume below a particular threshold (default set to 1) under the volume moving average.
In addition to the above features, the indicator differentiates the colour of each bar by price direction.
Open source re-use
To achieve this functionality several open source indicators have been used an integrated within the current one.
Volume Strength FinderGenerally, Volume indicator shows total Volume of a candle. In this Volume Strength Finder Indicator, I tried to separate Strength of buyers and sellers based on the candle stick pattern. Calculating Buyer and Seller Strength each and every candle of the day based on the pattern formation.
High - close => Buyers
Close - low => Sellers
in this way, cumulative volume separates for buyer and sellers and comparing with total volume of the day and showing results.
if buyer strength more than seller, candle bar color remains green even a candle is negative candle(Open>close) and wise versa.
Note: This is for Education Purpose only.

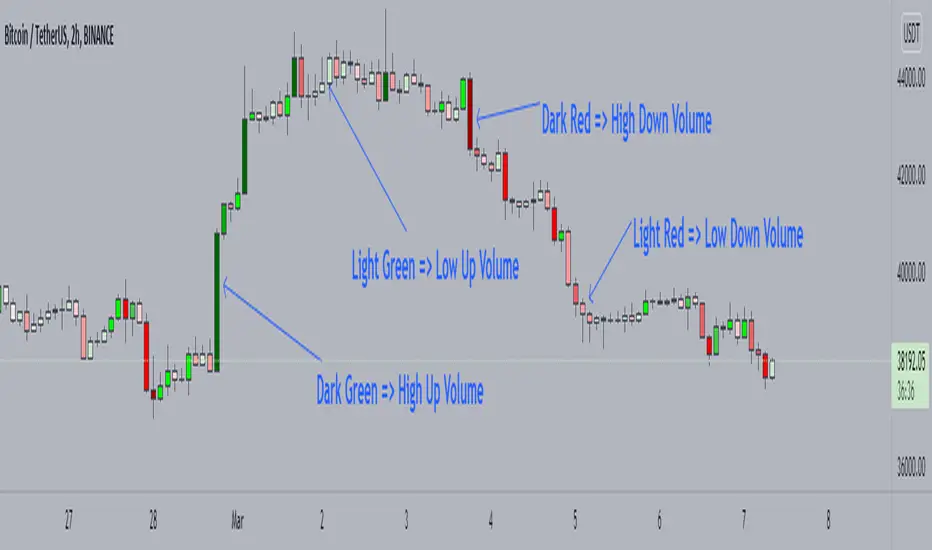
Candle Color by VolumeA simple but effective indicator that paints candles with different shades of colors based on the volume transacted.
-> Supports 6 levels of sensitivity at present. Might enhance the granularity later.
-> Darkest indicates the most volume transacted. Lightest, the least. Change it around however you see fit and based on your theme.
-> Use it for your Volume Spread Analysis and/or in conjunction with any other strategies that you employ.
-> Note that the volume ratio is calculated relative to the average volume of the last n candles ( EMA 20 by default).
Volume Zones Multi-Timeframe OverlayAt its core, this indicator is a variation of my other indicator, Welkin Advanced Volume Overlay (for VSA )
This version is based on the power of multi-timeframe analysis. The basic functionality is simple: Plot lines from the high and low of candles formed during periods of high volume and fill the space between them. The volume levels for deciding what counts as "high volume" are based on standard deviations of the volume's SMA , and the higher the volume , the brighter the zone. i.e., a volume zone set by a volume level that is 4 standard deviations higher than average will be more "filled in" and less transparent than a volume zone from a 2 standard deviation candle.
These zones tend to act as areas of congestion, and the "ceilings" and "floors" of the zones as support and resistance . Overlapping zones tend to indicate strength and are likely to require more effort to get through. The more timeframes that agree with each other, the stronger the zone, ceiling, or floor.
By default, these zones are drawn based on the chart's timeframe and 1 timeframe higher, automatically set based on some "standard" values:
1m -> 5m
5m -> 15m
10m -> 30m
15m -> 60m
30m -> 60m
60m -> 1d
1d -> 1w
Finally, both the base timeframe and the higher timeframe are customizable; this is intended to make it easy to "double" up copies of the indicator to fit even more timeframes on the chart, creating a sort of heatmap for volume price analysis.
An example of three copies of the indicator, showing volume zones from 6 different timeframes.

VPA - 5.0 This is a upgraded version of the vpa analysis script which basically implements Volume Spread Analysis (aka Volume Price analysis). It has been rechristened as VPA 5.0 to be inline with version released for Amiboker package so that all future upgrades will go hand in hand. All most all featured of the Amibroker version has been incorporated in this version. Some important additions are as follows
1. A status window for the bar and Trend Description added. No need to plot the trend bands or additional trend Indicator any more.
2. The most important upgrade would be the addition of a Alert window which provides description of the VSA signals. It is also a log window which provides up to 10 last signals
(Credits to Quantnomad for this wonderful piece of code. This feature is an adaptation of his public code)
3. Added facility to plot EMAs / PEMAs with changable parameters
4. Added facility to plot VWAP
5. Facility to switch on and Off the VSA signals. Also tool tip provides description of the signals
6. Facility to plot Resistance and Volume Lines (Credits to @margepadu)
Hope this script will be helpful to everyone. Please do provide your feedback and suggestions for improvements

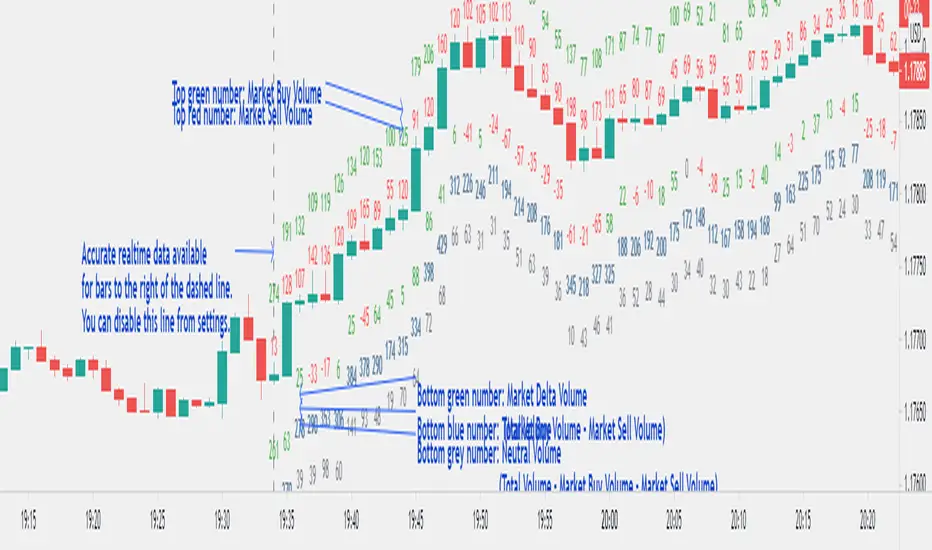
Realtime Volume Bars w Market Buy/Sell/Neutral split & Mkt Delta
What is it?
A tool that shows Real-time Volume bars split into 3 components: (1) Market Buy Volume - i.e., the volume that got transacted on upticks; (2) Market Sell Volume - i.e., the volume that got transacted on downticks;
and, (3) Neutral Volume - i.e., the volume that got transacted without a change in price. (This feature can be turned off if you want normal volume bars).
Market delta (i.e., Market Buy Volume - Market Sell Volume) is also displayed above each volume bar. (On by default; can be switched off from Settings)
The split and Market Delta data are ONLY AVAILABLE FOR REAL-TIME BARS. Historical bars are shown just like regular ones. The dotted line marks the start of real-time data (i.e., the bar from which the indicator started collecting and displaying data). You will see accurate data for bars to the right of this line. The longer you keep a chart open with the study enabled, the more data it collects and displays, and the better your analysis can potentially be.
Note that the data gets reset every time any of the options is changed, the market is switched, the browser is refreshed, or the script is reloaded
DATA ISN'T STORED. I.e., every time a new symbol is loaded, the previous symbol's data is lost. So if you intend to monitor a symbol, you would need to keep it loaded all the time.
Who is it for?
For traders who are used to analyzing buy/sell activity using market buy/sell volume and market delta information
Although you can use this independently as well, use it in conjunction with "Market Delta Volume for Realtime Bars" indicator to get a better visual representation of the numbers.

Market Delta Volume for Realtime BarsWhat is it?
Market Delta Volume Tool for real-time bars
A market delta tool that shows, (1) the volume that got transacted on upticks - or the market buy volume; (2) the volume that got transacted on downticks - or the market sell volume (3) the market delta volume (i.e., market buy volume - market sell volume); (4) the total volume (market buy volume + market sell volume + neutral volume); and (4) the volume that got transacted without a change in price - or the neutral volume (total volume = market buy volume + market sell volume + neutral volume)
NOTE: THIS WORKS ONLY ON REAL-TIME BARS, NOT ON HISTORICAL BARS! The dotted line marks the start of real-time data (i.e., the bar from which the indicator started collecting and displaying data). You will see accurate data only for bars to the right of this line.
The longer you keep a chart open with the study enabled, the more data it collects and displays and the better your analysis can potentially be.
Note that the data gets reset every time any of the options is changed, the market is switched, the browser is refreshed, or the script is reloaded.
DATA ISN'T STORED. I.e., every time a new symbol is loaded/or the same symbol is reloaded, data gets refreshed.
Who is it for?
For traders who are used to analyzing buy/sell activity using market delta information. Especially, short-term trader/scalpers who are used to keeping the same chart open through the trading session.
Also for traders to see and study how anomalies in volume can give clues to buyer/seller absorption, initiative buying/selling etc.
Can be used to better understand VSA as well, although not necessary.
Essentially, this gives real-time delta volume information; use it however you see fit.
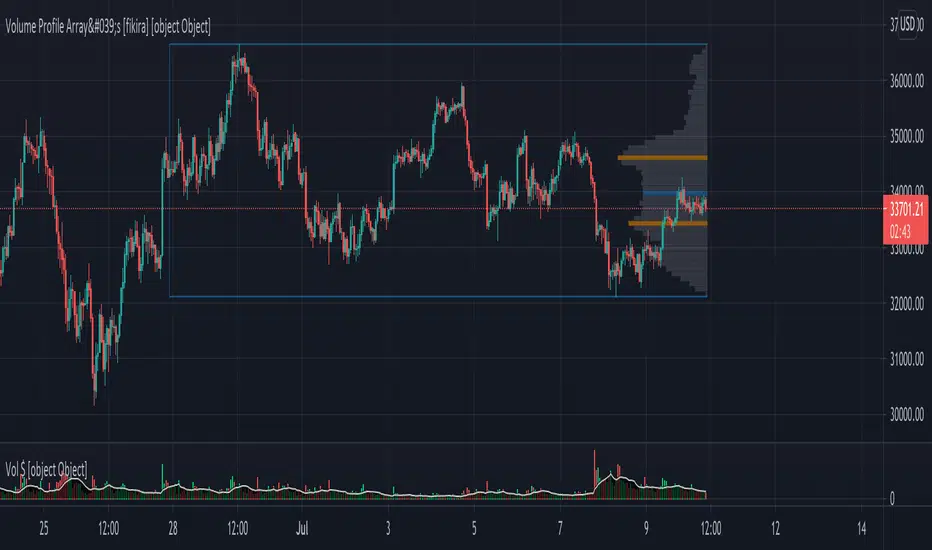
Volume Profile Array's [fikira]Inspired by © IldarAkhmetgaleev (AkhIL) - "Poor man's volume profile" - "PMVolProf"
He did a fantastic job on "Volume Profile"!
My script is about making this with array's
Settings:
- period (last x bars) for calculation
- max width (visible horizontal range)
- amount of sections (vertical sections; to many sections can give an error -> lower the sections in that case)
Setting "high/low", "close":
- "high/low"
-> the volume of every bar (in the period) which low is lower than a particular section and which high is higher than that section is added to that section
- "close"
-> here the volume of every bar (in the period) which close closes in the range of a particular section is added to that section
The orange/blue coloured "Volume lines" are the highest/lowest values above and below present close
(can be used as Support/resistance )
"Only show max/min" shows only the orange/blue Volume lines
The period and highest/lowest is show by 2 thin blue lines
Color, line width is adjustable
Cheers!
Welkin Advanced Volume Study (for VSA)This is a translation of Welkin's Advanced Volume Study Indicator originally written for ThinkOrSwim. This version is simpler than Welkin's and attempts to streamline that basic functionality for beginners to Volume Spread Analysis.
This can be used to replace the built-in volume bar with a more advanced version that is designed to facilitate Volume Spread Analysis. The basic idea is to clearly call out areas of high and low volume that help a trader determine where to "Smart Money" may be attempting to move the market. Volume is an incredible powerful tool for the retail trader; learn how to use it.
Grey bar are Below Average volume .
Blue bars are Average Volume , from a 20sma of volume .
Orange bars are 2-sigma (or 2 standard deviations) above average.
Magenta bars are 3-sigma (3 standard deviations) above average.
The plotted lines represent these levels.
Yellow bars have relatively higher volume compared to the previous bar.
The study can also apply these same colors to the price candles themselves, as well as showing buying and selling pressure of the volume bars.

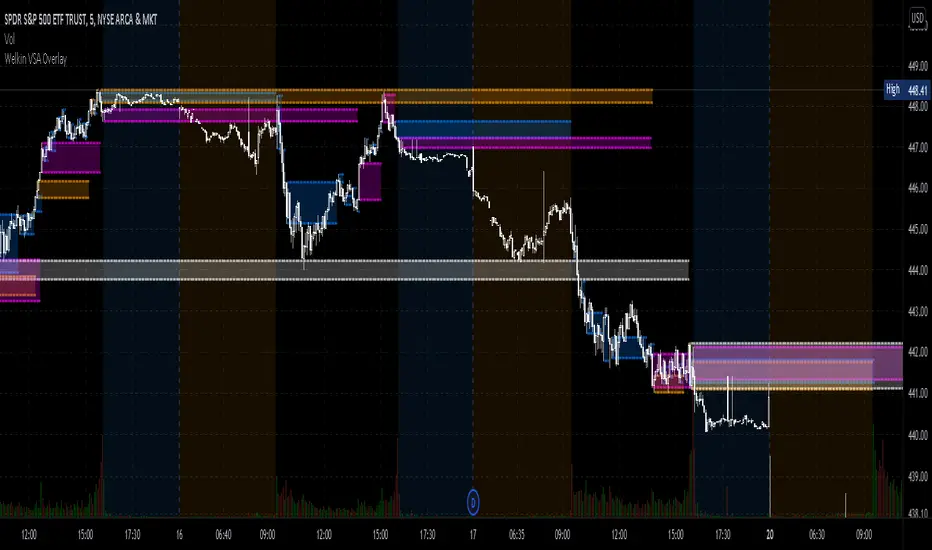
Welkin Advanced Volume Overlay (for VSA)This is a PineScript translation of Welkin's Advanced Volume Indicator Overlay, originally written for ThinkOrSwim. This tool is designed to facilitate Volume Spread Analysis (VSA) by highlighting areas of above average volume alongside price movement.
This indicator does two things:
1. Plots lines that extend from candles of above average, high, and very high volume.
2. Colors in candles with colors indicating volume levels (when "Paint Candles With Volume Colors" is enabled).
Blue lines mark candles with Average volume, based on a 20 SMA.
Orange lines mark 2-sigma (2 times standard deviations higher) volume.
Magenta lines mark 3-sigma (3 times standard deviations higher) volume.
When enabled, gray colored candles indicate below average volume.
Yellow candles indicate volume that is relatively higher than the previous candle, default is 1.25x.
Heatmap Volume [xdecow]This indicator colors the volume bars and candles according to the volume traded. The calculation of the heat map zones is done as follows:
how many standard deviations the volume are distant from the average volume?
For a better visual experience, place the borders and wicks of the candles in a neutral color.

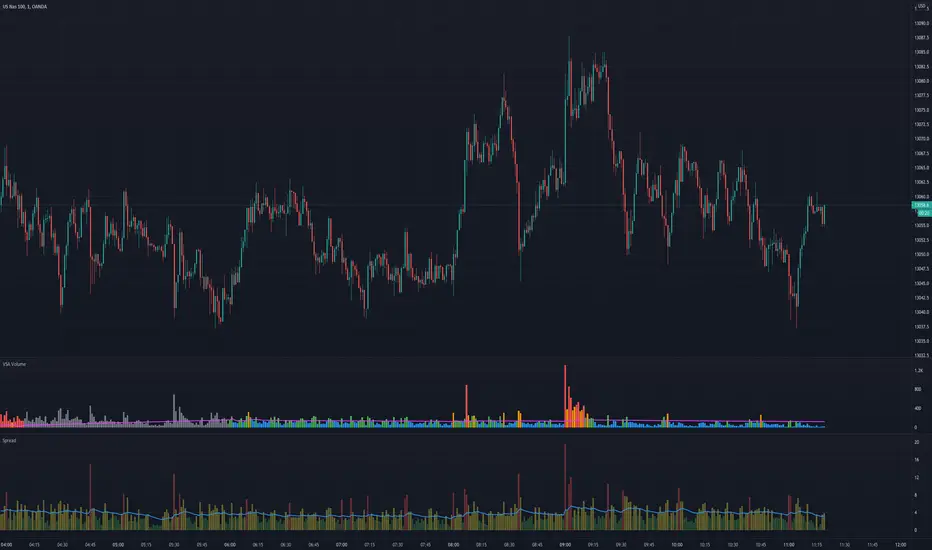
VSA VolumeVolume indicator judging level of volume per bar accordingly to Volume Spread Analysis rules. It allows either to set static volume levels or dynamic ones based on ratio comparable to Moving Average. Bars are coloured based on ratio or static levels, visually presenting level of Volume (low, average, high, ultra high).

VSA SpreadMeasures spread of the candle, useful especially for Volume Spread Analysis (VSA) and to measure trend strength. Spread is coloured based on level comparable to Moving Average.