Volume Price Spread Analysis 2With the same idea of the VPSA i make the VPSA2 to make Heiken Ashi style synthetic graph of the price and the volume effect, its easy to see the volume trends. Each instrument have a more clear time frame to see the volume patterns.
I see very useful like a secondary analysis layer. in the graph show the same RSI with price and VPSA2 like source.
Can use others indicators over the VPSA, only write in CAPITAL letters open, high, low, close or hl2 at inputs section.
Ideas, corrections & comments.
They are always welcome.
Volumepriceanalysis

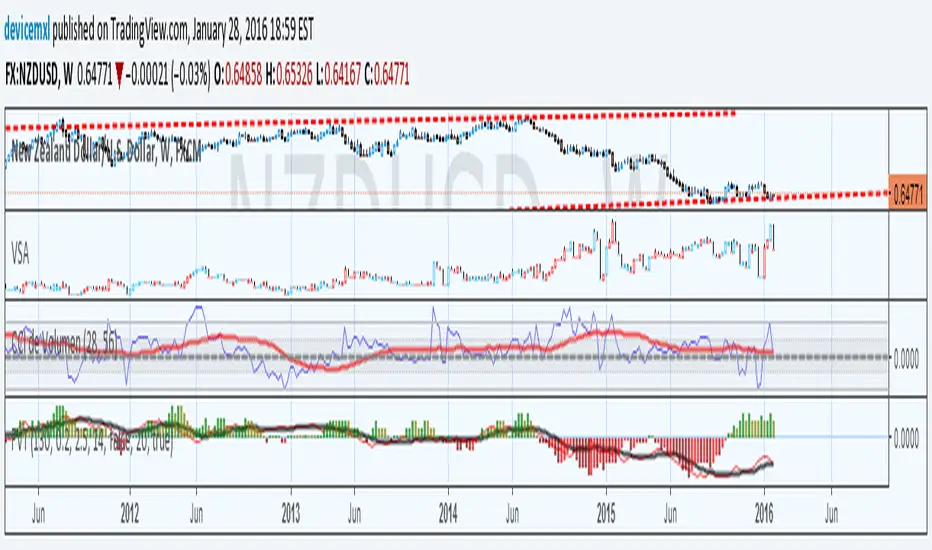
Volume Price Spread AnalysisWith the same idea of the VSA i make the VPSA to make synthetic graph of the price and the volume effect, its easy to see the volume trends. Each instrument have a more clear time frame to see the volume patterns.
Can use others indicators over the VPSA, only write in CAPITAL letters open, high, low, close or hl2 at inputs section.

Colored Volume Bars standard deviation from meanThe colour bars:
Green: Price up - Volume > 2 x STD of last 21 bars
Blue: Price up - Volume > 1 x STD of last 21 bars
Maroon: Price down - Volume > 2 x STD of last 21 bars
Purple: Price down - Volume > 1 x STD of last 21 bars
Grey: not high volume bar
Green line: 2 bar sma
Red line: 8 period sma of the greenline
Bollinger band: 55 period sma of the 21 period sma with bands 1.618 deviation from the mean


Volume CCIHere simply calculate the CCI of the volume, this will use to measure the strength of the trend of the volume
Background:
I think the volume as the price could be represented by candles or other graphic to use indicators and strengthen their analysis, due to lack of registration of this it is first necessary to calculate a volume graph, if the candle traditionally negative price brand then the total volume is taken as negative for the period. An example of this is in the On Balance Volume indicator, the problem is that there is no way to analyze the volume using other methods. An approximate volume of the spread could be the use of the price spread to make a synthetic behavior
As traditionally is observed if Open> Close then the candle and the volume will be negative and vice versa; the next step, is estimate the amounts of the candle necessary to calculate the ratio to use for the volume and thus idealize their spread within the candle:
VLOW = Volume x Low
vHigh = x High Volume
VOpen = vClose
vClose = Volume x Close
This graph can show a stable synthetic form of fluctuations in the volume trend affected by price.
ideas, comments and suggestions (or corrections).They are always welcome

Propagation Volumes and TrendsWith this, i calculate RSI of the HL2 of the volume and use like an oscillator, this will use to measure the strength of the trend and the "Volume Flow" to follow the trend.
I use like foundation the LazyBear "Volume Flow Indicator" "honor a quien honor merece"
Background:
I think the volume as the price could be represented by candles or other graphic to use indicators and strengthen their analysis, due to lack of registration of this it is first necessary to calculate a volume graph, if the candle traditionally negative price brand then the total volume is taken as negative for the period. An example of this is in the On Balance Volume indicator, the problem is that there is no way to analyze the volume using other methods. An approximate volume of the spread could be the use of the price spread to make a synthetic behavior
As traditionally is observed if Open> Close then the candle and the volume will be negative and vice versa; the next step, is estimate the amounts of the candle necessary to calculate the ratio to use for the volume and thus idealize their spread within the candle:
VLOW = Volume x Low
vHigh = x High Volume
VOpen = vClose
vClose = Volume x Close
This graph can show a stable synthetic form of fluctuations in the volume trend affected by price.
ideas, comments and suggestions (or corrections).They are always welcome