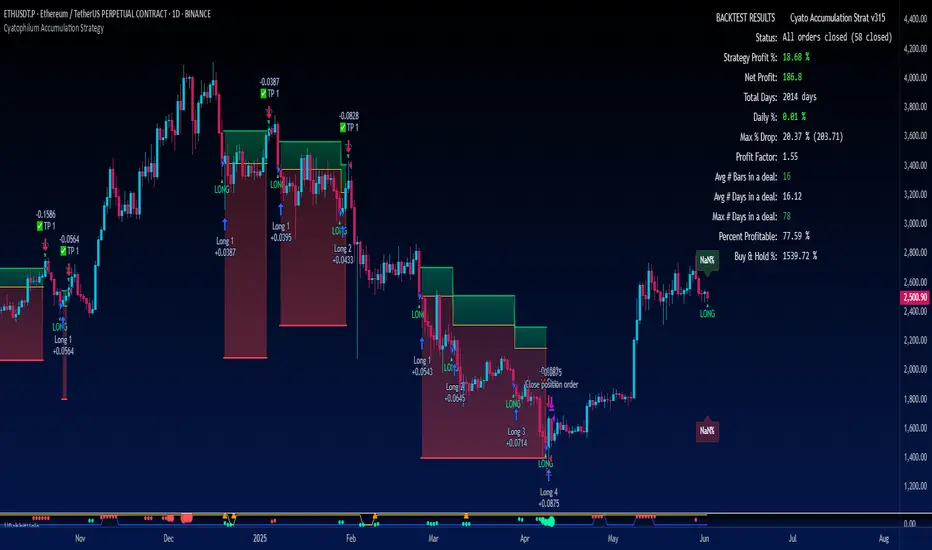
DekaBot V5.1Dekabot is a BTCUSDT trading signals indicator. The buy/sell alerts are not re-painted so the results displayed will not change when Tradingview is reloaded.
Dekabot uses a combination of Bollinger Bands, MAs and RSI to determine if the market is in an uptrend or downtrend and a custom built indicator determines when a market is oversold and overbought which creates the buy and sell signals.
Please PM us to obtain access to use Dekabot Signals.
Volatilidade
EURUSD DinhChienFX's signal V4.0Risk/reward: 1/1.3 | Entry by: Upper/Lower | Keltner crossing: 2 | Candle not entry: 80% | Stochastic: 70/15 | Adx: 31/9/9 | Notrade friday
Max risk: 3% - Risk / reward: 1 / 1.3.
1. Trend identification:
... Keltner: Price Through Upper / Lower 1 gives 1 point. 2 points are eligible for entry.
... Stochastic:
...... k> 70: Uptrend. k <15: Down trend.
... ADX: 31 provides strong trend following signal.
2. Entry point:
... Price corrects to Upper / Lower when 3 conditions Keltner , Stochastic & ADX indicator meet.
3. Not trade friday.
-------------
"Use the link below to obtain access to this indicator" or "PM us to obtain access"
Squeeze Momentum StrategyJust turned LazyBears' Squeeze Momentum Indicator into a strategy. You can understand how it works and pay credit to LazyBear here: uk (dot) tradingview (dot) com/v/nqQ1DT5a/
Best results seem to be on the 4h chart. Added LazyBear's Volume Weighted Moving Average indicator, which can be used (select in strategy properties) to more selectively long or short if desired. Defaults to using 100% of your initial strategy equity (just my preference), and this cannot be changed without recoding the strategy, but should be easy to do if desired. Added leverage, trade risk, backdate time window and trade type selector inputs.
Happy trading!
Not financial advice.
GOLD FUTURES TRADING STRATEGY AND SIGNALS WITH PERFORMANCE GOLD FUTURES GOLD1! , GOLDM , GC Trading Strategy And Signals, With Performance For Different Time Frames.
We present to your attention an indicator that, based on a strategy, generates buy / sell arrow signals and a gold futures trading strategy, which has shown its effectiveness in numerous tests on different time frames.
The strategy is based on a combination of ATR, Moving Average, MACD and RSI indicators.
If you consider gold as a tool for earning then active trading on the exchange, your choice is gold futures (gold futures). This derivative almost completely copies the movement of the price of physical gold, and is used by traders around the world to obtain from the fluctuations in the price of gold.
The strategy showed the best results for timeframes: H1, H2, H4, D1.
Recommended timeframe for this strategy: D1.
The strategy uses take-profit and stop-loss, which reduces risk and allows you to effectively use its trading, as well as the process of making trading decisions and predicting the movement of the gold price.
Gold and silver futures can be used to hedge against inflation, speculative play, an alternative investment grade, or as a commercial hedging method for investors looking for opportunities beyond traditional equities and fixed income securities.
The script can generate alters "Buy" and "Sell".
The presented indicator of signals for gold futures, as well as the strategy, can complement your existing strategy and increase its performance, and can also be considered as an independent trading strategy for gold futures contracts.
Full Screenshot chart with performance here.
US30-DinhChienFX's Followtrend V2.0+ A Long trend is when the price close & crossover the Keltner Upper 2 + k value of Stochastic indicator crossover 80.
+ A Short trend is when the price close & crossunder the Keltner Lower 2 + k value of Stochastic indicator crossunder 20.
+ to Entry when k value (Stoch indicator) make correction and cross the d value (Stoch indicator)
- Buy: k & d > 79
- Sell: k & d < 17
+ No trade Friday.
*** Use the link below to obtain access to this indicator
TradeChartist Donchian Channels Breakout Strategy™TradeChartist Donchian Channels Breakout Strategy is the strategy backtester version of ™TradeChartist Donchian Channels Breakout Filter .
===================================================================================================================
Features of ™TradeChartist Donchian Channels Breakout Strategy
========================================================
Option to plot Donchian Channels of user preferred length, based on the Source price in addition to High/Low Donchian Channels.
Generates trade entries based on user preferred Breakout Price. For example, if the user prefers HL2 as breakout price, irrespective of the Donchian Channels type, trade entries are generated only when hl2 price (average of high/low) breaks out of the upper or lower band.
Option to plot background colour based on Breakout trend. The bull zones are filled with green background, the Bear zones are filled with red background and the bar that broke out is filled with orange background.
Option to colour price bars using Donchian Channels price trend. The Donchian Channels basis line is plotted using the same colours as coloured bars as default.
Note: This script does not repaint. To use the script for trade entries, wait for the bar close without Backtester or Strategy entries (with Backtester) and use a second confirmator (includes fundamentals) based on asset type as some markets require users to have good pulse on the fundamentals as trading by Technicals/price action dynamic alone may not be safe.
Note: Trend Based Stochastic of the same DC Length can be used from ™TradeChartist Risk Meter for Trade Confirmations too.
===================================================================================================================
Best Practice: Test with different settings first using Paper Trades before trading with real money
===================================================================================================================
This is not a free to use strategy. Get in touch with me (PM me directly if you would like trial access to test the strategy)
Premium Scripts - Trial access and Information
Trial access offered on all Premium scripts.
PM me directly to request trial access to the scripts or for more information.
===================================================================================================================
BB+K strategyApplying Bollinger Bands and K-bar strategies
Suitable for long time periods
Suitable for forex trading, when the forex deviation is too large, the Fed will intervene and thus correct
Strategy: Enter when the price hits the upper or lower BB track and there is a reversal of the strong signal, and exit when it hits the other track and there is a reversal signal.
BuyTheDip V2This is enhanced version of BuyTheDip Strategy which can be used for stocks and cryptos as well along with indices.
In addition to V1, the enhancement include breaking the zone into multiple levels based on multiple standard deviation Bollinger bands. Dip is confirmed only when price bounce back certain levels from the bottom. If price keeps going down, strategy does not generate signal.
Input parameters are as below:
ATR Parameters : AtrLength and AtrMult to calculate trailing stops
Trailing Condition parameters : TrailAfterBars, TrailTargetState - Trailing does not happen immediately. It either waits for TrailAfterBars to complete or price moves up by TrailTargetState levels in multi bollinger band level setup - whichever happens first.
Force Exit Parameters : If the price state based on multi-bollinger bands drop by TargetStopStateDiff level from its peak, then it will force exit from the trade if ExitOnFailureSignal is checked.
Entry Filters : It is not a dip if the instrument is already in downtrend. ConsiderYearlyHighLow , ConsiderNewLongTermHighLows and ConsiderMAAlignment are used for filtering entries so that we only buy the dip for uptrending instruments.
5 min scalper for indian marketHi friends....publishing 5 min scalper for indian market... which shows the movement of price over time and how strong those movements are/will be, regardless of the direction the price moves, up, or down. Indicator specifically useful, as it helps traders and analysts spot points where the market can and will reverse by providing signals long (buy) and short (sell). Show the relative strength of price movements but leave out the directionality of the price movements, best utilized in combination with other technical indicators – such as trend lines and moving averages – which show price trends and directions. Having an alert feature to make aware market players from signals provided by strategy.
It analyz underlying volume and shows buy and sell signal...
U also can modify algo length ..
some tips for new traders to become successful trader
1: always follow risk management...
2: every stock/ forex / crypto has it own cycle.. So pls dont jump from one stock / forex pair to another when u hear some stock / crypto has
made new high or low... Bcs after that consolidation period starts.. During consolidation we can not make more profit as in trending market.. So be patient when u had made some position or tarde in one stock/ pair...
3 : we dont require to trade in every stocks / forex/crypto.. Just one stock and pair trading daily make u profitable beyond ur expection.. Bcs
trading in one stock / forex pair.. make u very comfortable and u may always know its movement... And u also trade in every cycle of this
stock/ pair.. So u also trdae its trend days which made highest profit. We dont know when is trend of any stock... Compare with it
business... Trading is business not one day rich game... Its business... It takes time and u have to do same thing agian and again to become
sucessfull trader for this u can use tradingview alerts. .for that u dont need to seat infrot of ur terminal screen.. u can also do algo trading
by using tradingview alerts
4 : By following risk management and incerase lot size as profit increased... This is the key 🔑 of sucess in stocks / forex / crypto market.
I thinks this tips may help new trader. U can modified according to ur trading style..
You can personal message me if u want to use this strategy
******************if u want to use this indicator u can personal message me********************************************************
HEINKI ASHI SUPERTRENDHi friends....publishing Heikin ashi supertrend strategy... which shows the movement of price over time and how strong those movements are/will be, regardless of the direction the price moves, up, or down. Indicator specifically useful, as it helps traders and analysts spot points where the market can and will reverse by providing signals long (buy) and short (sell). Show the relative strength of price movements but leave out the directionality of the price movements, best utilized in combination with other technical indicators – such as trend lines and moving averages – which show price trends and directions. Having an alert feature to make aware market players from signals provided by strategy.
HA charts are a great way to help those who can be spooked by the chaos of the markets (I'm one!), but they have a big drawback in that the price you see on a HA candle is often significantly different from the real price that you would trade on. This brings issues of unrealistic expectations of profits/losses, and also makes back testing a strategy very difficult. I still wouldn't recommend ever using TradingView's "strategy" tool when using HA charts, but using this indicator you can do accurate back tests.
***************This uses Heikin Ashi Candles as source on normal chart..dont use it on heikin ashi chart*****************************
There is an option for use normal japanes candle supertrend..so we can compare how this heikin ashi prevent false trades.
some tips for new traders to become successful trader
1: always follow risk management...
2: every stock/ forex / crypto has it own cycle.. So pls dont jump from one stock / forex pair to another when u hear some stock / crypto has
made new high or low... Bcs after that consolidation period starts.. During consolidation we can not make more profit as in trending market.. So be patient when u had made some position or tarde in one stock/ pair...
3 : we dont require to trade in every stocks / forex/crypto.. Just one stock and pair trading daily make u profitable beyond ur expection.. Bcs
trading in one stock / forex pair.. make u very comfortable and u may always know its movement... And u also trade in every cycle of this
stock/ pair.. So u also trdae its trend days which made highest profit. We dont know when is trend of any stock... Compare with it
business... Trading is business not one day rich game... Its business... It takes time and u have to do same thing agian and again to become
sucessfull trader for this u can use tradingview alerts. .for that u dont need to seat infrot of ur terminal screen.. u can also do algo trading
by using tradingview alerts
4 : By following risk management and incerase lot size as profit increased... This is the key 🔑 of sucess in stocks / forex / crypto market.
I thinks this tips may help new trader. U can modified according to ur trading style..
You can personal message me if u want to use this strategy
******************if u want to use this indicator u can personal message me********************************************************
Escaping of Rate from Avarage By Mustafa OZVER StrategyI simulated the EoRfA indicator with the gold price
For details about the indicator, visit my profile on tradingview
For Simulation, with default settings, we order
if Eorfa > 1 and change(eorfa) < 0
sell
if Eorfa < -1 and change(eorfa) > 0
buy
And we got
- 2.49 % profit
- 74 % profittable order from all
But only this value can not guarantee good results for trading. BE CAREFUL
Vegas Tunnel strategyApply Vegas Tunnel,
Use EMA144 169 as medium-term trend support
Also use EMA 576 676 and 4 multiples of 144 and 169 as long-term support and trend direction
Also increase EMA 36 43 as a short-term trend support
Suitable for stocks, indices, commodities
The applicable time scale can back-test the usability of the strategy by itself, and select the most applicable target
Introduction to current trading strategy:
According to the trend, the price will enter the market when it touches the support of each stage. When it touches the bollinger bands, it is Squeeze. Hold until it leaves the bollinger bands
But the trading strategy can be more optimized, see the code for details
Profit MAX MTF HeatMapThis is a powerfull strategy which is made from combining 3 multi timeframes into one for profit max indicator
In this case we have daily, weekly and montly.
Our long conditions are the next ones :
if we have an uptrend on all 3 at the same time, we go long.
If we have a downtrend on all 3 of them at the same time we go short.
For exit, for long, as soon as one of the 3 converts into downtrend we exit the trade.
For exit, for short, as soon as one of the 3 converts into uptrend we exit the trade.
This tool can be used on all types of markets, and can also be changed the time frames.
Quansium Series A BacktestThis comes with preconfigured setups or strategies. Simply choose one from our list based on the timeframe it was made for. Leverage can be changed; to keep trading safe, a maximum of 2 is allowed. In our findings, this was able to trade crypto (specifically BTC ), MES (Micro E-mini S&P 500 Index Futures ), and stocks. It is important to know that setups A, B, C, and D use variable position sizing, and dynamic stop loss/trailing stop/take profit, these parameters are provided through the alerts. The rest of the strategies were created with a simpler approach in mind, just plainly entry/exits signals.
Quansium as a framework:
Price reformat: we take the price source (Open, Close, High, Low) and remove any noise that affects the accuracy of our signals.
Time awareness: we take several time periods of the data on the chart such as start, end, and whole. We use this to add more depth to our signals.
Position size: our backtest tries to recreate as much as the real world trades as possible so our position is determined by the current equity. We also use the volatility of the market to increase or decrease our exposure or risk.
Risk awareness: stop loss, take profit, trailing stop are the risk exits we use to provide our users some peace of mind. These parameters are totally dynamic and follow the same behavior of the market.
Signals filtering: to make almost non-existent any errors and increase the quality of our trades, our indicators go through multiple phases, this avoid double entries or early exits, and help maintain a record of what has transpired and what’s currently taking place.
Indicators: whenever we can we use custom code or our own functions instead of the defaults ones provided. This gives us total control of what we’re trying to achieve. In many cases we tend to combine several indicators’ logic into one creating a more personalized take on it.
Easiness: since we started our main goal has been to provide the easiest and fastest way to alerts’ creation. It has taken us years to reach this level where now we already provide a list of preset strategies so the user doesn’t have to spend much time tinkering with scripts and more on other matters, because we know life is more than just trading.
Raw signals: we provide the option to turn off as much of our advanced features such as stop loss, take profit, trailing stop, dynamic sizing, etc, etc for a simple approach. Trade signals still go through the signals filtering method mentioned above,
Timeframe pairing: we take trading very seriously, by no way we’ll want the user to lose money (although such thing is expected because past results aren’t an indicative of futures ones), through years of experience we have found what are usually common mistakes the user makes, this feature allows us to only activate the strategy if the right timeframe is chosen.
Trend filters: through the years we have improved the arts of the trend. We like to keep things simple but yet powerful. We observe the macro and micro trend of the security. This helps confirm we are entering at the desirable timing. We also incorporate volume and volatility into decision making, we simply programmed it to trade when these are increasing and higher than the average values observed in both the short and long term. Finally we take into account the strength of the pair to make our final choice of whether to enter or wait, and if anything flashes contrary movement then we cancel the upcoming signal and stop monitoring until the next one comes along.
Full automated risk: stop loss, take profit, and trailing stops usually are set in percentages, and optimized even more using the current market behavior to become more adaptive. But always remains some sort of fixation, so the user must choose a value somewhere. This is where our framework shines the most, as previously mentioned before when we take time into our calculations, we use several periods to observe performance and get values that keep our risk exits natural and closest to the flow of the market itself.
Setups:
A: Centered oscillator with the difference of several moving averages with more sensitive settings. Momentum focused.
B: Centered oscillator using simple moving averages. Trend-Following focused.
C: Centered oscillator using smoothed data with the help of faster moving averages. Trend-Following focused.
D: Centered oscillator with the difference of several moving averages with less sensitive settings. Trend-Following focused.
E: Centered oscillator with the difference of moving averages where the standard deviation is applied first. It uses less sensitive settings. Trend-Following focused.
F: Finds the relationship between multiple readings of the price’s relative strength to better pin-point downs and ups. Trend-Following focused.
G: Centered oscillator with the difference of moving averages where the standard deviation is applied first. It uses more sensitive settings. Momentum focused.
H: Multiple centered oscillators using various moving averages. Trend-Following focused.
I: Centered oscillator using simple moving averages. Momentum focused.
Note: The framework is composed of almost 1000 lines of code as compared to each indicator that makes up the setup which is around 10. The power from Quansium doesn't come from the strategies themselves but rather the overall system that turns simple signals into complex and advanced trades.
Strategy Tester:
Initial Capital: chosen value is $20,000, as an approximate to Bitcoin’s ATH (All-Time High). In previous iterations we noticed some trades won’t go through if the capital was less than the ATH.
Order Size: 100% of equity (although the script controls this, and this is of no regards to the results).
Pyramiding: 1, system doesn’t place multiple entries in a row, only one at a time.
Commission: This simulates order execution with custom trading fees. Commissions are turned off by default because this script works in various markets and each operates differently. In order to reach results that are close to real world conditions, it is imperative the user fills this based upon their broker or exchange data.
When we started, we were focused on finding the best indicator, or creating it ourselves. After years we came to realize that the secret is not in which indicator you use but the framework behind it. All strategies have bad, good, best, worst performance periods. The key of a good system is to help keep you safe when it’s down and maximize your potential when it’s up. We hope this material at the very minimum inspires you to keep going and not lose faith, because it is not the smartest who win but those who persevere.
Daily Open Strategy (DOS)DOS is a mean-reversal strategy that trades against the previous candle direction as long as it has body greater than the PrevRange paremeter.
Best results are obtained in GBP and AUD pairs on daily charts , but of course you can experiment with other assets and timeframes.
Strategy parameters include starting and ending dates, the previous candle range (raw value), the Stop Loss (SL, in pips, 200 = 20 pips) and the Take Profit (TP, in pips too).
Swing Algo For Allhi friends....publishing Swing Algo For All .. which shows the movement of price over time and how strong those movements are/will be, regardless of the direction the price moves, up, or down. Indicator specifically useful, as it helps traders and analysts spot points where the market can and will reverse by providing signals long (buy) and short (sell). Show the relative strength of price movements but leave out the directionality of the price movements, best utilized in combination with other technical indicators – such as trend lines and moving averages – which show price trends and directions. Having an alert feature to make aware market players from signals provided by the strategy.
There are mainly 3 tyes of swing traders
1 intraday swing trader
2 weekly positional swing trader
3 monthly/yearly positional swing trader
This strategy solves problem of all the type of swing trader. you have to just select type of swing which u want to trade suppose u chose intraday swing it automatically calculate intraday swing high and low and shows buy and sell sign according to it...if it shows buy signal than in lower part it shows plotted line when this line break it automatically generate sell signal and vice versa for sell signal.
same for weekly , monthly and yearly
u can use it in any time frame bcs swing structure are same in any time frame
*********************************************************************************************************
*************** And also use for any stocks, forex and crypto*****************
screenshot on Banknifty weekly swing
some tips for new traders to become successful trader
1: always follow risk management...
2: every stock/ forex / crypto has it own cycle.. So pls dont jump from one stock / forex pair to another when u hear some stock / crypto has
made new high or low... Bcs after that consolidation period starts.. During consolidation we can not make more profit as in trending market.. So be patient when u had made some position or tarde in one stock/ pair...
3 : we dont require to trade in every stocks / forex/crypto.. Just one stock and pair trading daily make u profitable beyond ur expection.. Bcs
trading in one stock / forex pair.. make u very comfortable and u may always know its movement... And u also trade in every cycle of this
stock/ pair.. So u also trdae its trend days which made highest profit. We dont know when is trend of any stock... Compare with it
business... Trading is business not one day rich game... Its business... It takes time and u have to do same thing agian and again to become
sucessfull trader for this u can use tradingview alerts. .for that u dont need to seat infrot of ur terminal screen.. u can also do algo trading
by using tradingview alerts
4 : By following risk management and incerase lot size as profit increased... This is the key 🔑 of sucess in stocks / forex / crypto market.
I thinks this tips may help new trader. U can modified according to ur trading style..
You can personal message me if u want to use this strategy
u can personal message me if u want to use it..
MoneyMoves ALGOThe strategy works with the crossing of two moving averages, slope and basis line of the volatility bands.
when slope crosses up the basis line the signal is buy, when slope crosses down the base line it is sell
the volatility bands represent standard deviations, when the market is flattened it is consolidated
Show Break Out Support or Resistance Alarm
The supports and resistances are based on superior times, daily, weekly, and monthly.
suited has two alarms: one, when the high price breaks resistance or a low price, breaks support. and another when the close with volume breaks resistance or support, select the Volume Break Out S&R Back Period mode, and indicate periods behind the volume.
Back test section.
you can select a specific date for testing the strategy.
You also have the option of a money management, where you can put profits or losses both in buy or sell.
You can also select in the go long or go sell option if you want the system to only operate buy or sell
Momentum Strategy [MA Crossover + Squeeze Release + Alerts]This is a Strategy with associated visual indicators and Buy/Sell/Close Alerts for the Squeeze Momentum Indicator .
Development Notes
-------------------------
This is a fork of LazyBear's Squeeze Momentum Indicator histogram with an added moving average crossover for multiple trade signal confirmation. Functionality for Multi-Timeframe Resolution was also enabled and code was updated for PineScript v4 compatibility.
Strategy Description
-------------------------
Enter trade when the active crossover period (identified by background crossover indicator/zone) correlates with a squeeze release (black to gray cross along midline). BUY Long if momentum in uptrend or SELL Short if in downtrend. Close trade when momentum reverses.
Alerts configured for entering Long/Short position and to Close order.
Designed to have only one open long or short position at a time (no pyramiding) with an associated close order for each.
Indicator Visuals
--------------------
Crossover zone background (green or red) based on last crossover direction (only buy orders are triggered in a buy zone and sell orders in a sell zone)
Moving average crossover line matches trend (buy upwards on green and sell downwards on red)
Buy (green circle) and Sell (red circle) signals at the point of crossover
Buy (green cross) and Sell (red cross) signals at squeeze release on the midline
Long (green arrow) and Short (red arrow) order label when every indicator is triggered together
Close (purple arrow) and label when either trend or crossover zone changes
Recommend backtesting with the resolution set to current timeframe to avoid repainting; no other known repainting. There is a current bug or flaw in the script where all the Close and some of the Long and Short orders are not executed by the strategy (this doesn't affect the visual indicators, only the strategy).
Note that the provided backtest result is based on a position sizing of 10% equity with 100k initial capital. The 15-minute timeframe performed the best, with the 30-minute a close second, and 5/45-minute tied for third. Profit/loss went into the red when expanding out to 2-hours or beyond. I suspect this could be improved upon if you follow the Alerts on the oscillator versus rely solely on the strategy (due to the aforementioned issue with all entry and exit positions not being depicted).
Disclaimer
Past performance may not be indicative of future results. Due to various factors, including changing market conditions, the strategy may no longer perform as well as in historical backtesting. This post and the script are not intended to provide any financial advice.
Script is currently protected (due to the extensive development in the strategy) to prevent the source from being copied and sold.
Keltner Channel [LINKUSDT] 1HThis is a long-only strategy tested on LINK/USDT, 1 hour bar, from Feb 2019. The entry is determined by the breakout of upper Keltnel Channel and when the +DI is higher than 32. Instead of a fixed stop-loss from the original script , I change the exit to the middle band of the Keltnel Channel. 1st profit target will close 20% of the position. 2nd profit target will close 30% of the position. While the remaining 50% position will be closed when the price closes below the middle band of the Keltnel Channel, to take advantage of big trend. All parameters are adjustable. I added another option to enable or disable the ribbon trend filter.
My thoughts: For the same period, LINK appreciated 3000%. So I guess most in and out strategies couldn’t beat a buy and hold strategy during this period. But this doesn’t mean that this strategy is not feasible as each strategy is designed to only take advantage of a certain pattern or behavior of the market. Also, short term strategies allow you to use leverage and hence enable you to use you capital efficiently. Commission is set to 0.1%, taking account of the slippage.
Suggestion: Please perform walk forward analysis before you use real money for trading. Parameters need to be adjusted from time to time depends on your analysis. Can try using ATR for profit targets as over a longer term, the volatility might drop hence a high fixed % profit targets might not be realistic.
Any suggestions are welcome!
BTCUSD 30MIN TREND STRATEGYBTCUSD 30MIN TREND STRATEGY.
This strategy signals is based on the market close price and calculate for buy and sell signals. it uses composite technical algorithm to filter out the best buying and selling points.This indicator should be used to see trend, range zones, evaluate the best areas to enter the market, use only 30 MINUTES and BTCUSD and only bitcoin derivatives BTCUSDT perpetual or inverse etc. Can use spot or future markets
It designed for automatic crypto trade bot systems. You can use alarms from webhook setting up for your bot.
For use message me.
Daily Crypto StrategyThis is a long only strategy.
This strategy measures and creates a signal when an asset is moving out of a correlation with CBOE VIX into an inverse correlation.
It also has a risk management with TP/SL based on percentages.
If you have any questions let me know.
PpSIgnal Algorithm Trade System BANKNFTY Only for trading BankNifty Fut.
Use in 15 minutes time frame.
Initial capital 1000 Use Indian Rupee , you buy the maximum of the capital since it represents little money at the beginning, you can risk less capital in percentage, for example, 10% of 1000 IR.
Commission 0.006% per contract, we use the commission of one of the best-known brokers.
You can adjust the slippage you consider.
Date of time strategy
strategy star from 05/2019, You can choose the start day and the end day of the backtesting test.
Money management
Take profit to buy 1%
Stop Lose sell 1%
Take Profit 1%
Stop Loss 1%
How it works?
The system works by looking for trends and volatility in a 15-minute time frame.
Once the system finds the trend and volatility, it opens an operation looking for a profit at the buy of 1% and loss control of 1%. For Sell operations, it will seek a 1% profit with a 1% loss control.
Enjoy it ....date expired 17 December 2020
PpSIgnal Algorithm Trade System SUSHI Algorithm-based solely for trading SUSHI USDT.
Initial capital 50 USD, you buy the maximum of the capital since it represents little money at the beginning, you can risk less capital in percentage, for example, 10% of the 50 USD.
Commission 0.0045% per contract, we use the commission of one of the best-known brokers.
You can adjust the slippage you consider.
Date of time strategy
You can choose the start day and the end day of the backtesting test.
Money management
Take profit to buy 0.5%
Stop Lose sell 1%
Take Profit 1%
Stop Loss 1%
How it works?
The system works by looking for trends and volatility in a 15-minute time frame.
Once the system finds the trend and volatility, it opens an operation looking for a profit at the buy of 0.5% and loss control of 1%.
For Sell operations, it will seek a 1% profit with a 1% loss control.
You can find the profit you want
MACD Strategy with trailing ATR stopThis is a trend based strategy that uses EMA and SMA intersection for determining the direction of the trend and MACD for the entry signal. At the same time, the strategy uses ATR, which is working as a trailing stop.
The strategy entry will work when the Trend ribbon will turn green and MACD line will crossover the signal line. This strategy also takes into account the pyramiding and allows to enter the second time if the signal will repeat itself.
There are 3 exit points. The first 10% of the position will be closed when the price will increase by 1%. The second portion of 50% will be closed when the price reaches 5% Take profit target. The remaining 40 % of the position will wait for the exit signal which will occur when the price closes below the ATR line.
The strategy is using a fixed amount in dollars, each time the entry occurs the strategy will enter with 100$ in the order.
The strategy can be applied to other crypto assets. However, they will require input changes.
Best of luck with your trading.