Indicadores, Estratégias e Bibliotecas
This is an EMA crossover strategy which involves 5 EMAs to trigger trades. The strategy has two take profit settings and uses a stop loss. TP1 and SL are based on ATR and TP2 is an EMA crossover. The strategy goes both long and short and the default settings work particularly well as a scalping strategy for ETHUSDT on the 5M time frame. I have also created...
BNB_USDT _3m Release Notes: Time: 3min Pair: BNB_USDT Use: {{strategy.order.alert_message}} What's the difference with 3Commas Bollinger Strategy by tedwardd: 1. Initial capital: 1210 USDT (10$ Base order / 400$*3 Safety order), if you will change, please change JUST safety order volume or number of safety orders 2-3 2. Using just 2(3) safety...
Good morning traders! This time I want to share with you a little script that, thanks to the use of arrays, allows you to have interesting statistical and financial insights taken from the symbol on chart and compared to those of another symbol you desire (in this case the metrics taken from the perpetual future ETHUSDT are compared to those taken from the...
Total cryptocurrency market capitalization without tether, with alerts for chosen value thresholds. The rationale is that tether is a printed supply stablecoin with a fixed value; there is no need to include its value in a combined market cap. It's debatable if that's true, but that doesn't explain what this indicator is. The second part of this indicator is...
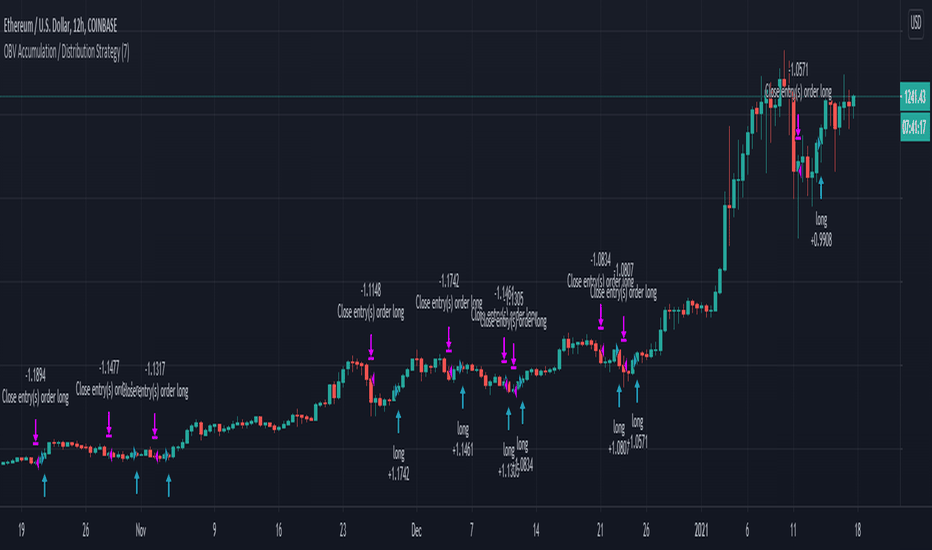
This version its made for 8-12h and works amazingly on the ETH pairs. Can be adapted to others as well For this example, I used an initial 1$ account, using always full capital on each trade(without using any leverage), together with a 0.1% commission/fees for each deal, on Coinbase broker. This is a long only strategy The components for the inside of the...
This is a crypto strategy suited for big time frames like 3h+. THIS IS A LONG ONLY STRATEGY , SUITED TO BEAT BUY AND HOLD ! It's a very risky strategy because it has no stop loss at all, so be extremely careful with it. This strategy is made of 2 DEMA a fast and a slow one. We have two rules : entry it's when we have a crossunder between the slow DEMA and...
This is a simple script that aggregates the USDTUSD pairs available on TradingView and shows the average price of (USDTUSD - 1). Heavy buying of BTC on USD exchanges (read: Coinbase) will result in a positive USDT premium Heavy selling of BTC on USD exchanges (read: Coinbase) will result in a negative USDT premium Heavy buying of BTC on USDT exchanges result in...
Today I bring you another amazing strategy. Its made of 2 EMA in this case 50 and 100. At the same time, internaly for candles we calculate the candles using the HA system ( while still using in live the normal candles). This way we can assure that even if we use HA candles, we avoid repainting, and its legit. We first calculate the HA candles based on the EMA...
Hello, today I bring you another crypto strategy which can work with multiple timeframes and most of crypto currencies Its made entirelly of multiple EMA , of different lengths : like super fast, fast, normal, slow and very slow We also combine a little bit of price action together with the trend direction both for entry and for exits, to have a more precise...
Today I bring an indicator specialized in crypto markets. Its made of multiples EMA : very fast, fast, normal, slow, very slow The logic behind its simple : For long : we check that the EMA are in ascending order like EMA 5 > EMA 10 > EMA 20 .... and at the same time that last close of candle is above all of them. For short : we check that the EMA are in...
**************** OnegreenCandle - Tether Printer ************************ Shows the total market cap of USDT (US Dollar Tether) currency. Helpful for swing trading longer timeframes and indentifying new supply in the crypto market.
This provides a Binance BTCUSDT ticker that is more aligned with spot exchange price. There is an invisible line added to so it is possible to add indicators like MAs to it. It must be turned on in options to be used. Possible usecases: Add it to a Binance chart as a price source but keep real volume To feel like you have an edge For an more accurate and...
This was a follower suggested script. This script compares the USDT and BTC relative prices of a particular altcoin traded on Binance by calculating it's USDT price comparative to BTC. This is a very simple calculation (ALT/USDT price divided by ALT/BTC price). From there, we simply subtract the BTC/USDT price from the ALT ration price and we can see if a coin...
spot_volume / tether_volume spot = Coinbase + bitFlyer + Kraken + Bitstamp tether = Bitfinex + binance + Huobi + HitBTC
This indicator shows Bitcoin price deviation from average of price across difference exchanges in percentage. As you can see, price at Bitfinex and Binance (both BTC/Tether pairs) are going up relative to BTC/USD pairs. This means Tether price is going down for some fishy reason(s). In the next update, I will add Tether price calculation.
Hi again! Its me Octo. Blood with milk! Yes it's a combination of 2 indicators classic rsi and rsi volume by LB. The indicator with volumes better shows the divergence, but you should not miss the classic rsi. The red zone is bullish vol/ white-bearish. I filled out the difference between the 2 indicators, so that it would be understandable how significant the...


![[laoowai]BNB_USDT_3m_3Commas_Bollinger_MACD_RSI_Strategy BNBUSDT: [laoowai]BNB_USDT_3m_3Commas_Bollinger_MACD_RSI_Strategy](https://s3.tradingview.com/s/skl7JtgC_mid.png)


![Binance BTC ALT Ratio Difference [BigBitsIO] BTCUSD: Binance BTC ALT Ratio Difference [BigBitsIO]](https://s3.tradingview.com/j/jSa0Eb0S_mid.png)


![BTC Price Deviation % and Tether price (BPD) [cI8DH] BTCUSD: BTC Price Deviation % and Tether price (BPD) [cI8DH]](https://s3.tradingview.com/6/6SCbeqKQ_mid.png)

