Asset vs Total Market Cap & Relative Strength Purpose
This indicator allows traders to compare a selected asset to the major market benchmarks:
BTC – primary crypto market leader
ETH – secondary crypto market leader
USDT.D – shows market risk-on vs risk-off sentiment
TOTAL – total crypto market capitalization, useful for overall market trends
It also provides relative strength calculations:
Rel. Strength = Asset % change - USDT.D % change
Rel. Strength vs Total = Asset % change - Total % change
This allows you to see if your asset is outperforming or underperforming broader benchmarks.
The table covers multiple timeframes, making it easy to scan both short-term and longer-term trends:
Row Timeframe
0 Current
1 15m
2 1H
3 4H
4 1D
Selected Asset / BTC / ETH:
Green for positive % change
Red for negative % change
Gradient intensity proportional to magnitude (maxAbsChange input)
USDT.D:
Orange if rising (risk-off)
Teal if falling (risk-on)
Total Market Cap / Rel. Strength:
Gradient reflects asset performance relative to total market, independent of USDT.D.
Positives
Compact dashboard: Everything is in one table for quick scanning.
Multi-timeframe comparison: Traders can instantly see short-term vs long-term strength.
Relative performance visualization: Gradients immediately highlight outperformers and underperformers.
Benchmark comparisons: Asset vs BTC, ETH, USDT.D, and Total Market Cap.
Independent Rel. Strength: Highlights whether the asset is outperforming even if the total market moves.
Customizable gradient sensitivity: maxAbsChange and maxRelChange allow tuning how “strong” the colors appear.
Chart plotting: Rel. Strength vs total market is plotted for further visual reference.
How to Use
Green table cells → strong positive movement
Red table cells → negative movement
Rel. Strength > 0 → asset outperforming
Rel. Strength < 0 → asset underperforming
Use table to compare relative performance vs BTC, ETH, and total market for informed trading decisions.
Usdt

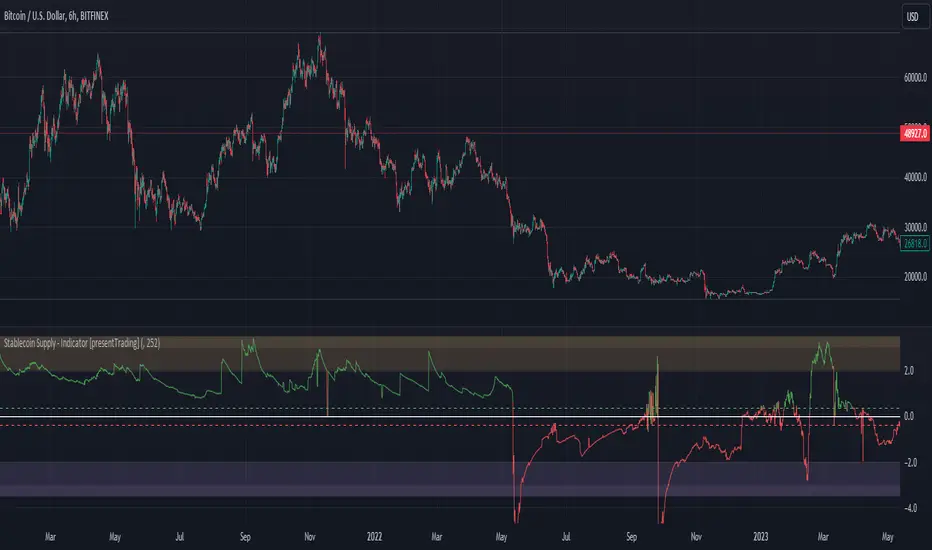
Crypto Stablecoin Supply - Indicator [presentTrading]█ Introduction and How it is Different
The "Stablecoin Supply - Indicator" differentiates itself by focusing on the aggregate supply of major stablecoins—USDT, USDC, and DAI—rather than traditional price-based metrics. Its premise is that fluctuations in the total supply of these stablecoins can serve as leading indicators for broader market movements, offering traders a unique vantage point to anticipate shifts in market sentiment.
BTCUSD 6h for recent bull market
BTCUSD 8h
█ Strategy, How it Works: Detailed Explanation
🔶 Data Collection
The strategy begins with the collection of the closing supply for USDT, USDC, and DAI stablecoins. This data is fetched using a specified timeframe (**`tfInput`**), allowing for flexibility in analysis periods.
🔶 Supply Calculation
The individual supplies of USDT, USDC, and DAI are then aggregated to determine the total stablecoin supply within the market at any given time. This combined figure serves as the foundation for the subsequent statistical analysis.
🔶 Z-Score Computation
The heart of the indicator's strategy lies in the computation of the Z-Score, which is a statistical measure used to identify how far a data point is from the mean, relative to the standard deviation. The formula for the Z-Score is:
Z = (X - μ) / σ
Where:
- Z is the Z-Score
- X is the current total stablecoin supply (TotalStablecoinClose)
- μ (mu) is the mean of the total stablecoin supply over a specified length (len)
- σ (sigma) is the standard deviation of the total stablecoin supply over the same length
A moving average of the Z-Score (**`zScore_ma`**) is calculated over a short period (defaulted to 3) to smooth out the volatility and provide a clearer signal.
🔶 Signal Interpretation
The Z-Score itself is plotted, with its color indicating its relation to a defined threshold (0.382), serving as a direct visual cue for market sentiment. Zones are also highlighted to show when the Z-Score is within certain extreme ranges, suggesting overbought or oversold conditions.
Bull -> Bear
█ Trade Direction
- **Entry Threshold**: A Z-Score crossing above 0.382 suggests an increase in stablecoin supply relative to its historical average, potentially indicating bullish market sentiment or incoming capital flow into cryptocurrencies.
- **Exit Threshold**: Conversely, a Z-Score dropping below -0.382 may signal a reduction in stablecoin supply, hinting at bearish sentiment or capital withdrawal.
█ Usage
Traders can leverage the "Stablecoin Supply - Indicator" to gain insights into the underlying market dynamics that are not immediately apparent through price analysis alone. It is particularly useful for identifying potential shifts in market sentiment before they are reflected in price movements. By integrating this indicator with other technical analysis tools, traders can develop a more rounded and informed trading strategy.
█ Default Settings
- Timeframe Input (`tfInput`): Allows users to specify the timeframe for data collection, adding flexibility to the analysis.
- Z-Score Length (`len`): Set to 252 by default, representing the period over which the mean and standard deviation of the stablecoin supply are calculated.
- Color Coding: Uses distinct colors (green for bullish, red for bearish) to indicate the Z-Score's position relative to its thresholds, enhancing visual clarity.
- Extreme Range Fill: Highlights areas between defined high and low Z-Score thresholds with distinct colors to indicate potential overbought or oversold conditions.
By integrating considerations of stablecoin supply into the analytical framework, the "Stablecoin Supply - Indicator" offers a novel perspective on cryptocurrency market dynamics, enabling traders to make more nuanced and informed decisions.
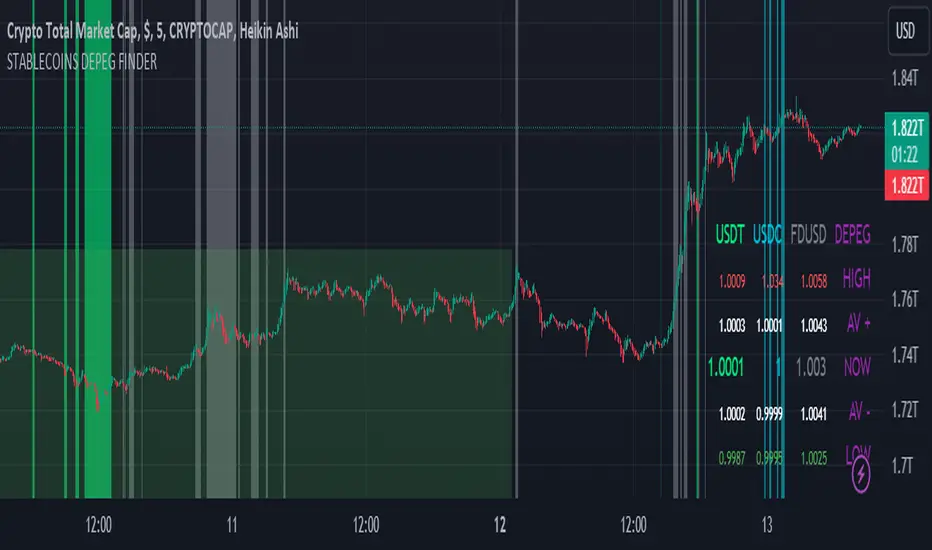
STABLECOINS DEPEG FINDERSTABLECOINS DEPEG FINDER
With this script, you will be able to understand how DePeg in stablecoins USDT, USDC, and FDUSD can influence the TOTAL Market Cap.
WHAT IS DEPEG?
DePeg occurs when a stablecoin loses its peg. It can't maintain the $1.00 price for a while (or anymore). Traders can use DePeg for high-quality trading both in Crypto and Stablecoins. Usually, a Negative DePeg (e.g., 0.98%) means you can buy Stablecoins at a 2% discount. This translates to a 2% gain when the Stablecoin returns to its peg. Additionally, a Positive DePeg could be a good moment for selling or withdrawal.
WHY DEPEG MATTERS IN THE CRYPTO SPACE
Depeg in Crypto markets is primarily a matter of "earning from small differences in peg." If well understood, it can help traders and analysts to spot whales' next moves. Usually, when a negative DePeg (below $1) occurs, it means whales are in a hurry to sell their Stablecoin tokens for Crypto Tokens. In this hurry, they sell Stablecoins at a discount. In the short term, a Crypto pump is likely planned, and they buy the next x100 token.
On the other hand, a positive DePeg (above $1) means whales are in a hurry to convert tokens into Stablecoins because they are heavily selling Crypto Tokens. This leads to them paying more for Stablecoins. Positive Depeg is more interesting than Negative DePeg. Usually, it signifies an important sell-off in the crypto environment, creating high tension to safeguard your hard-earned money. Whales hurry to convert altcoins and tokens into stablecoins, causing a Positive Depeg (they are willing to pay more to be safe). Positive DePeg is plotted as Intense Background Color.
Identifying 'areas' where this occurs could help traders and analysts understand this highly manipulative market better and take positions.
THE SCRIPT
This script will help traders and analysts understand when USDT, USDC, and FDUSD depegged and how the crypto market reacted. It comes with the possibility to check and plot backgrounds when there's Positive DePeg or Negative DePeg for USDT, USDC, or FDUSD.
It's pretty useful for data analysis. In the bottom-right part, you can check the actual stablecoin peg for the three Stablecoins:
- Highest Positive DePeg in a given BackTrace
- Average Positive DePeg in a given BackTrace
- Actual Peg for USDT, USDC, FDUSD
- Average Negative DePeg in a given BackTrace
- Lowest Negative DePeg in a given BackTrace
UNDERSTANDING THE BACKGROUND PLOT
NEGATIVE DEPEG
For each Stablecoin, negative DePeg is plotted as Translucent Background Color: USDT lime, USDC aqua, FDUSD grey. You can choose from settings whether it needs to be enabled or disabled for each token.
POSITIVE DEPEG
For each Stablecoin, positive DePeg is plotted as Intense Background Color: USDT lime, USDC aqua, FDUSD grey. You can choose from settings whether it needs to be enabled or disabled for each token.
USE CASE EXAMPLES
With this script you can plan to be alerted WHEN one of those stablecoin are depegging over a threesold. Than you can act accordingly.
BUY OPPORTUNITY
Let' suppose you want to see how USDC can influence Crypto Price when deppeged
I've setup signal to be plotted only for negative Depeg when USDC goes below 0.998. As you can see it was a very good and nice buy area for the entire crypto market
SELL OPPORTUNITY
Spot a selling point could be harder. In the example below let's see how USDC positive DePeg can show signal of Crypto dump earlier in daily TF
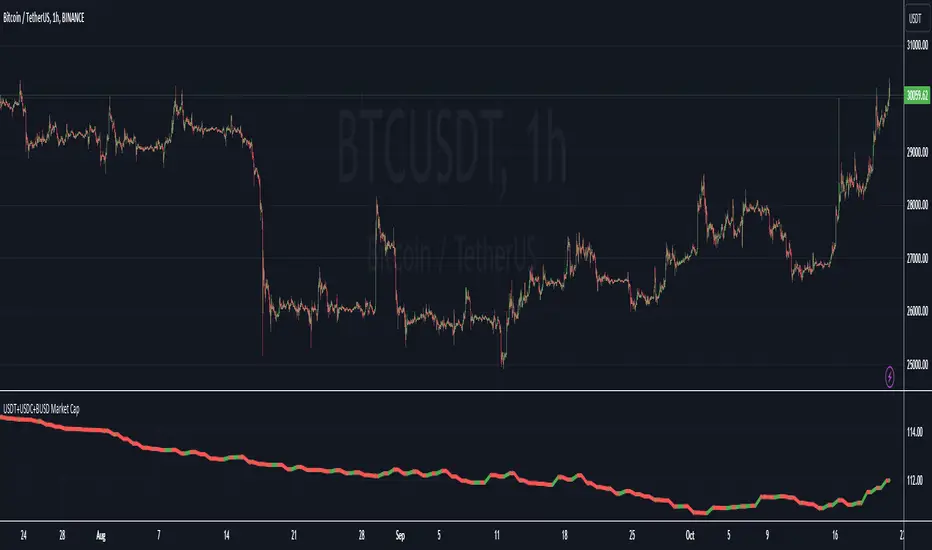
USDT+USDC+BUSD Market CapThis Pine Script indicator visualizes the combined market capitalization of three prominent stablecoins: USDT, USDC, and BUSD, on a daily basis.
It fetches the daily closing market caps of these stablecoins and sums them. The resulting line graph is displayed in its own separate pane below the main price chart.
The line is color-coded: green on days when the market cap is increasing compared to the previous day, and red when it's decreasing.
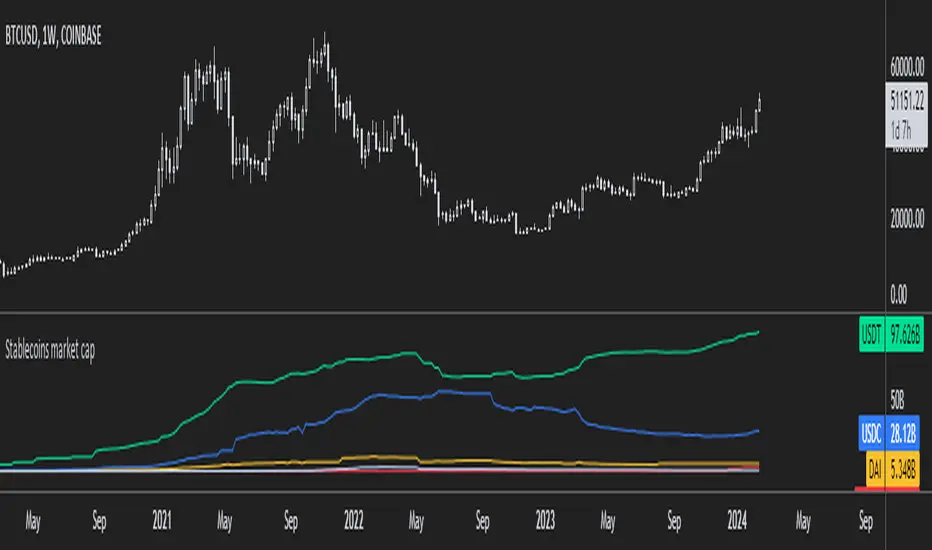
Stablecoins market capA simple indicator that displays either the aggregated market cap of the top five stablecoins, or it displays all coins at once (look in the settings).
Because of limitations with the sourced data the indicator only works on the daily timeframe or higher.
Fierytrading: Volatility DepthDear Tradingview community,
I'd like to share one of my staple indicators with you. The volatility depth indicator calculates the volatility over a 7-day period and plots it on your chart.
This indicator only works for the DAILY chart on BTC/USD.
Colors
I've color coded the indicator as follows:
- Red: Extreme Volatility
- Orange: High Volatility
- Yellow: Normal Volatility
- Green: Low Volatility
Red: extreme changes in price. Often during local tops and bottoms.
Orange: higher than average moves in price. Often before or after a "red" period. Often seen in the middle of bear or bull markets.
Yellow: normal price action. Often seen during early stage bull-markets and late stage bear-markets.
Green: very low price movement. Often during times of indecision. Once this indicator becomes green, you can expect a big move in either direction. Low volatility is always followed by high volatility.
In a long-term uptrend, a green period often signals a bullish break out. In a long-term downtrend it often signals a bearish break out.
How to use
Save the indicator and apply it to your chart. You can change the length in the settings, but it's optimized for 7 days, so no need to change it.
I've build in alerts for all 4 different volatility periods. In most cases, the low volatility alert is enough.
Good luck!

USDT Inflow TrackerUSDT INFLOW TRACKER
What does this script do? It looks for important inflow from USDT and write it below or above your chart.
Does it matter? Yes because Tether with planned USDT inflow highly manipulate the crypto market.
With this simple script you can study what and when something strange is going to happen on your favourite token.
HOW IT WORKS?
Pretty simple. It just continuosly check USDT (and USDC) Market Cap and verify if the last candle is way higher than last one. If it was way higher than expected it plot a green square and write a note with the total Inflow of USDT in the crypto market (not specifcially for your token)
Now you can see when an important inflow is done and start to plan your entry and exit strategy in the crypto market.
AUTOSET
With Autoset you can rely on standard values
5min TF : Inflow greater than of 15 mln (in 1 candle)
30min TF : Inflow greater than of 150 mln (in 1 candle)
60min TF : Inflow greater than of 300 mln (in 1 candle)
1Day TF : Inflow greater than of 900 mln (in 1 candle)
So you can check your favourite coin in no time looking for a good trading position
MANUAL SETTINGS
Otherwise you can set directly your Inflow to track based on your needs.
In the example below I've set to check everytime an Inflow of 25mln USDT or greater was done.
As you can see it highly influence the relative token.

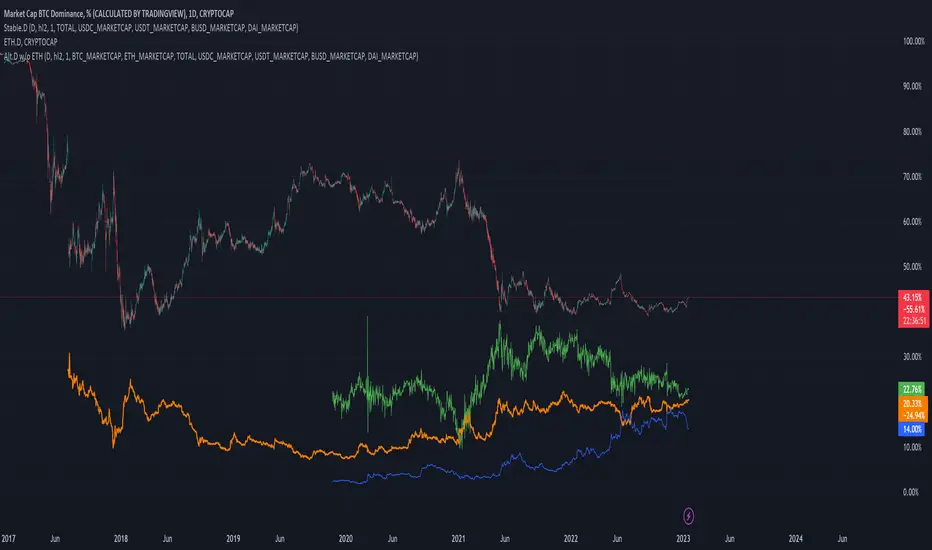
Stablecoins DominanceStablecoins Dominance
The purpose of the script is to show Stablecoin's strength in the crypto markets.
5 Largest Stablecoins divided by Total Market Cap
Crypto Map Dashboard v1.0🔰Overview
Charts are an essential part of working with data, as they are a way to condense large amounts of data into an easy to understand format. Visualizations of data can bring out insights to someone looking at the data for the first time, as well as convey findings to others who won’t see the raw data. There are countless chart types out there, each with different use cases. Often, the most difficult part of creating a data visualization is figuring out which chart type is best for the task at hand.
What are the types of metrics, features, or other variables that you plan on plotting? Although it depended on some multiple factors!
But my choices of the chart type for this Crypto datas was Pie chart or Donut char for crypto dominances ,and Colum (Bar) chart for Total MarketCaps .
The audiences that I plan on presenting this for them could be all tradingviewrs , especially crypto lovers ,or those who just aim to have an initial exploration for themselves ,like me!
so this indicator mostly could be an educational indicator script for pine coders !
We can use the " Crypto Map Dashboard " indicator to Get an quick overview of the crypto market and monitor where the smart money Flow changing by comparing the dominances and totals Caps .
In general, it consists of 4 parts:
✅1 =>> Table1 : If you like to see and compare and monitor the changes of dominances of (Bitcoin, Ethereum, Usdt , Usdc , etc.) and their market cap in different times you can see the table on The upper-right corner.
✅2 =>> Table2: Also, in the table lower-right corner, you can see the changes of the totals(Total, Total2 , Total3 and TotalDefi) in the same time periods.
✅3 =>> pie chart or donut chart: By viewing this , you understand better about Table1 Datas, that it depicts exactly how Dominance is distributed and specialized.
✅4 =>> column chart (bar chart) : And in the last you can clearly compare the total marketcaps and see how far they are from their ATHs.
You also can even notice the entry and exit of liquidity from the crypto market!
I must also mention that I am definitely still a beginner compared to more experienced pine coders, and there may be some bugs in my codes and calculations, but I am an open person and I welcome your comments ,Also Let me know if you have any questions.
Lots of Love to all tradingviewers and pineCoder ,Cheers!💚❤️💙

KINSKI USDT Market Cap DominanceUSDT dominance charts are rare to find as almost everyone is fixated on BTC dominance. Bitcoin dominance gives us insight into investors' preferences when they have a choice between BTC and thousands of altcoins.
This oscillator gives insight into the state of the coin market. When people exchange their digital currencies like BTC and Altcoins for USDT, there is low confidence in the market. The opposite is true when BTC and Altcoins are bought because market sentiment is high.
So when USDT dominance rises, cryptocurrency prices fall, but when their dominance falls, cryptocurrency prices rise.
Features
Can be displayed as a moving average (default) or histogram.
Choice between 'CRYPTOCAP:USDT', 'CRYPTOCAP:USDT.D', 'CRYPTOCAP:OTHERS.D' => CRYPTOCAP:USDT.D is default.
Smoothing types Selectable
Upward and downward trend of MA line can be activated
Extensive style settings

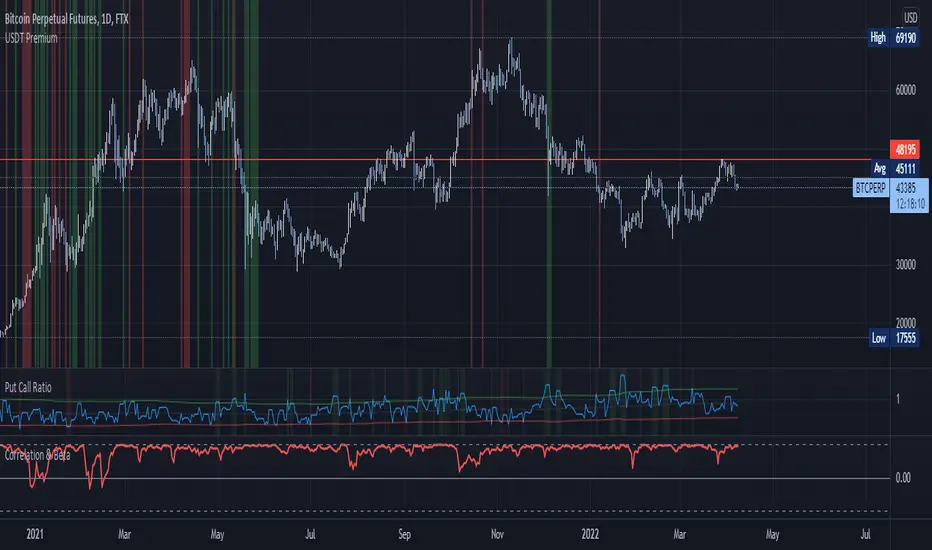
USDT/USD PremiumKraken + FTX USDT premium indicator.
Inspired by John J Brown, forked from IAmSatoshi (Migrated to V5 and few changes + more markets coming).
John J Brown: "
USDt premium/discount exist because of conversion fees.
It is a good market indicator:
If USDt>USD, then market is growing and in need of liquidity;
If USDt
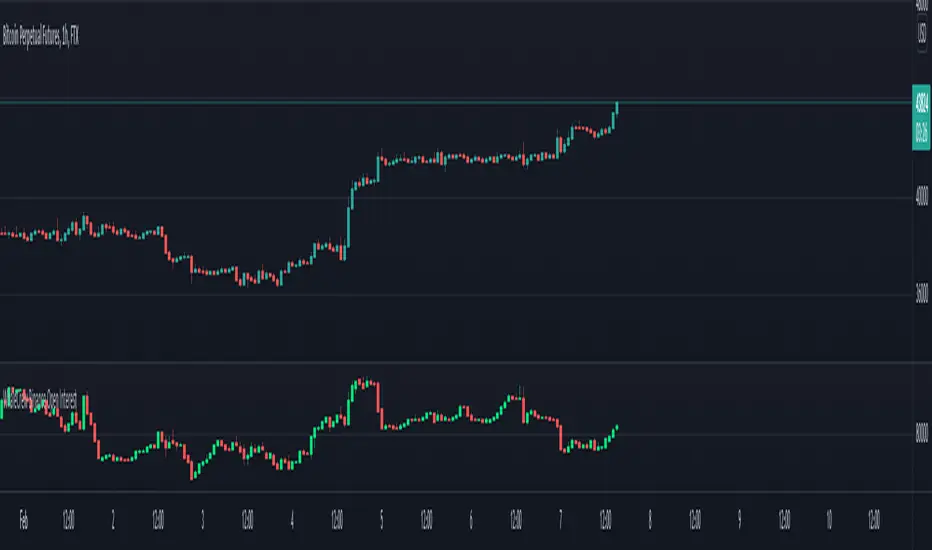
WhaleCrew Crypto Open InterestUse Crypto Open Interest Data available on TradingView to your advantage.
Features
Auto-Detect Symbol (based on chart)
Preset Symbols (BTC, ETH, BNB, XRP, LUNA, ADA, SOL, AVAX and DOT)
Exchanges ( Binance and BitMex )
Inverse and USDT Pairs
Override Data Option to use any OI Data on TradingView
Customizable Candles

WhaleCrew Binance Open InterestShows Open Interest of ANY Binance pair (BTCUSD, ETHUSD, ADAUSD, ...).
Inverse and USDT pairs
Preset-Pairs (BTC, ETH, XRP, ADA, SOL, DOT, ...)
Custom Candle Colors (candles can be turned off)
SSR - Stablecoin Supply Ratio - Bitcoin - CryptocurrencyThe Stablecoin Supply Ratio (SSR) is the ratio between Bitcoin supply and the supply of stablecoins, denominated in BTC.
When the SSR is low, the current stablecoin supply has more "buying power" to purchase BTC. It serves as a proxy for the supply/demand mechanics between BTC and USD.

Tether DataCONCEPT
A toolkit with a bunch of different metrics for the widely used stablecoin called tether (USDT).
It's very easy to use, just select in the settings what data you want to look at.
FEATURES
Value index.
The "index" setting shows a volume weighted index of different exchanges to give the most accurate average USDT/USD price.
Market cap.
Very straight forward. This shows you the current tether market cap.
Market cap changes.
This gives you a better visualization of increases (or sometimes decreases) in the tether market cap.
Dominance
This shows tether dominance in the market, same concept as bitcoin dominance.
It compares the USDT mcap to the total crypto mcap and then shows the dominance percentage wise.
It's considered bearish when USDT dominance goes up because it means people want to get out of coins and flee to something more stable.
BTC buying power.
This compares the tether market cap and compares it to the bitcoin market cap to give you an idea of how much BTC buying power has in theory.
The higher this ratio the more bitcoin could be bought with all the tether available.
You'll notice that this often looks very similar to the dominance metric.
Exchanges.
The tether price of multiple exchanges.
In the settings you can select which ones you want the indicator to show.
TRADING
I can't tell you exactly how useful this indicator is for trading, I don't have strong opinions on it.
Some people think a high tether price and dominance is bearish.
Some think the market cap increasing (because of new prints) is bullish.
The buying power metric can give you an idea of how much dry powder there is in the market.
The exchanges metric shows you where you can get the cheapest USDT...
Just some ideas.
This indicator is free so if you add it to your favourites you can start using it immediately (it's possible that you have to refresh Tradingview before it actually works).
Source code is visible for learning purposes.
Cheers.
Statistical and Financial MetricsGood morning traders!
This time I want to share with you a little script that, thanks to the use of arrays, allows you to have interesting statistical and financial insights taken from the symbol on chart and compared to those of another symbol you desire (in this case the metrics taken from the perpetual future ETHUSDT are compared to those taken from the perpetual future BTCUSDT, used as a proxy for the direction of cryptocurrency market)
By enabling "prevent repainting", the data retrieved from the compared symbol won't be on real time but they will static since they will belong to the previous closed candle
Here are the metrics you can have by storing data from a variable period of candles (by default 51):
✓ Variance (of the symbol on chart in GREEN; of the compared symbol in WHITE)
✓ Standard Deviation (of the symbol on chart in OLIVE; of the compared symbol in SILVER)
✓ Yelds (of the symbol on chart in LIME; of the compared symbol in GRAY) → yelds are referred to the previous close, so they would be calculated as the the difference between the current close and the previous one all divided by the previous close
✓ Covariance of the two datasets (in BLUE)
✓ Correlation coefficient of the two datasets (in AQUA)
✓ β (in RED) → this insight is calculated in three alternative ways for educational purpose (don't worry, the output would be the same).
WHAT IS BETA (β)?
The BETA of an asset can be interpretated as the representation (in relative terms) of the systematic risk of an asset: in other terms, it allows you to understand how big is the risk (not eliminable with portfolio diversification) of an asset based on the volatilty of its yelds.
We say that this representation is made in relative terms since it is expressed according to the market portfolio: this portfolio is hypothetically the portfolio which maximizes the diversification effects in order to kill all the specific risk of that portfolio; in this way the standard deviation calculated from the yelds of this portfolio will represent just the not-eliminable risk (the systematic risk), without including the eliminable risk (the specific risk).
The BETA of an asset is calculated as the volatilty of this asset around the volatilty of the market portfolio: being more precise, it is the covariance between the yelds of the current asset and those of the market portfolio all divided by the variance of the yelds of market portfolio.
Covariance is calculated as the product between correlation coefficient, standard deviation of the first dataset and standard deviation of the second asset.
So, as the correlation coefficient and the standard deviation of the yelds of our asset increase (it means that the yelds of our asset are very similiar to those of th market portfolio in terms of sign and intensity and that the volatility of these yelds is quite high), the value of BETA increases as well
According to the Capital Asset Pricing Model (CAPM) promoted by William Sharpe (the guy of the "Sharpe Ratio") and Harry Markowitz, in efficient markets the yeld of an asset can be calculated as the sum between the risk-free interest rate and the risk premium. The risk premium of the specific asset would be the risk premium of the market portfolio multiplied with the value of beta. It is simple: if the volatility of the yelds of an asset around the yelds of market protfolio are particularly high, investors would ask for a higher risk premium that would be translated in a higher yeld.
In this way the expected yeld of an asset would be calculated from the linear expression of the "Security Market Line": r_i = r_f + β*(r_m-r_f)
where:
r_i = expected yeld of the asset
r_f = risk free interest rate
β = beta
r_m = yeld of market portfolio
I know that considering Bitcoin as a proxy of the market portfolio involved in the calculation of Beta would be an inaccuracy since it doesn't have the property of maximum diversification (since it is a single asset), but there's no doubt that it's tying the prices of altcoins (upward and downward) thanks to the relevance of its dominance in the capitalization of cryptocurrency market. So, in the lack of a good index of cryptocurrencies (as the FTSE MIB for the italian stock market), and as long the dominance of Bitcoin will persist with this intensity, we can use Bitcoin as a proxy of the market portfolio

Crypto Total Market Cap, Exclude Tether, (USD)Total cryptocurrency market capitalization without tether, with alerts for chosen value thresholds.
The rationale is that tether is a printed supply stablecoin with a fixed value; there is no need to include its value in a combined market cap. It's debatable if that's true, but that doesn't explain what this indicator is.
The second part of this indicator is highlighting when the aforementioned adjusted market cap is above or below certain values. They are round numbers; a psychological factor. A psyop, if you will.
Options to configure are the lower and upper bound and colors. The alerts must be manually turned on, as usual.

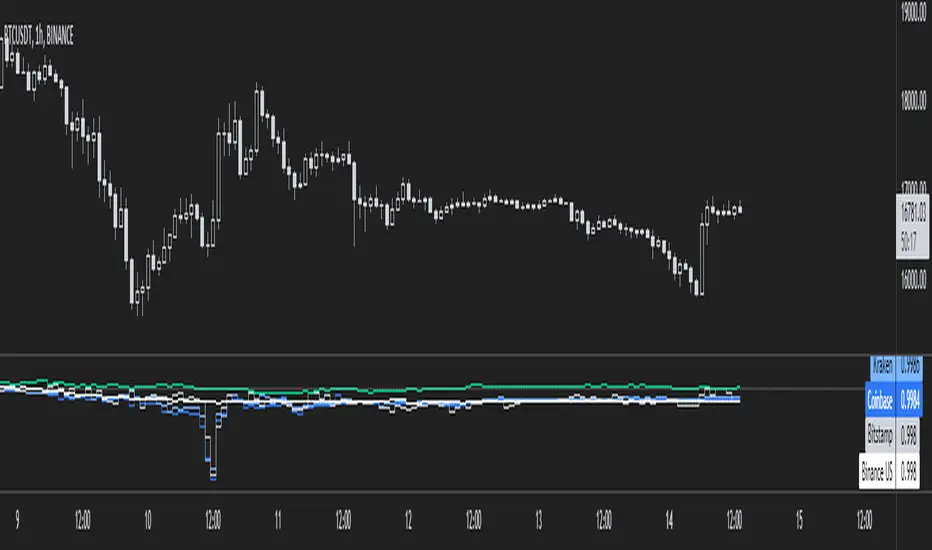
USDT PremiumThis is a simple script that aggregates the USDTUSD pairs available on TradingView and shows the average price of (USDTUSD - 1).
Heavy buying of BTC on USD exchanges (read: Coinbase) will result in a positive USDT premium
Heavy selling of BTC on USD exchanges (read: Coinbase) will result in a negative USDT premium
Heavy buying of BTC on USDT exchanges result in a negative USDT premium
Heavy selling of BTC on USDT exchanges will result in a positive USDT premium
Here is a quote about USDT premiums from Zhao Dong, one of China's largest OTC traders, from the article "Chinese Bitcoin Billionaire Argues USDT Premium is Caused by USD Inflow, Not Tether Inflation":
"So let me tell you a little bit about where the plus or minus premium for usdt comes from. Right
The biggest exchange in America is coinbase, which trades in dollars. In addition to coinbase, most exchanges with large trading volume are usdt trading. Since BTC and usdt can flow freely between exchanges, the price difference is very small.
Assuming that the market is stable, there is no difference between the prices of usd and usdt. Btcusd = btcusdt
At some point the market starts to recover, goes up, and the otc money starts to come into the market. Coinbase is a compliance exchange, so the usd deposit is very smooth, while the usd deposit through usdt needs to be converted into usdt first and then deposited into the exchange, so the usdt will be slightly delayed in price transmission, so the usd exchange price is higher than the usdt exchange price. If there is a lot of dollars to buy, coinbase goes up first and usdt goes up later.
At this point, the coinbase price is higher than the usdt exchange price. If btcusd>btcusdt, because BTC is free flowing, that means usdt is in a positive premium to usd.
This arbitrage space will prompt the brick moving party to sell BTC from coinbase to usd, and then use usd to buy usdt, thus facilitating the issuance of usdt.
A negative usdt premium would prompt Tether to take back the usdt and destroy it."
Includes an option for repainting -- default value is true, meaning the script will repaint the current bar.
False = Not Repainting = Value for the current bar is not repainted, but all past values are offset by 1 bar.
True = Repainting = Value for the current bar is repainted, but all past values are correct and not offset by 1 bar.
In both cases, all of the historical values are correct, it is just a matter of whether you prefer the current bar to be realistically painted and the historical bars offset by 1, or the current bar to be repainted and the historical data to match their respective price bars.
As explained by TradingView,`f_security()` is for coders who want to offer their users a repainting/no-repainting version of the HTF data.

CRYPTO Trend Direction Multiple EMA'sToday I bring an indicator specialized in crypto markets.
Its made of multiples EMA : very fast, fast, normal, slow, very slow
The logic behind its simple :
For long : we check that the EMA are in ascending order like EMA 5 > EMA 10 > EMA 20 .... and at the same time that last close of candle is above all of them.
For short : we check that the EMA are in descending order like EMA 5 < EMA 10 < EMA 20 .... and at the same time last close of candle is below all of them.
It can be used with all time frames.
Enjoy it !

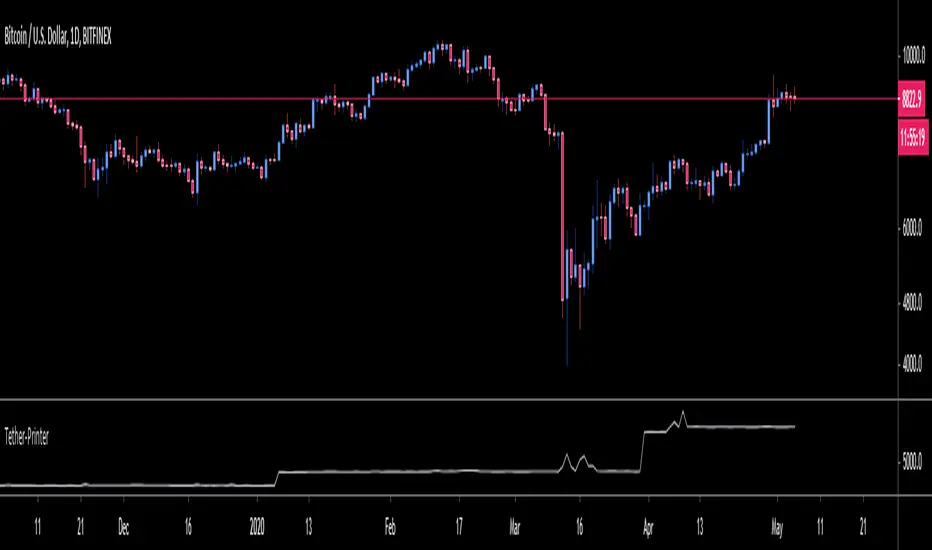
OneGeenCandle - Tether-Printer**************** OnegreenCandle - Tether Printer ************************
Shows the total market cap of USDT (US Dollar Tether) currency. Helpful for swing trading longer timeframes and indentifying new supply in the crypto market.
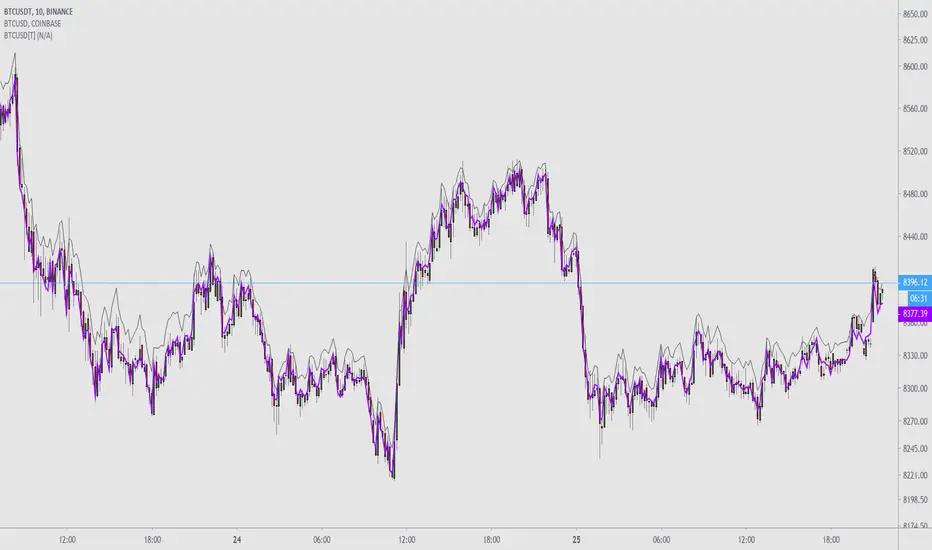
Binance BTCUSDT Tether AdjustedThis provides a Binance BTCUSDT ticker that is more aligned with spot exchange price.
There is an invisible line added to so it is possible to add indicators like MAs to it. It must be turned on in options to be used.
Possible usecases:
Add it to a Binance chart as a price source but keep real volume
To feel like you have an edge
For an more accurate and liquid representation of spot price
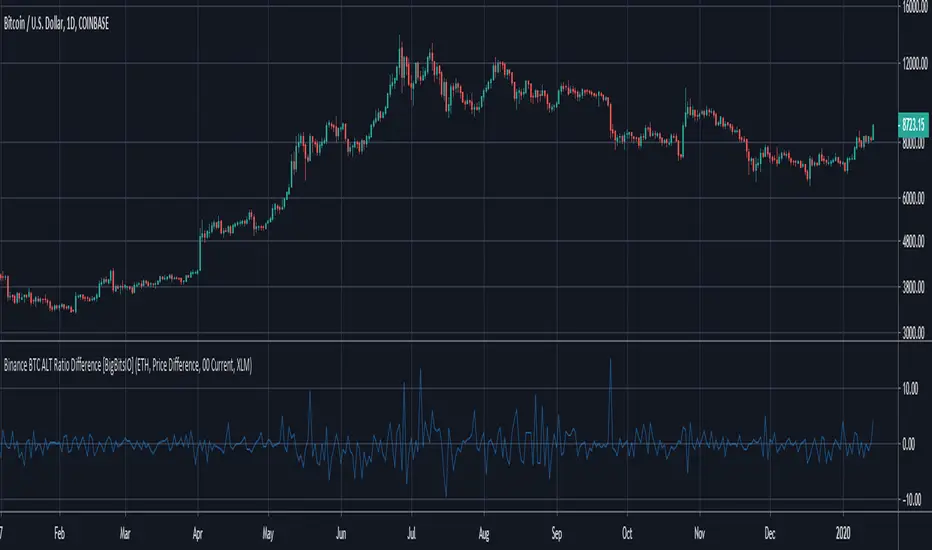
Binance BTC ALT Ratio Difference [BigBitsIO]This was a follower suggested script. This script compares the USDT and BTC relative prices of a particular altcoin traded on Binance by calculating it's USDT price comparative to BTC. This is a very simple calculation (ALT/USDT price divided by ALT/BTC price). From there, we simply subtract the BTC/USDT price from the ALT ration price and we can see if a coin is trading comparatively high or low compared to it's BTC relative price.
This indicator may or may not be useful for you. However, for the purposes of my development series for indicators, I have published it to highlight the ability to concatenate strings to manipulate securities.
Features:
- Dropdown to choose from several built-in altcoin selections.
- Dropdown to choose to show a USDT base difference in the ratio, or a percentage based difference (might be useful for considering fees).
- Dropdown to choose the resolution of the indicator.
- Checkbox to toggle the option to use a custom altcoin.
- Text input to allow entry of a custom altcoin from Binance. Please only use the prefix on its trading pair vs. BTC. I cannot guarantee this will work with all altcoins. They must be traded vs. USDT and BTC on Binance.
- Concatenated strings to manipulate selected securities.
*** DISCLAIMER: For educational and entertainment purposes only. Nothing in this content should be interpreted as financial advice or a recommendation to buy or sell any sort of security or investment including all types of crypto. DYOR, TYOB. ***
BTC Spot vs Tether Volumespot_volume / tether_volume
spot = Coinbase + bitFlyer + Kraken + Bitstamp
tether = Bitfinex + binance + Huobi + HitBTC
