[Strategy]Turtle's 20day High Low Break StrategyJapanese below / 日本語説明は下記
Overview
I have made this strategy mimicking the legendary traders group, Turtle’s 20days high low break strategy with more options available for take profit(TP) and stop loss(SL) conditions.
The main component of the strategy is same as my indicator, Previous N days/weeks/months high/low(see the link below) and with this strategy, you can backtest previous N days high/low break strategy.
Unlike the indicator, you can specify another previous N days high/low as TP condition. This is because Turtle used 10days low as TP condition for 20days high break buy strategy, according to articles/books about them.
ATR and other factors which is said to be used in their original strategy are not included in this strategy.
Previous N Days/Weeks/Months High Low
What is Turtle?
Turtle is the group of traders founded by Richard Dennis and William Eckhardt to prove their theory that good traders can be trained or not.
It is said that Turtle had made more than 175 million dollars over 5 years and some of the traders has become fund managers or successful individual traders even after the experiment.
What is this strategy like?
The strategy generates long entries once prices break previous N days highs and short entries when previous N days lows broken.
N is user input so you can adjust it for your own strategy.
As mentioned above, you can also specify another set of different previous N days high/low for TP conditions.
e.g. 55 days high(low) break for entry and 20days low(high) break for take profit condition.
How to use it?
What this strategy shows is almost same as the indicator, Previous N days/weeks/months high/low.
It displays previous N days/weeks/months highs and lows and you can set up entry condition based on previous N days high/low.
Previous N weeks/months highs/lows can be used as take profit points when you develop your own strategy based on this.
See the parameters below for the rest of the details.
Parameters
TP condition:
You can select from “Pips”, “When opposite entries” or “Previous high low break”.
When “When opposite entries” selected, the strategy exits the open positions when opposite directional entries happened. e.g. Long positions will be closed when short entries made.
If you would like to exit positions with specific previous N days highs/lows, you can enter N in Previous N days High/Low for TP field with “Previous high low break” selected.
SL condition:
You can select from “Pips” or “Swing High/Low”.
If “Swing High/Low” selected, left bars and right bars need input to determine swing high/low.
Note: If you select “pips” in TP/SL conditions, it currently works only for forex pairs.
What timeframe is the best for this strategy?
As this strategy is for swing trading, longer timeframes are the best.
Base on my quick check upon strategy’s performance over USD pairs in forex, daily timeframe works best, however, it could fit in with lower timeframes such as 4H and 1H by adjusting TP/SL conditions.
Look at the sample result below. The result shows the strategy’s performance for USDJPY for over 40 years on Daily timeframe and it performs fairly good with more than 2 profit factor over long period of time with up-trending equity curve.
It is just a simulation but the data shows Turtle’s strategy still works.
=================
概要
伝説のトレーダー集団タートルの20日高値・安値ブレイク手法を模倣して作成したストラテジーです。
利益確定や損切り条件を設定可能なようにして、より柔軟性を持たせています。
ストラテジーの主要な構造は過去にリリースしたインジケーターPrevious N days/weeks/months high/lowと同じです(下記リンク参照)。
このストラテジーを使うと、過去N日高値・安値のブレイク手法のバックテストを行うことが可能です。
また、前述のインジケーターとは異なり、このストラテジーでは利益確定条件のために、もう一つ別の過去N日高値・安値を設定することができます。これはタートルが20日高値のブレイクで買いエントリーを行う場合、10日安値ブレイクを手仕舞いの基準として使っていたことからです。
タートルのオリジナル手法ではATRやその他の要素も用いられていたようですが、このストラテジーには含まれていません。
Previous N Days/Weeks/Months High Low
タートルとは何か?
タートルとは、「優れたトレーダーは育成可能か?」の問いを証明するために、投資家リチャード・デニス氏とウィリアム・エックハート氏によって組織されたトレーダー集団です。
タートルは5年間に渡って1億7千5百万ドル以上を稼ぎ出したと言われており、この実験終了後にはヘッジファンドを運営する者や個人投資家として成功したトレーダーを輩出したことで知られています。
このストラテジーの特徴
このストラテジーは、価格が過去N日高値をブレイクした時にロングエントリーを、過去N日安値をブレイクした時にショートエントリーを実行します。
Nはパラメーターで指定可能なので、皆さんの独自の手法開発のために調整することができます。
また、前述の通り、利益確定条件としてエントリー条件とは別の過去N日高値・安値を指定することが可能です。
例:エントリーには55日の高値・安値のブレイクを用い、決済には20日高値・安値のブレイクを用いるなど。
使い方
このストラテジーは前述のインジケーターとほぼ同じ内容のラインを表示します。
過去N日、N週間、Nヶ月の高値・安値を表示でき、エントリーの条件として過去N日高値・安値を指定することができます。
過去N週・Nヶ月高値・安値ラインは利益確定の目安に用いるなど、皆さんが独自の手法を構築するときの参考として使ってください。
その他のパラメーターについては以下の詳細を参照ください。
パラメーター:
TP condition(利益確定条件):
“Pips(Pips指定)”, “When opposite entries(逆方向エントリー時)” or “Previous N days high low break(過去N日高値・安値)”から選択することができます。
“When opposite entries” を選択した場合、現在のポジションは、現在ポジションとは逆方向のエントリー条件が満たされた時に、決済されます。
例: ロングポジションはショートのエントリーが実行されると同時に決済される。
特定の過去N日高値・安値ブレイクを決済条件としたい場合は、“Previous N days high low break”を選択の上、該当するN日を”Previous N days High/Low for TP”の項目に入力してください。
SL condition(損切り基準):
“Pips(Pips指定)”、“Swing High/Low(スウィングハイ・ロー)”から選択することができます。
“Swing High/Low”選択時は、高値・安値決定に必要な左右のバーの本数を指定します。
注:TP、SL条件でPipsを選択した場合は、現時点では為替通貨ペアのみに機能します。
このストラテジーに最適の時間軸は?
当ストラテジーはスウィングトレードの手法となっているため、長期の時間軸が適しています。
為替のドルストレートペアでの結果を見てみると日足が最も適していますが、利益確定や損切り条件を調整することで、4時間足や1時間足向きにもアレンジできると思います。
上に示したストラテジーの例は、ドル円の日足における過去40年間以上でのバックテストの結果ですが、これだけの長期に渡って右上がりのエクイティカーブとともにプロフィットファクター2近くを維持するなど、かなり良い結果と言えるのではないでしょうか。
これは一つのシミュレーション結果に過ぎませんが、データを見る限りタートルの手法は現在でも機能すると言えるでしょう。
Turtle

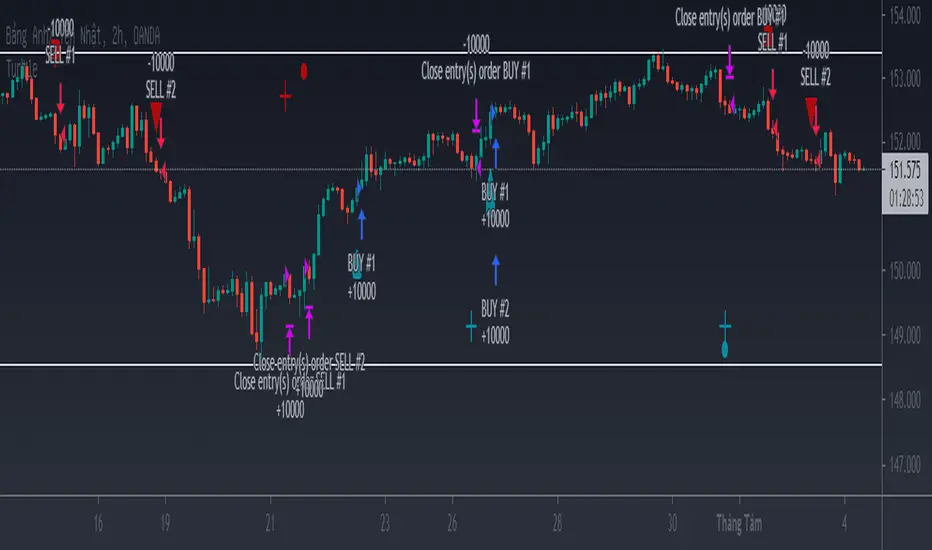
Turtle StrategyThe strategy uses the breakout method to enter an order. Look for areas of price compression to wait for a breakout. Use trailing stoploss to keep the order until the end of the trend.
Example using 10000 contract size with GBPJPY , slippage is 3 and commission per order is 0.3$, with actual capital of 10000$, you can adjust other contract size for other pairs to consistent with reality.
Donchian Channels Strategy - Long Term TrendFor Educational Purposes. Results can differ on different markets and can fail at any time. Profit is not guaranteed.
This only works in a few markets and in certain situations. Changing the settings can give better or worse results for other markets. This is a longer term trend following strategy that uses Donchian Channels for trend following and uses the upper and lower bands to find price breakouts to enter the market and then uses the middle band as a trailing stop to exit. DCs are known as the original trend following strategy made by Richard Donchian.
Usually the middle band uses the same length of the upper and lower bands in its calculation but I included the default option of using a middle band that is double the length of the other bands, but also an option to use the regular input length that most Donchian strategies use if needed. If long term trends are somehow found, this longer middle band lets the profits run longer and lets you see where the long trends were at if the market had any. The double lengthed middle band looks surprisingly very similar to a 3x ATR trailing stop, which is the recommended setting Wilder suggested for trend following. If a good ATR stop or other trailing stop can't be found, this longer middle band can act as a substitute for it.
For some reason I can't seem to find anything related to Donchian strategies on here despite the popularity and simplicity of it, not even a single working one to my liking, so I made my own. It seems this strategy only works in trending markets. I intentionally handpicked a market that the backtest does well on to illustrate the potential it might have for other markets where trending following strategies might work on and what to expect the results in those might be. Trend following strategies are said to have high profits but at the same time lower accuracy due to the failure rate of being able to catch the right trend. If you all got any suggestions or feedback please let me.


Turtle Strategy Short Sell VersionThis is a short-sell version of the strategy based on the famous turtle system.
www.tradingblox.com
In a nutshell, it a trend trading system where you are shorting on strength (in the downtrend), selling on
weakness (that it might be reversing).
positions should be entered when the price crosses under the 20-day low (S1 low) or 55-day low (S2 low).
positions should be exited when the prices crosses over the 10-day high (S1 high) or 20-day high (S2 high)
you can add positions at every unit (measured by multiple of n, where n=1 ATR)
stops should be placed at 2*n above every position entered, when the stop is hit exit your entire position.
positions should be entered everytime price crosses under S1 or S2, with one exception:
if the last trade was an S1 trade and it was a winning trade, skip the next trade unless the price crosses
under S2, if that is the case, you should take it.
S1 and S2 levels are also configurable for high and lows.
N multiple for stops and pyramid are also configurable
To change this from a strateg to a study:
1) uncomment the next line and comment out the strategy line.
2) at the end of the file comment out the last 2 lines
study(title="Turtle Study Short", overlay=true)

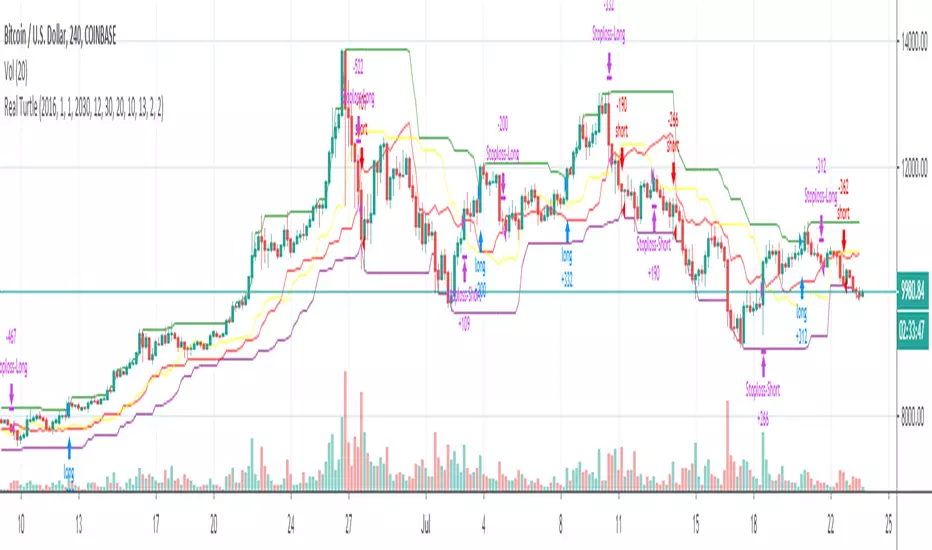
Real TurtleThere are a few different attempts at the turtle strategy on here, but none that I have seen thus far correctly follow the strategy as I know it. This version uses a stop order to trail out of the position by moving the stop order to match the exit channel or stoploss as the N*2( ema of True Range * 2). This version of turtle strategy also uses stop orders for entry on either side in order to enter at optimal time. The ability to specify a backtest period was borrowed from another script, I grabbed it so long ago I no longer remember from whom i borrowed it, if it was yours I will credit you if you PM me.
This version unlike others also allows you to specify a risk % so you only risk that percentage of your equity in a trade, as calculated from your stoploss.
Disclaimer: I have published several scripts in the past when i was first learning pinescript and they are all horrible please ignore those. I would delete them, but TV doesn't allow you to delete.
TMA Strategy v2.2This is a backtest of the TMA Indicator v2.2 using default parameters.
Backtest window: Jan 1, 2015 - Jul 21, 2019 (today)
For more information on the indicator and strategy seen here please take a look at this backtest:
For paper trading only. Do not use on real markets. Never make investment decisions based on this indicator alone.

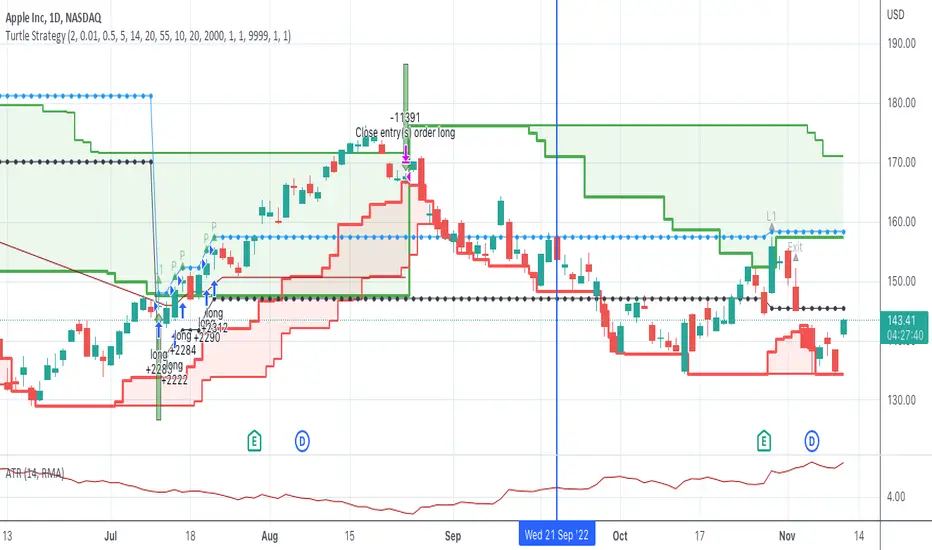
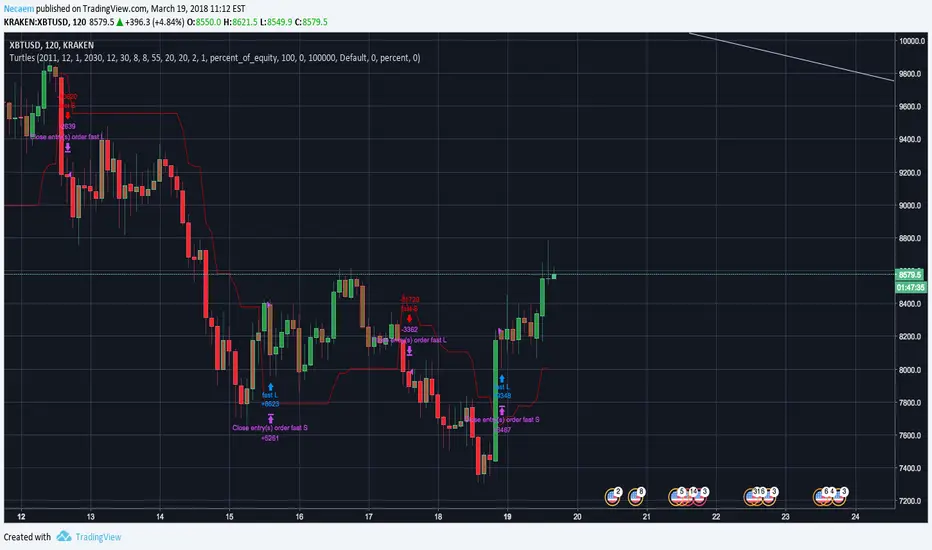
Turtle SystemFirst pinescript strategy I've ever written so still learning what is possible.
This strategy is based on the famous turtle system and tried to stay true
to the rules within the confines of what pinescript will allow me to do.
Features:
Green lines represents the 20/55 day highs (configurable)
Red lines represent the 10/20 day lows (configurable)
Purple line represents stop (defaults to 2N away configurable)
Pyramids up to 5 long positions (each 1N away configurable).
Arrows:
Up Arrow Green - 20 day long position entered
Up Arrow Purple - 55 day long position entered
Down Arrow Green - Winning trade exited out.
Down Arrow Red - Losing Trade either stopped out or exited out.
Code tracks successful wins as it is only allowed to enter positions if the last trade was not a wining trade.
One limitation, only supports Long trades although wouldn't be a lot of work to also make it support Short. NASDAQ:AAPL
Love to hear feedback on improvements, particularly to make it more robust.
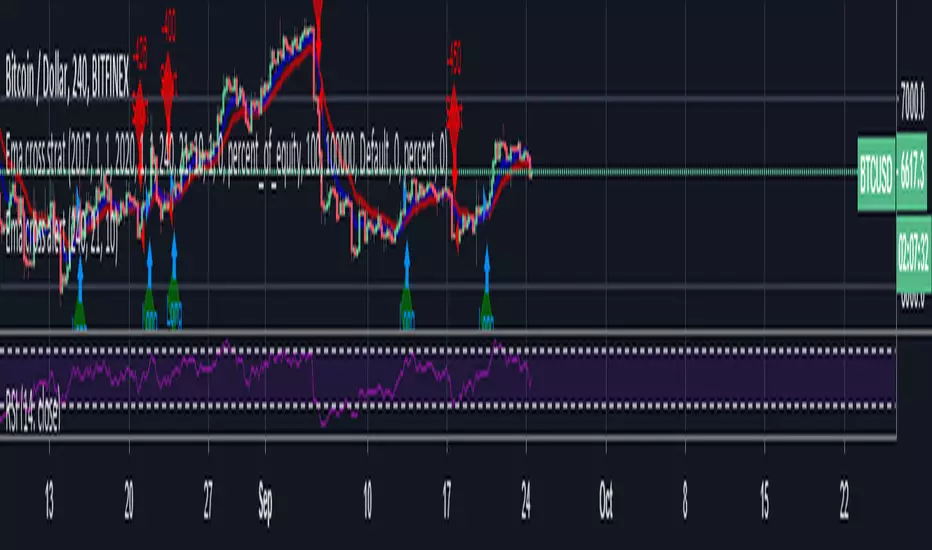
Ema cross strat / Turtle Trading This is just a simple EMA cross strategy which is meant to be similar to Turtle Trading Strategy.
It uses in default 4 Hour 21 / 10 EMA to long or short. This is not perfect but in the long run it will profit. Works best in bull market.
LINK TO ALERT :
Turtles + TrailingStopThis script is a merge between the Trailing stop from HPotter and the Turtle system from tmr0 and timchep
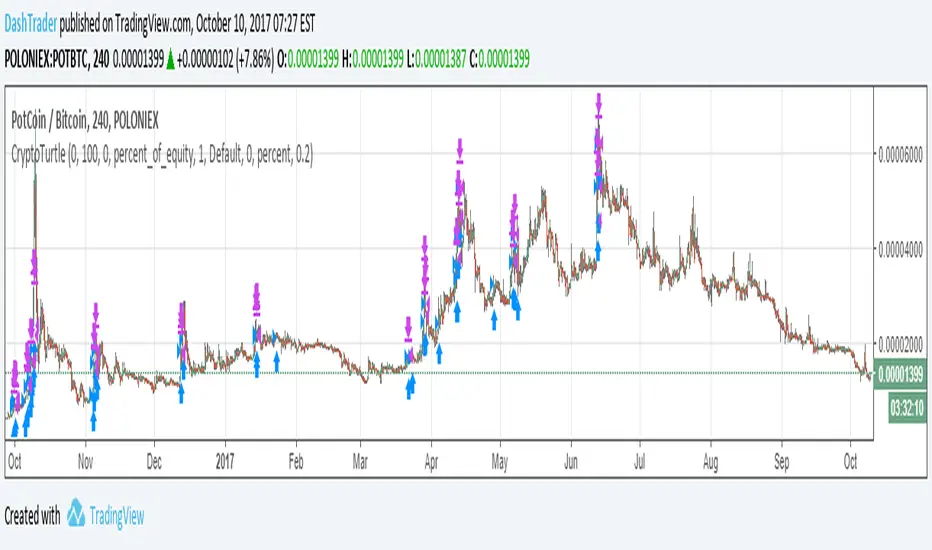
Crypto Turtle - Trend Following StrategyThis represents a bot I have written that uses a heavily modified version of the Turtle strategy for cryptocurrency trading. This is meant to be traded on the 4 Hour candlestick. This strategy doesn't 100% accurately reflect the bot due to limitations of pinescript. The actual bot enters on the signal much faster, detects bitcoin price rally and adjust its positions accordingly, follows all pairs traded on poloniex at once.
I am publishing this strategy here to gauge interest, and may list the bot on bitcointalk in the future for sale.