convolution
Description:
Convolution indicators aim to identify a major reversal in the price direction so that one can trade the market primarily in the direction of the ensuing trend, as described in the Cycle Analytics for Traders, by John F. Ehlers pg. 165. The notion is based on the concept of the two price segments are perfectly correlated (cross-correlated) that have been folded at the horizontal point, since high correlation exists only at the market turning point, e.g. price decreases linearly until the bottom is reached and then increases linearly after the bottom occurs and vice versa. The vertical scale is the lookback period, while the value is converted to colors.
Features:
High-pass filter and Smoothing function on the input data
Major reversals are identified by plumes pointing backward to the time of the price reversal
Bullish reversal identified by the green color of the indicator,
while Bearish reversal identified by a red color dominated the indicator
Turningpoint

Support and Resistance LevelsDetecting Support and Resistance Levels
Description:
Support & Resistance levels are essential for every trader to define the decision points of the markets. If you are long and the market falls below the previous support level, you most probably have got the wrong position and better exit.
This script uses the first and second deviation of a curve to find the turning points and extremes of the price curve.
The deviation of a curve is nothing else than the momentum of a curve (and inertia is another name for momentum). It defines the slope of the curve. If the slope of a curve is zero, you have found a local extreme. The curve will change from rising to falling or the other way round.
The second deviation, or the momentum of momentum, shows you the turning points of the first deviation. This is important, as at this point the original curve will switch from acceleration to break mode.
Using the logic laid out above the support&resistance indicator will show the turning points of the market in a timely manner. Depending on level of market-smoothing it will show the long term or short term turning points.
This script first calculates the first and second deviation of the smoothed market, and in a second step runs the turning point detection.
Style tags: Trend Following, Trend Analysis
Asset class: Equities, Futures, ETFs, Currencies and Commodities
Dataset: FX Minutes/Hours/Days
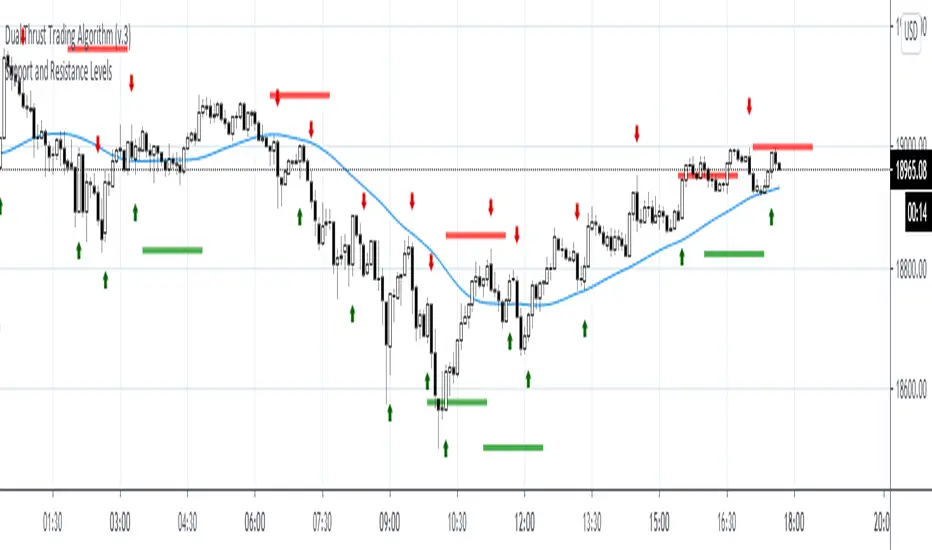
Support and Resistance Multi Time frameSimple indicator showing the support and resistance on Daily, Weekly and Monthly time frames no matter what time frame you're currently on by highlighting the highest and lowest points on each over the last 34 bars.
Daily support and resistance are coloured green.
support and resistance are coloured yellow.
Monthly support and resistance are coloured red.
For best results check where multiple support and resistance areas line up and combine with another indicator for example oscillators to gauge if the support or resistance will reverse the market.

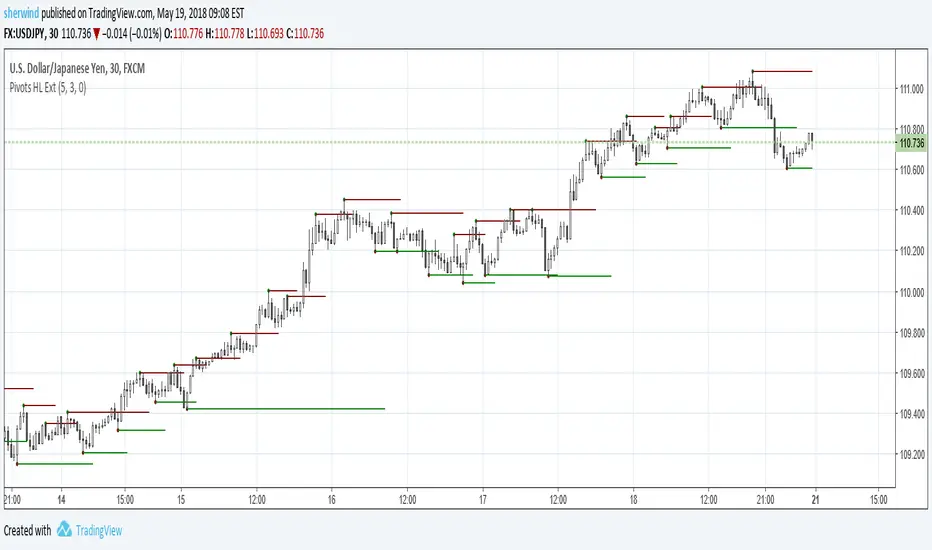
Pivot Points High Low ExtensionPivot Points High Low Extension
See Also:
- A Simple 1-2-3 Method for Trading Forex
- The Classic 1-2-3 Pattern: An Underestimated Powerhouse
- Bulkowski's 1-2-3 Trend Change