TTT_Crack_RSI_Ver_2.1.0Hello dear traders from all over the world!
It has been a while since our team started concentrating on the technical indicators that apply sources not only on the closed price but also on the high/low prices of the candlestick to overcome the limitations of existing indicators. As mentioned repeatedly before, most of widely adapted indicators in technical chart these days are generated only with the closed prices, not taking in consideration of the wicks or tails of the candlesticks. This crucially leads to a rapid decrease in the reliability especially in current financial market, where ignoring other portions within a candlestick structure and putting weights just on candle body often causes fatal trading outcome. Since phenomenons such as wide price fluctuation and non-ideal price momentum occur more frequently compared to the old days when TA used to perfectly work just as the images in a textbook, sourcing OHLC (Open, High, Low, Closed) prices from a candle structure is becoming more essential and practical.
Such revolutionary perceptions and insights could be easily acquired: by just adding high/low prices of the candlesticks when computing technical indicators, many more meaningful signals were observed. One of the popular indicators we have recently attempted to reflect this very idea was RSI (Relative Strength Index) that was published by the name of “RSI Cloud” months ago. As shown below, this groundbreaking index was to be comprehended as a band or a cloud rather than a single line. In fact, many unexpected methodologies, techniques, and insights were discovered through countless applications as our team went through series of experiments and back/forward tests. The results were quite shocking: Little did we know that drawing trendlines, parallel channels, and previous highs/lows etc. just like we do on the regular candlestick chart would also work decisively. Not only divergences were efficiently captured, but ‘SR Flip’ techniques also functioned as well.
Anyway, validation and verification process has been successful, ensuring that taking all of the candlestick into an account within the indicators provides much more meaningful signals than the indicators with ‘closed source’, the default setting. During thousands of our trials, we questioned to ourselves: If we are going to transform candlestick structure into an equation utilizing all of the prices, why don’t we just express the index with the same format, as another candlestick? The initial intention of the clouds or bands were to adapt the tails of the candle and to smooth them out. And this radical idea changed the whole game. By applying this candlestick format insights, even more significant signals were brought up on to the surface that surprised all of us.
Without a doubt, just like the cloud version, the candlestick version even works better when applying trendlines, pivots, channels, divergences and SR Flips, etc. As we were studying behaviors of the RSI candlestick indicator, a determinant and significant signal was detected that can be usefully referred to traders and this core element is why this update extremely so innovative. We spotted that the emergence of consecutive tails could be a valuable signal that could be weighted. Especially when the tails appeared in sequence in overbought and oversold zone, a strong preference of trend reversal was observed. It was only matter of time to search for the proper parameters and values that fits the market!
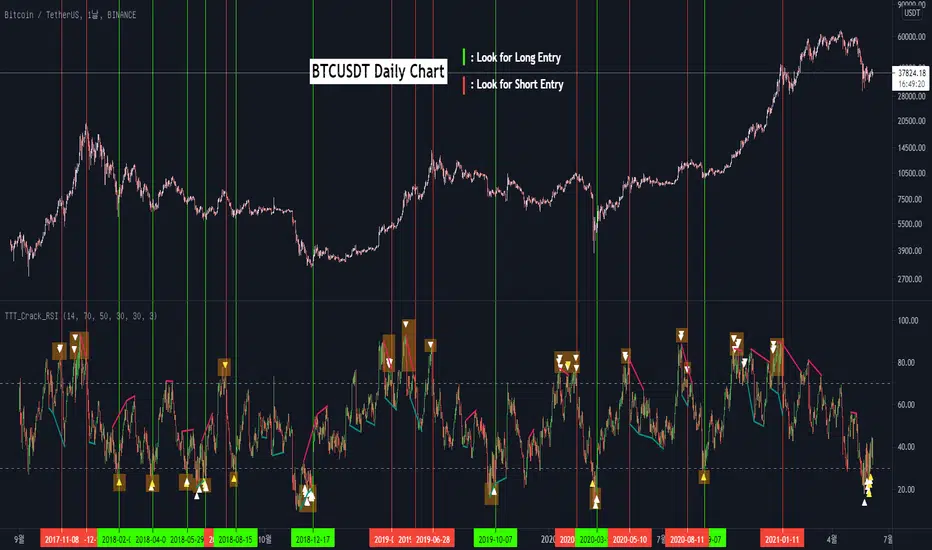
And here we are, presenting our newest indicator, “TTT_Crack_RSI_2.1.0” Just like the previous version, it catches regular and hidden divergences automatically and furthermore, we made it to detect appearance of sequential candle wicks in overbought/sold zone (70 and 30 as default) signaling some possibility of trend reversal. The default setting for the consecutive wick counting (Wick Count) is 4, meaning if candle wicks are formed (Top tail in the overbought zone and bottom tail in the oversold zone) four times in a row, a triangle will appear signaling potential trend reversal. As traders’ preferences, the settings can be customized. “Wick Length” setting let users to decide the minimum size of the wick that are to be considered as the proper criteria of candlestick wick. If one wishes to only imply candle wick that are longer than certain length, he or she can increase the “Wick Length” value. We recommend 30~40 for this parameter value. Moreover, if one wants the minimum number of consecutive wicks to that are to be counted to be greater or less, he or she can put in the minimum counting number value at “Wick Count”. For example, if more conservative trader wishes to consider minimum number of consecutive wicks as 6, then the logic will signal only if the wicks appear 6 times in a row in overbought/sold zone. Overbought and oversold zone can also be modified in the settings just like the regular RSI indicator.
How to effectively use this indicator to search for a decent entry point? First of all, do not just enter position only because a single signal has been appeared. The most reliable and strong entry sign would be when the trendline/channel breaks below/above at the overbought/sold zone and at the same time, consecutive wicks and divergence signals appear as well. If all of those signals have been observed, aim for the spot when RSI escape the overbought/sold zone. That would be a proper time to enter a position. As we emphasized many times, it is very reckless to make trading decisions only with technical indicator. It might defer a little bit depending on traders’ tendency, but indicators are to be considered as a side tool to identify macro level trends and signals of possible trend reversal. Always remember, traders that rely on TA must look for the confluent zone and thus the more technical factors that overlap price-wise and time-wise, the more reliability can be given.
If you wish to try our work, please comment below or send message to this account.
Thank you very much.
안녕하세요 트레이더 여러분. 토미 트레이딩 팀의 토미입니다.
최근 저희 개발팀은 캔들차트의 종가만으로 산출되는 기술적 지표들의 한계점을 극복하고자 캔들 고/저가까지 적용을 시켜 ‘요즘 장에 더 맞는’ 지표들을 만들기 위해 많은 노력을 해왔습니다. 저희 시장 분석/시황, 강의자료, 그리고 지표 개발 문서에서 누누이 언급 드렸듯, 근래 많은 트레이더 분들에게 널리 사용되고 있는 대부분의 지표들은 캔들의 종가만 고려하는 경우가 많습니다. 비상식적이고 두 눈으로 보고도 믿기지 않을 가격 모멘텀 및 변동성이 난무하는 요즘 21세기 금융시장에서는 예전처럼 교과서에나 볼 법한 뻔하고 예측 가능한 패턴 및 형국들을 찾아보기 힘들어졌습니다. 이렇게 급변하는 최근 시장 성향 상 기술적 분석에 캔들 꼬리를 배제하고 몸통만 고려하기에는 너무 치명적인 리스크가 뒤따라오기 마련입니다.
이런 궁극적인 목표로 개발에 착수한 저희 팀은 캔들의 OHLC(시, 고, 저, 종가)를 지표에 내포시켜 더 유의미한 신호들을 도출할 수 있다는 이론을 검증하였고 이를 반영해 몇 달 전 "RSI 클라우드"를 트레이딩뷰에 출시한 바 있습니다. 아래의 링크(이미지)에서 시사하는 바와 같이 RSI 역시 주가를 하나의 라인이 아닌 구조로 해석하여 밴드나 클라우드 형태로 표현해보니 실제로 더 높은 실용성과 활용성을 입증할 수 있었습니다. 또한 수많은 실험과 백/포워드 테스팅을 거치면서 사전에 전혀 예상치 못한 방법론 및 기법들을 응용시킬 수 있다는 사실까지 밝혀냈습니다. 일반 캔들 차트처럼 추세선, 평행채널, 피봇, 그리고 전 매물대 등의 작도법을 적용시킬 수 있을뿐더러 캔들의 종가가 아닌 고/저가를 활용해보니 더 효과적인 일반/히든 다이버전스 시그널을 찾아낼 수 있었습니다. 게다가 SR Flip (지지와 저항이 뚫리면 바뀌는 현상) 이론마저 잘 먹히는 현상을 인지한 저희는 개발 방향을 이쪽으로 더 깊고 세밀하게 발전시키는 쪽으로 잡았습니다.
여러 시행착오를 통해 이것저것 될 만한 건 다 시도해보던 와중, 저희는 어느 날 문득 이런 질문을 던지게 됩니다. ‘어차피 이왕 캔들의 OHLC 값을 지표화 시키는 거 차라리 지표마저 동일하게 캔들화시키는 게 낫지 않을까?’ 결과는 매우 충격적이면서도 동시에 저희에게 허탈감을 안겨줬습니다. 곰곰이 생각해보니 클라우드/밴드 형태의 지표는 적용시킨 캔들의 고/저가를 일련의 Smoothing out 프로세싱 작업을 입힌 거고 그럴 바엔 오히려 동일한 캔들 형태로 표현해버리면 더 직관적인 경향성과 규칙성을 파악할 수 있을 거란 저희의 예상은 적중했습니다. 클라우드/밴드 지표 형식의 모든 차별성과 장점은 그대로 유지하고 심지어 더 유의미한 신호들을 포착할 수 있었습니다.
해당 산출물에 추세선, 평행채널, 피봇, 전 매물대, 그리고 SR FLIP과 같은 작도법과 다이버전스 시그널 등을 더 세밀하고 효율적으로 적용시킬 수 있는 건 물론이고, 그 외 저희는 또 한가지 결정적이고 획기적인 시그널을 탐지했습니다. 사실 이 부분이 이번 업데이트의 가장 핵심 요소라고 볼 수 있습니다. 캔들스틱화된 RSI 지표의 경향성 및 규칙성 고찰 과정 중 캔들 꼬리가 연속적으로 출현하는 현상에 심상치 않은 기운을 감지한 저희 팀은 정말 소름이 돋을 정도로 용이한 추세 전환 시그널을 발견했습니다. 바로 과매도 구간에서는 아래꼬리, 과매수 구간에서는 위꼬리가 연달아 나올 경우 상당히 높은 확률로 변곡점이 출현하고 추세가 전환되는 경향성에 가중치를 부여해 이에 최적화된 파라미터 및 설정 값들을 찾아 로직화 시켜봤습니다. 결과는 아주 만족스러웠습니다.
이름하여 저희의 최신 지표인 "TTT_Crack_RSI_2.1.0"를 여러분께 소개 드립니다. 이전 버전인 “RSI Cloud”와 마찬가지로, 종가가 아닌 고/저가의 일반/히든 다이버전스 시그널을 알아서 포착해주고, 더 나아가 과매매 구간(기본 값은 30/70이며 설정 변경 가능)에서 RSI 캔들 꼬리의 연속성을 자동으로 감지해 표시(삼각형)를 해주게 끔 만들었습니다. 과매매 구간에서 연이어 출현하는 캔들 꼬리 카운팅의 최소 값은 4으로 디폴트 값 설정을 해 놨습니다. 더 보수적/공격적으로 접근하고 싶으신 분들은, 즉 최소 카운팅 값을 4이 아닌 다른 값으로 변경하고 싶으신 분들은 설정에 들어가셔서 “Wick Count” 항목에 원하는 값을 기재하시면 됩니다.
캔들 꼬리라는 게 어떻게 보면 상대적이고 주관적인 개념일 수 있습니다. 캔들꼬리가 조금만 나와도 의미 부여를 할 수 있는가 하면 특정 이상 길이 아니면 의미 부여를 하지 않을 수 있습니다. 저희는 유저들에게 최대한 높은 유동성을 제공하고자 본 메커니즘이 정의하는 캔들 꼬리 길이를 변경할 수 있도록 만들어 놨습니다. ‘Wick Length” 설정 값을 통해 해당 로직이 간주하는 최소 캔들꼬리 길이를 정할 수 있습니다. 기본 설정 값은 30으로 되어 있고, 경험상 30~40 정도가 적당하다고 보고 있습니다.
마지막으로 해당 지표로 효과적인 진입 타점을 찾는 법을 간략히 알려드리겠습니다. 우선 절대로 아무 시그널 하나 툭 떴다고 무조건 바로 진입하는 건 절대 삼가해주세요. 가급적이면 과매매 구간에서 추세선/채널 이탈, 연속 캔들 꼬리 신호, 그리고 다이버전스가 동시에 떴을 상황을 예의주시하시면 됩니다. 이렇게 비교적 비슷한 시간에 유의미한 신호들이 포착되었다면 또 바로 진입하지 마시고 조금 더 기다리셨다가 과매매 구간을 벗어나는 타이밍을 노리시면 됩니다. 항상 강조드리지만 기술적 지표 하나만 가지고 트레이딩 의사결정을 하는 건 정말 무모한 행위입니다. 개인의 매매성향 마다 다르겠지만 기술적 지표는 항상 큰 추세와 변곡 출현 가능성을 파악하는데 참고하는 용도로 사용 하셔야지 그렇지 않으면 캔들차트는 아예 꺼버리고 지표만 보고 매매하는 꼴이 됩니다.
해당 지표를 사용하고 싶으신 분들은 아래에 댓글 혹은 본 계정으로 메시지(DM) 보내주시면 감사하겠습니다.
감사합니다. 여러분들의 구독, 좋아요, 댓글은 저희에게 정말 큰 힘이 됩니다^^
TTT
Crack_Heiken_Open_Ver_1.0.0
Hello dear traders from all over the world!
Our team recently have explored deeply in Heikin-Ashi Candlestick techniques and some of the benefits utilizing it. After multiple test phases figuring out the pros and cons, we derived some of the insightful strategies and developed it into an technical indicator that visualizes some of the major pivot levels deducted from Heikin-Ashi.
Unlike the common and conventional candlestick chart used widely by many traders these days, Heikin-Ashi candle chart applies different equations for computing the candle body (gap between open and close price). In fact, the close price is determined considering the open, high, low, and close prices of the original candlestick. This very method smooths out the price momentum by averaging out significant prices forming a candlestick. Many suggest one of the advantages of using Heikin-Ashi for traders as an efficient tool to filter out market noises during a liquidation.
These are the default formulas for Heikin-Ashi candlestick formation, where CO, CH, CL, and CC denote open, high, low and close price of the conventional candlestick, respectively. Similarly, HO, HH, HL, and HC denotes open, high, low and close price of the Heikin-Ashi candlestick.
HO = (Previous_HC + Previous_HO) / 2
HC = (CO + CH + CL + CC) / 4
HH = CH
HL = CL
Similar to the common technical chart, the Heikin-Ashi candlesticks are also to be observed and precepted as a complex structure, rather than a simple dimensional price movement. While this very methodology enables traders to objectively identify the strength of the market trends and trend reversal signals, it is yet quite weak during consolidation or accumulation phases. In other words, it is not so reliable when the market shows sideway moves usually before a big trend appears. Furthermore, the market noises in these days (especially in the post-COVID era) are not exactly like those in years ago. Unlike the old days, the liquidation cycle often happens so fast with wider range which led to certain unconventional phenomenon such as long candle wicks, whipsaws, stoploss hunting, and V-shaped patterns, etc. Therefore, we strongly recommend retail traders to not entirely depend only on the Heikin-Ashi when trading, but rather to consider it as one of the technical indicators that function as a side-aid to comprehend the trends.
This directly leads to introduction of the core logic of our new indicator that are assembled extracting useful strategies. This state-of-the-art mechanism shows multiple integral signals from the Heikin-Ashi. The color and the open price of the Heikin-Ashi candlesticks appear as dots on the regular chart. For those who are familiar using Heikin-Ashi will definitely find this useful
One of the important factors in Heikin-Ashi technique is to observe if the colors of the candle appear consecutively. Appearance of an opposite candle that breaks the continuity can be interpreted that the current trend is being weakened. Our indicator shows whether the Heikin-Ashi candles are formed as bullish or bearish and thus the traders can refer the trend signals given by the Heikin-Ashi candles. Series of consecutive colors means the trend is still progressing, until an opposite color appears. The default color for emergence of an opposite candle is orange. Hence, if an orange dot appears after series of the same color of dots, it can be signaled as a trend reversal.
Another efficient strategy is to search for the ‘Shaved Head(Bearish candle with no wick on top)’ and ‘Shaved Bottom(Bullish candle with no wick on bottom)’ patterns. Series of the shaved bottom candles indicates that the trend is bearish while that of shaved head indicates vice versa. In order for the candles to become shaved, the open price should not be broken (below for bullish candles and above for the bearish candles) during the formation of that very candle. This implies that the open price of the Heikin-Ashi candle (the middle of the previous candle body) acts as an important support or resistance.
Some of the decent strategies are summarized as below.
1. When the same color appears consecutively in a series, it means that the trend has started and the distances between the following dots represent the strength of the trend.
2. Similar to Parabolic SAR, the dots work as support and resistance. If the price breaks the dot, in other word if the dot fails to support or reject, be alerted as a weak signal for a trend reversal. (This implies that the Heikin-Ashi candle has failed to construct a shaved head or bottom)
3. If the orange dot appears after a clear and distinctive trend, interpret it as a medium signal for trend reversal. (This implies that the Heikin-Ashi candle has changed the color during on-going trend)
Weight more if one of these signals appear during a longer maintained trend. As mentioned, reliability highly drops when the market is in contraction and consolidation zone, when price is relatively moving sideways without a clear trend.
If you are interested in trying this indicator out, please comment or send direct message to this account.
안녕하세요. 트레이더 여러분 =)
예전과는 성향이 많이 변한 현대 금융 시장에서 하이킨 아시 차트의 적합성, 실용성, 그리고 응용성을 연구 및 고찰하던 저희 팀이 아주 유용한 지표를 개발했습니다. 하이킨 아시 캔들 차트를 보는 방법은 제가 어제 교육 자료로 정리해서 업로딩 해드렸으니 그 부분은 생략하겠습니다.
링크:
간략하게 정리를 해드리자면 하이킨 아시 차트는 진행중인 추세의 강도를 파악하거나 변곡점을 더 명확하게 보여주지만 횡보장에서는 신뢰성이 떨어진다는 치명적인 단점이 있습니다. 따라서 해당 차트를 일반 차트에서 효율적으로 참고할 수 있도록 저희가 하이킨 아시 기법을 활용해 도출한 주요 피봇 레벨들을 차트에 시각화해주는 지표를 개발했습니다.
지표를 매매전략에 활용할 수 있는 전략들은 다음과 같이 간추려볼 수 있겠습니다.
1. 동일한 색의 지표(점)들이 연속으로 형성이 된다면 (양봉 -> 양봉, 음봉 -> 음봉), 어느정도 추세가 시작되었다는 의미로 해석할 수 있고 각 점들 사이의 거리가 추세의 강도를 나타냅니다.
2. Parabolic SAR 지표와 유사하게 해당 지표는 지지와 저항의 역할을 합니다. 가격이 점을 돌파 및 이탈하면, 즉 지표가 가격을 지지/저항을 실패해 뚫리면 추세 변곡의 출현 여부를 처음으로 의심해볼 수 있는 시그널입니다. (점이 뚫렸다는 건 하이킨 아시 차트에서 캔들이 Shaved Candle을 형성하지 못했음을 뜻합니다.)
3. 명확한 추세가 어느정도 진행된 이후 주황색 점이 뜨면 추세 반전에 신호로 볼 수 있습니다. (하이킨 아시 캔들 색깔이 바뀐 상황입니다.)
더 오랜 기간 동안 유지되어온 추세일수록 중간에 위 시그널이 나타날 때 더 큰 의미를 부여할 수 있습니다. 앞서 언급했듯이 횡보장일 때, 명확한 추세가 나오지 않거나 횡보 변동폭이 크면 클수록 신뢰성이 크게 떨어질 수 있다는 점 항상 명심하세요.
해당 지표를 사용해보고 싶으신 분들은 댓글 혹은 메시지 보내주시면 되겠습니다~
다들 감사합니다. 성투하세요 =)
