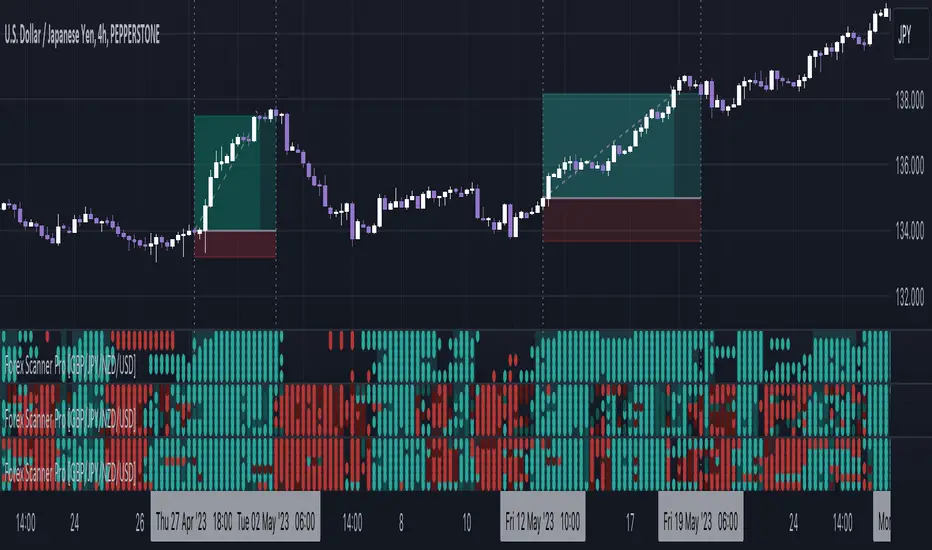
Forex Scanner Pro - GBP/JPY/NZD/USD [FxScripts]Forex Scanner Pro is both a multi-functional indicator and market scanner combined. The combination allows you to have multiple eyes across the market, all from a single chart.
The scanner is comprised of an intuitively designed 3-in-1 tool that tracks the key metrics that drive markets. Each use advanced algorithms to gather information from multiple data points, distilled into one simplified view.
***** TREND SCANNER *****
The first indicator featured on the chart is the Trend Scanner, this allows you to track price action across the wider market. Instantly see pattern shifts and emerging trends; when the market moves, you move with it.
***** MOMENTUM SCANNER *****
The second is the Momentum Scanner which offers a realtime representation of momentum shifts as they occur. This allows you to monitor false breakouts and catch the moves that matter.
***** VOLUME SCANNER *****
The third is the Volume Scanner which provides unique insight into where buy and sell volume is being placed across the market. It offers a further way of determining entry and exit points or simply confirmation that a trend is underway.
***** HOW IT WORKS *****
1. The scanner surveys the market looking for strengths and weaknesses in Trend, Momentum or Volume.
2. It displays the underlying strength or weakness as a series of dots with up to six green dots showing strength and up to six red dots showing weakness.
3. Lighter colored dots are displayed where the strength of the trend, momentum or volume is lesser; if a dot is missing this is a sign of market neutrality.
4. All scanners have a sensitivity setting plus a volatility filter which can be adjusted according to your style of trading and the underlying instrument (full details below).
5. The background can be set to color-fill when the majority of dots are coloured either red or green, with higher values denoting greater strength or greater weakness.
6. Alerts can be configured in the same way as the background to provide both entry and exit signals (further details below).
***** INSTRUMENTS *****
Due to computational restraints, the scanner is split across two different indicators. This one features GBP, JPY, NZD and USD; the other AUD, CAD, CHF and EUR. Both form part of the same package.
Forex Scanner Pro works effortlessly with any of the following major or minor crosses:
AUDCAD, AUDCHF, AUDJPY, AUDNZD, AUDSGD, AUDUSD, CADCHF, CADJPY, CADSGD, CHFJPY, EURAUD, EURCAD, EURCHF, EURGBP, EURJPY, EURNZD, EURSGD, EURUSD, GBPAUD, GBPCAD, GBPCHF, GBPJPY, GBPNZD, GBPSGD, GBPUSD, NZDCAD, NZDCHF, NZDJPY, NZDUSD, SGDJPY, USDCAD, USDCHF, USDJPY, USDSGD
***** SETTINGS OVERVIEW *****
The scanner features the following customizable settings:
~~ Trend Settings ~~
▶ Trend Filter - adjusting this will allow you to focus on short term trends (most suitable for scalping), medium or long term (best for swing trading).
▶ Countertrend Strength - increases the sensitivity of weaker vs stronger countertrends. As countertrends are trends that run against the main trend, this will assist in detecting the strength of a pullback or reversal and allow you to either hold, exit or reverse the trade with confidence.
~~ Momentum Settings ~~
▶ Momentum Filter - increase or decrease the sensitivity of the momentum scanner. Increase to avoid periods of low or weak momentum, decrease to highlight stronger surges in momentum.
~~ Volume Settings ~~
▶ Volume Filter - increase or decrease the sensitivity of the volume scanner. Increase to avoid periods where buy and sell volume can potentially cancel each other out.
~~ Volatility Settings ~~
▶ Volatility Offset - use this to fine tune the volatility filter. A higher value generally delays the volatility filter allowing for confirmation of stronger trends, a lower value will detect trend, momentum or volume movement sooner but may be less accurate.
▶ Each scanner has its own setting allowing you to adjust how you monitor the underlying volatility for each.
▶ As with all settings, we recommend adjusting this to your style of trading, instrument and timeframe.
~~ Alerts ~~
Alerts can be configured to send notifications when anything from 4-6 bullish or bearish dots are showing. Exit markers can be configured when anything from 2+ dots are revealed. This adds an extra layer of sensitivity for traders who appreciate complete control over their trade.
~~ Display Settings ~~
You have the ability to hide all colored dots and only show the background or, alternatively, hide the background and only show colored dots.
***** TRIAL PERIOD *****
We offer a FREE, no questions asked, 7-day trial with every new registration. Visit the link below to register.
Trendtrading
RSI Trend Detector PSAR BasedRSI Trend Detector is based on the Direction of PSAR. This indicator helps the easy detection of Trend Direction and Sideways Movement of Price. It was difficult to determine the RSI Trend Direction in a basic RSI indicator. one cannot decide the exact entry point where to enter.
RSI Trend Detector helps with the direction of trend using PSAR direction which is almost instant direction changing indicator with Zero Lag. The color of the RSI changes immediately based on PSAR direction. One can determine the trend whether its in UP / Down or Sideways.
One can easily detect Pullback and entry points using this indicator.
The basic working can be interpreted with a normal default RSI, The only additional feature is the direction of trend using a SAR signal.
Oversold Zone is below 30
Overbought Zone is above 70
how ever RSI above 50 is treated a UP trend and Below 50 as Down Trend.
when RSI is between 40 and 60 price must be considered as Sideways. One can easily interpret the TREND.
Yellow Line = RSI Moving Average
RED and Green Line= RSI
Grey Zone = Sideways
Horizontal line = RSI level 50
Settings can be changed as required.
RSI Line:
RSI Above 50 up trend and Entry when color is green
RSI Below 50 down trend and Entry when color is Red
RSI in Grey Zone is sideways, wait for a breakout
RSI above 50 and color is red then its a pullback in uptrend
RSI below 50 and color is green then its a pullback in downtrend
ALERTS:
Up signal and Down Signal are provided when ever RSI crosses RSIMA
Up Signal: RSI crosses RSI Moving Average upwards
Down Signal: RSI crosses RSI Moving Average Downwards
Hope the Tradingview community likes this.

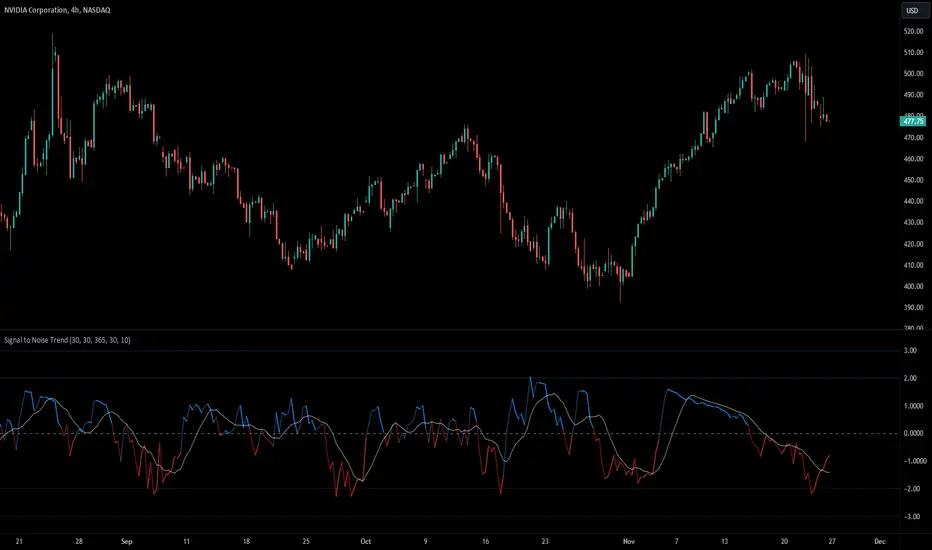
Signal to Noise TrendSignal to Noise Ratio
The Signal to Noise Ratio or SNR is used to assess the quality of information or data by comparing the strength of a useful signal to the presence of background noise or random variations.
In Finance the SNR refers to the ratio of strength of a trading signal to the background noise. A high SNR suggest a clear and reliable signal, meanwhile a low SNR indicates more noise (random fluctuations, volatility, or randomness).
Signal To Noise Trend
This indicator basically calculates the signal to noise of returns and then gets the Z-Score of the signal to noise ratio to find extremes levels of signal and noise. The Lines basically are standard deviations from the mean. 1,2,3 Are standard deviations same with the -1,-2,-3 Lines.
The signal is expressed as the positive Z-Score value, and the Noise is the negative Z-Score Value.
The moving average enhances the indicator ability to display the trend of returns and the trend strength. It provides a smooth representation of the Signal to Nose Ratio values.
There are more trending conditions when there is a higher signal, and there is more "ranging" conditions when there is more noise present in the markets.
The Standard deviations help find extreme levels of signal and noise. If the noise reaches the standard deviation of -3 then that means that there is a extreme negative deviation from the mean, and this would be a rare occurrence, with a lot of noise. This could indicate a potential reversion in market states, and could be followed by a trending move.
Another example is that if the Z-Score value reaches a Standard deviation of 3, this could mean that there is extremely strong and rare signal, and could potentially mean a change to a more noisy environment soon.
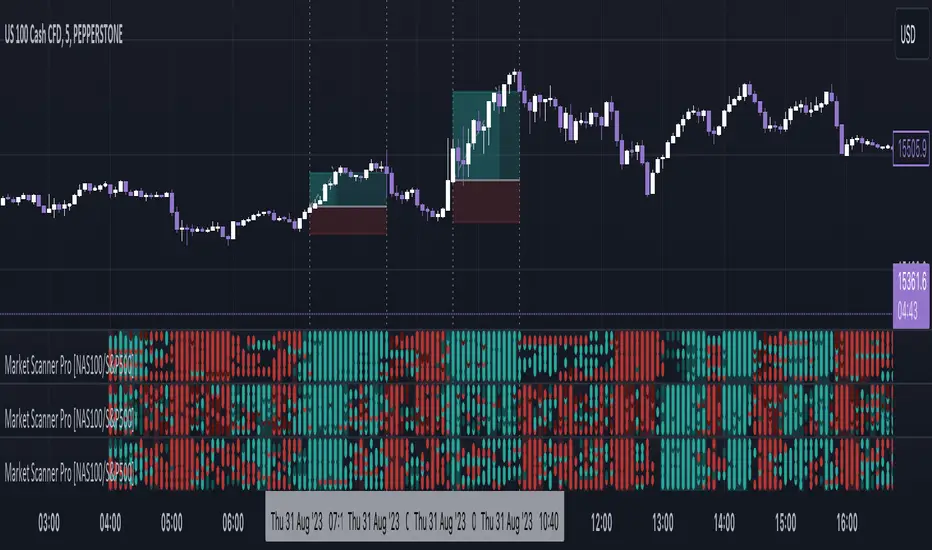
Market Scanner Pro - NAS100/S&P500 [FxScripts]***** OVERVIEW *****
Market Scanner Pro is both a multi-functional indicator and market scanner combined. The combination allows you to have multiple eyes across the market, all from a single chart.
The scanner is comprised of an intuitively designed 3-in-1 tool that tracks the key metrics that drive markets. Each use advanced algorithms to gather information from multiple data points, distilled into one simplified view.
***** TREND SCANNER *****
The first indicator featured on the chart is the Trend Scanner, this allows you to track price action across the wider market. Instantly see pattern shifts and emerging trends; when the market moves, you move with it.
***** MOMENTUM SCANNER *****
The second is the Momentum Scanner which offers a realtime representation of momentum shifts as they occur. This allows you to monitor false breakouts and catch the moves that matter.
***** VOLUME SCANNER *****
The third is the Volume Scanner which provides unique insight into where buy and sell volume is being placed across the market. It offers a further way of determining entry and exit points or simply confirmation that a trend is underway.
***** HOW IT WORKS *****
1. The scanner surveys the market looking for strengths and weaknesses in Trend, Momentum or Volume.
2. It displays the underlying strength or weakness as a series of dots with up to 10 green dots showing strength and up to 10 red dots showing weakness.
3. Lighter colored dots are displayed where the strength of the trend, momentum or volume is lesser; if a dot is missing this is a sign of market neutrality.
4. All scanners have a sensitivity setting plus a volatility filter which can be adjusted according to your style of trading and the underlying instrument (full details below).
5. The background can be set to color-fill when the majority of dots are coloured either red or green, with higher values denoting greater strength or greater weakness.
6. Alerts can be configured in the same way as the background to provide both entry and exit signals (further details below).
***** INSTRUMENTS *****
Market Scanner Pro is made up of both a European and US indices scanner, both forming part of the same package.
European features the DAX40 and FTSE100; US (this scanner) features the NAS100 plus S&P500. The US scanner works on futures and options such as ES, NQ, QQQ, SPX and SPY.
***** SETTINGS OVERVIEW *****
The scanner features the following customizable settings:
~~ Trend Settings ~~
▶ Trend Filter - adjusting this will allow you to focus on short term trends (most suitable for scalping), medium or long term (best for swing trading).
▶ Countertrend Strength - increases the sensitivity of weaker vs stronger countertrends. As countertrends are trends that run against the main trend, this will assist in detecting the strength of a pullback or reversal and allow you to either hold, exit or reverse the trade with confidence.
~~ Momentum Settings ~~
▶ Momentum Filter - increase or decrease the sensitivity of the momentum scanner. Increase to avoid periods of low or weak momentum, decrease to highlight stronger surges in momentum.
~~ Volume Settings ~~
▶ Volume Filter - increase or decrease the sensitivity of the volume scanner. Increase to avoid periods where buy and sell volume can potentially cancel each other out.
~~ Volatility Settings ~~
▶ Volatility Offset - use this to fine tune the volatility filter. A higher value generally delays the volatility filter allowing for confirmation of stronger trends, a lower value will detect trend, momentum or volume movement sooner but may be less accurate.
▶ Each scanner has its own setting allowing you to adjust how you monitor the underlying volatility for each.
▶ As with all settings, we recommend adjusting this to your style of trading, instrument and timeframe.
~~ Alerts ~~
Alerts can be configured to send notifications when anything from 6-10 bullish or bearish dots are showing. Exit markers can be configured when anything from 2+ dots are revealed. This adds an extra layer of sensitivity for traders who appreciate complete control over their trade.
~~ Display Settings ~~
You have the ability to hide all colored dots and only show the background or, alternatively, hide the background and only show colored dots.
***** TRIAL PERIOD *****
We offer a FREE, no questions asked, 7-day trial with every new registration. Visit the link below to register.
Market Scanner Pro - DAX/FTSE [FxScripts]***** OVERVIEW *****
Market Scanner Pro is both a multi-functional indicator and market scanner combined. The combination allows you to have multiple eyes across the market, all from a single chart.
The scanner is comprised of an intuitively designed 3-in-1 tool that tracks the key metrics that drive markets. Each use advanced algorithms to gather information from multiple data points, distilled into one simplified view.
***** TREND SCANNER *****
The first indicator featured on the chart is the Trend Scanner, this allows you to track price action across the wider market. Instantly see pattern shifts and emerging trends; when the market moves, you move with it.
***** MOMENTUM SCANNER *****
The second is the Momentum Scanner which offers a realtime representation of momentum shifts as they occur. This allows you to monitor false breakouts and catch the moves that matter.
***** VOLUME SCANNER *****
The third is the Volume Scanner which provides unique insight into where buy and sell volume is being placed across the market. It offers a further way of determining entry and exit points or simply confirmation that a trend is underway.
***** HOW IT WORKS *****
1. The scanner surveys the market looking for strengths and weaknesses in Trend, Momentum or Volume.
2. It displays the underlying strength or weakness as a series of dots with up to 10 green dots showing strength and up to 10 red dots showing weakness.
3. Lighter colored dots are displayed where the strength of the trend, momentum or volume is lesser; if a dot is missing this is a sign of market neutrality.
4. All scanners have a sensitivity setting plus a volatility filter which can be adjusted according to your style of trading and the underlying instrument (full details below).
5. The background can be set to color-fill when the majority of dots are coloured either red or green, with higher values denoting greater strength or greater weakness.
6. Alerts can be configured in the same way as the background to provide both entry and exit signals (further details below).
***** INSTRUMENTS *****
Market Scanner Pro is made up of both a European and US indices scanner, both forming part of the same package.
European (this scanner) features the DAX40 and FTSE100; US features the NAS100 plus S&P500. The US scanner works on futures and options such as ES, NQ, QQQ, SPX and SPY.
***** SETTINGS OVERVIEW *****
The scanner features the following customizable settings:
~~ Trend Settings ~~
▶ Trend Filter - adjusting this will allow you to focus on short term trends (most suitable for scalping), medium or long term (best for swing trading).
▶ Countertrend Strength - increases the sensitivity of weaker vs stronger countertrends. As countertrends are trends that run against the main trend, this will assist in detecting the strength of a pullback or reversal and allow you to either hold, exit or reverse the trade with confidence.
~~ Momentum Settings ~~
▶ Momentum Filter - increase or decrease the sensitivity of the momentum scanner. Increase to avoid periods of low or weak momentum, decrease to highlight stronger surges in momentum.
~~ Volume Settings ~~
▶ Volume Filter - increase or decrease the sensitivity of the volume scanner. Increase to avoid periods where buy and sell volume can potentially cancel each other out.
~~ Volatility Settings ~~
▶ Volatility Offset - use this to fine tune the volatility filter. A higher value generally delays the volatility filter allowing for confirmation of stronger trends, a lower value will detect trend, momentum or volume movement sooner but may be less accurate.
▶ Each scanner has its own setting allowing you to adjust how you monitor the underlying volatility for each.
▶ As with all settings, we recommend adjusting this to your style of trading, instrument and timeframe.
~~ Alerts ~~
Alerts can be configured to send notifications when anything from 6-10 bullish or bearish dots are showing. Exit markers can be configured when anything from 2+ dots are revealed. This adds an extra layer of sensitivity for traders who appreciate complete control over their trade.
~~ Display Settings ~~
You have the ability to hide all colored dots and only show the background or, alternatively, hide the background and only show colored dots.
***** TRIAL PERIOD *****
We offer a FREE, no questions asked, 7-day trial with every new registration. Visit the link below to register.

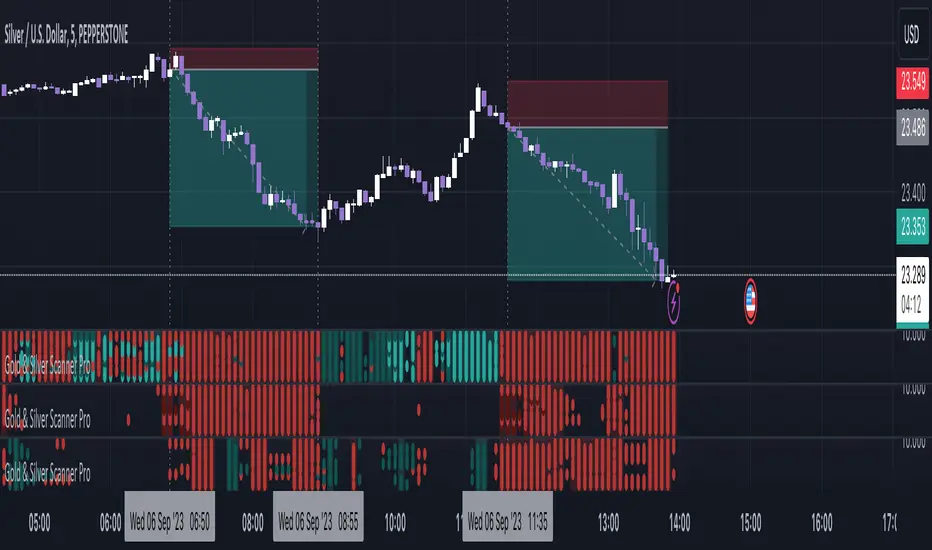
Gold & Silver Scanner Pro [FxScripts]***** FEATURES *****
Gold & Silver Scanner Pro is both a multi-functional indicator and market scanner combined. The combination allows you to have multiple eyes across the market, all from a single chart.
The scanner is comprised of an intuitively designed 3-in-1 tool that tracks the key metrics that drive markets. Each use advanced algorithms to gather information from multiple data points, distilled into one simplified view.
***** TREND SCANNER *****
The first indicator featured on the chart is the Trend Scanner, this allows you to track price action across the wider market. Instantly see pattern shifts and emerging trends; when the market moves, you move with it.
***** MOMENTUM SCANNER *****
The second is the Momentum Scanner which offers a realtime representation of momentum shifts as they occur. This allows you to monitor false breakouts and catch the moves that matter.
***** VOLUME SCANNER *****
The third is the Volume Scanner which provides unique insight into where buy and sell volume is being placed across the market. It offers a further way of determining entry and exit points or simply confirmation that a trend is underway.
***** HOW IT WORKS *****
1. The scanner surveys the market looking for strengths and weaknesses in Trend, Momentum or Volume.
2. It displays the underlying strength or weakness as a series of dots with up to nine green dots showing strength and up to nine red dots showing weakness (nine data points in total).
3. Lighter colored dots are displayed where the strength of the trend, momentum or volume is lesser; if a dot is missing this is a sign of market neutrality.
4. All scanners have a sensitivity setting plus a volatility filter which can be adjusted according to your style of trading and the underlying instrument (full details below).
5. The background can be set to color-fill when the majority of dots are coloured either red or green, with higher values denoting greater strength or greater weakness.
6. Alerts can be configured in the same way as the background to provide both entry and exit signals (further details below).
***** INSTRUMENTS *****
Gold & Silver Scanner Pro works effortlessly with any of the XAG and XAU major or minor crosses:
XAGAUD, XAGCHF, XAGEUR, XAGGBP, XAGJPY, XAGUSD, XAUAUD, XAUCHF, XAUEUR, XAUGBP, XAUJPY, XAUUSD
Plus the following gold and silver futures:
GC, SI
***** SETTINGS OVERVIEW *****
The scanner features the following customizable settings:
~~ Trend Settings ~~
▶ Trend Filter - adjusting this will allow you to focus on short term trends (most suitable for scalping), medium or long term (best for swing trading).
▶ Countertrend Strength - increases the sensitivity of weaker vs stronger countertrends. As countertrends are trends that run against the main trend, this will assist in detecting the strength of a pullback or reversal and allow you to either hold, exit or reverse the trade with confidence.
~~ Momentum Settings ~~
▶ Momentum Filter - increase or decrease the sensitivity of the momentum scanner. Increase to avoid periods of low or weak momentum, decrease to highlight stronger surges in momentum.
~~ Volume Settings ~~
▶ Volume Filter - increase or decrease the sensitivity of the volume scanner. Increase to avoid periods where buy and sell volume can potentially cancel each other out.
~~ Volatility Settings ~~
▶ Volatility Offset - use this to fine tune the volatility filter. A higher value generally delays the volatility filter allowing for confirmation of stronger trends, a lower value will detect trend, momentum or volume movement sooner but may be less accurate.
▶ Each scanner has its own setting allowing you to adjust how you monitor the underlying volatility for each.
▶ As with all settings, we recommend adjusting this to your style of trading, instrument and timeframe.
~~ Alerts ~~
Alerts can be configured to send notifications when anything from 5-9 bullish or bearish dots are showing. Exit markers can be configured when anything from 2+ dots are revealed. This adds an extra layer of sensitivity for traders who appreciate complete control over their trade.
~~ Display Settings ~~
You have the ability to hide all colored dots and only show the background or, alternatively, hide the background and only show colored dots.
***** TRIAL PERIOD *****
We offer a FREE, no questions asked, 7-day trial with every new registration. Visit the link below to register.
TrendCylinder (Expo)█ Overview
The TrendCylinder is a dynamic trading indicator designed to capture trends and volatility in an asset's price. It provides a visualization of the current trend direction and upper and lower bands that adapt to volatility changes. By using this indicator, traders can identify potential breakouts or support and resistance levels. While also gauging the volatility to generate trading ranges. The indicator is a comprehensive tool for traders navigating various market conditions by providing a sophisticated blend of trend-following and volatility-based metrics.
█ How It Works
Trend Line: The trend line is constructed using the closing prices with the influence of volatility metrics. The trend line reacts to sudden price changes based on the trend factor and step settings.
Upper & Lower Bands: These bands are not static; they are dynamically adjusted with the calculated standard deviation and Average True Range (ATR) metrics to offer a more flexible, real-world representation of potential price movements, offering an idea of the market's likely trading range.
█ How to Use
Identifying Trends
The trend line can be used to identify the current market trend. If the price is above the trend line, it indicates a bullish trend. Conversely, if the price is below the trend line, it indicates a bearish trend.
Dynamic Support and Resistance
The upper and lower bands (including the trend line) dynamically change with market volatility, acting as moving targets of support and resistance. This helps set up stop-loss or take-profit levels with a higher degree of accuracy.
Breakout vs. Reversion Strategies
Price movements beyond the bands could signify strong trends, making it ideal for breakout strategies.
Fakeouts
If the price touches one of the bands and reverses direction, it could be a fakeout. Traders may choose to trade against the breakout in such scenarios.
█ Settings
Volatility Period: Defines the look-back period for calculating volatility. Higher values adapt the bands more slowly, whereas lower values adapt them more quickly.
Trend Factor: Adjusts the sensitivity of the trend line. Higher values produce a smoother line, while lower values make it more reactive to price changes.
Trend Step: Controls the pace at which the trend line adjusts to sudden price movements. Higher values lead to a slower adjustment and a smoother line, while lower values result in quicker adjustments.
-----------------
Disclaimer
The information contained in my Scripts/Indicators/Ideas/Algos/Systems does not constitute financial advice or a solicitation to buy or sell any securities of any type. I will not accept liability for any loss or damage, including without limitation any loss of profit, which may arise directly or indirectly from the use of or reliance on such information.
All investments involve risk, and the past performance of a security, industry, sector, market, financial product, trading strategy, backtest, or individual's trading does not guarantee future results or returns. Investors are fully responsible for any investment decisions they make. Such decisions should be based solely on an evaluation of their financial circumstances, investment objectives, risk tolerance, and liquidity needs.
My Scripts/Indicators/Ideas/Algos/Systems are only for educational purposes!

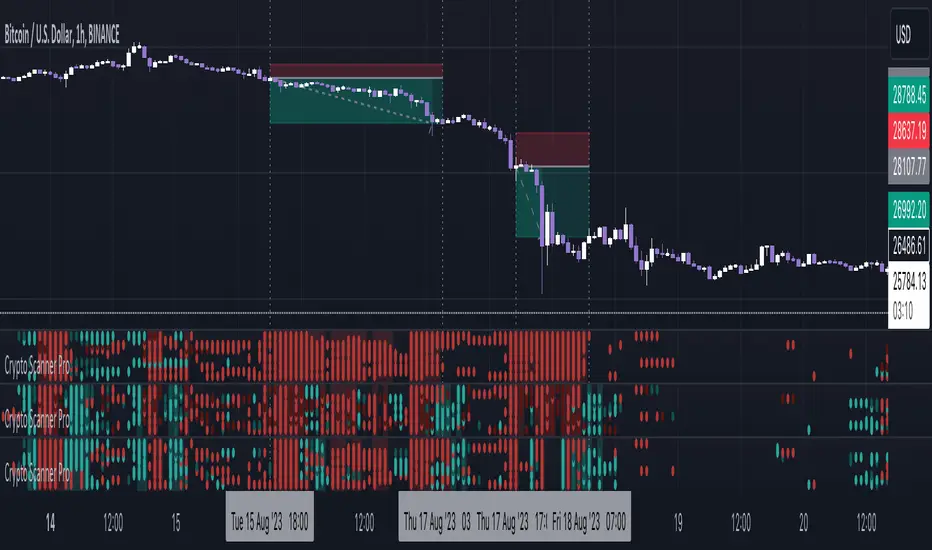
Crypto Scanner Pro [FxScripts]***** FEATURES *****
Crypto Scanner Pro is both an indicator and market scanner combined. The combination allows you to have multiple eyes across the market, all from a single chart.
Each scanner is comprised of an intuitively designed 3-in-1 tool that tracks the key metrics that drive markets.
They each use advanced algorithms to gather information from multiple data points, distilled into one simplified view.
***** TREND SCANNER *****
The Trend Scanner allows you to track price action across the wider market. Instantly see pattern shifts and emerging trends; when the market moves, you can move with it.
***** MOMENTUM SCANNER *****
The Momentum Scanner offers realtime insights into momentum shifts as they occur. This allows you to monitor false breakouts and catch the moves that matter.
***** VOLUME SCANNER *****
The Volume Scanner provides unique indications into where buy and sell volume is being placed. It offers a further way of determining entry and exit points or simply confirmation that a trend is underway.
***** INSTRUMENTS *****
Crypto Scanner Pro works effortlessly with the following large cap coins:
Avalanche, Bitcoin Cash, Bitcoin, BITO, BNB, Cardano, Chainlink, Dogecoin, Ethereum, Litecoin, Polkadot, Polygon, Shiba Inu, Solana, Stellar, Toncoin, XRP (Ripple) *
***** SETTINGS OVERVIEW *****
The scanner features the following customizable settings:
~~ Trend Settings ~~
Trend Filter - adjusting this will allow you to focus on short term trends (most suitable for scalping), medium or long term (best for swing trading).
Countertrend Strength - increases the sensitivity of weaker vs stronger countertrends. As countertrends are trends that run against the main trend, this will assist in detecting the strength of a pullback or reversal and allow you to either hold, exit or reverse the trade with confidence.
~~ Momentum Settings ~~
Momentum Filter - increase or decrease the sensitivity of the momentum scanner. Increase to avoid periods of low or weak momentum, decrease to highlight stronger surges in momentum.
~~ Volume Settings ~~
Volume Filter - increase or decrease the sensitivity of the volume scanner. Increase to avoid periods where buy and sell volume can potentially cancel each other out.
~~ Volatility Settings ~~
Volatility Offset - use this to fine tune the volatility filter. A higher value generally delays the volatility filter allowing for confirmation of stronger trends, a lower value will detect trend, momentum or volume movement sooner but may be less accurate.
Each scanner has its own setting allowing you to adjust how you monitor the underlying volatility for each.
As with all settings, we recommend adjusting this to your style of trading, instrument and timeframe.
~~ Alerts ~~
Alerts can be configured to send notifications when anything from 6-10 bullish or bearish dots are showing. Exit markers can be configured when anything from 2+ dots are revealed. This adds an extra layer of sensitivity for traders who appreciate complete control over their trade.
~~ Display Settings ~~
You have the ability to hide all colored dots and only show the background or, alternatively, hide the background and only show colored dots.
***** TRIAL PERIOD *****
We offer a FREE, no questions asked, 7-day trial with every new registration. Visit the link below to register.
* list subject to change as coins increase or decrease in popularity
Volume Delta Trailing Stop [LuxAlgo]The ' Volume Delta Trailing Stop ' indicator uses Lower Time Frame (LTF) volume delta data which can provide potential entries together with a Volume-Delta based Trailing Stop-line .
🔶 USAGE
Our 'Volume Delta Trailing Stop' script can show potential entries/Stop Loss lines
A trigger line needs to be broken before a position is taken, after which a Volume Delta-controlled Trailing Stop-line is created:
🔶 DETAILS
🔹 Volume rises when bought or sold
🔹 When the opening price appears on the chart, a buy/sell order has been executed.
If that order is less than the available supply of that particular price, volume will rise, without moving the price.
🔹 When the opening price is the same as the closing price, the volume of that bar can be seen as "neutral volume" (nV); nor "up", nor "down" volume.
Example
A buy order doesn't fill the first available supply in the order book. This price will be the opening price with a certain volume.
When at closing time, price still hasn't moved (the first available supply in the order book isn't filled, or no movement downwards),
the closing price will be equal to the opening price, but with volume. This can be seen as "neutral volume (nV)".
🔹 Delta Volume (ΔV): this is "up volume" minus "down volume"
🔹 Standard volume is colored red when closing price is lower than opening price ( = "down volume").
🔹 Standard volume is colored green when closing price is higher OR equal (nV) than opening price ( = "up volume").
🔹 Neutral Volume
The "Neutral-Volume" is considered "Up-Volume" - setting will dictate whether nV is considered as green 'buy' volume or not.
🔶 EXAMPLE
29 July 10:00 -> 10:05, chart timeframe 5 minutes, open 29311.28, close 29313.89
close > open, so the volume (39.55) is colored green ("up volume").
(The Volume script used in the following examples is the open-source publication Volume Columns w. Alerts (V) from LucF )
Let's zoom to the 1-minute TF:
The same period is now divided into more bars, volume direction (color) is dependable on the difference between open and close.
Counting up and down volume gives a more detailed result, it remains in an upward direction though):
(ΔV = +15.51)
Let's further zoom in to the 1-second TF:
The same period is now divided into even more bars (more possibility for changing direction on each bar)
Here we see several bars that haven't moved in price, but they have volume ("neutral" volume).
(neutral volume is coloured light green here, while up volume is coloured darker green)
When we count all green and red volume bars, the result is quite different:
(ΔV = -0.35)
In total more volume is found when price went downwards, yet price went up in these 5 minutes.
-> This is the heart of our publication, when this divergence occurs, you can see a barcolor changement:
• orange: when price went up, but LTF Volume was mainly in a downward direction.
• blue: when price went down, but LTF Volume was mainly in an upwards direction.
When we split the green "up volume" into "up" and "neutral", the difference is even higher
(here "neutral volume" is colored grey):
(ΔV = -12.76; "up" - "down")
🔶 CONCEPTS
bullishBear = current bar is red but LTF volume is in upward direction -> blue bar
bearishBull = current bar is green but LTF volume is in downward direction -> orange bar
🔹 Potential positioning - forming of Trigger-line
When not in position, the script will wait for a divergence between price and volume direction. When found, a Trigger-line will appear:
• at high when a blue bar appears ( bullishBear ).
• at low when an orange bar appears ( bearishBull ).
Next step is when the Trigger-line is broken by close or high/low (settings: Trigger )
Here, the closing price went under the grey Trigger-line -> bearish position:
🔹 Trailing Stop-line
When the Trigger-line is broken, the Trailing Stop-line (TS-line) will start:
• low when bullish position
• high when bearish position
You can choose (settings -> Trigger -> Close or H/L ) whether close price or high/low should break the Trigger-line
When alerts are enabled ("Any alert() function call"), you'll get the following message:
• ' signal up ' when bullish position
• ' signal down' when bearish position
After that, the TS-line will be adjusted when:
• a blue bullishBear bar appears when in bullish position -> lowest of {low , previous blue bar's high or orange bar's low}
• an orange bearishBull bar appears when in bearish position -> highest of {high, previous blue bar's high or orange bar's low}
When alerts are enabled ("Any alert() function call"), and the TS-line is broken, you'll get the following message:
• ' TS-line broken down ' when out bullish position
• ' TS-line broken up ' when out bearish position
🔹 Reference Point
Default the direction of price will be evaluated by comparing closing price with opening price.
When open and close are the same, you'll get "neutral volume".
You can use "previous close" instead (as in built-in volume indicator) to include gaps.
If close equals open , but close is lower than previous close , it will be regarded as " down volume ",
similar, when close is higher than previous close , it will be regarded as " up volume "
Note, the setting applies for the current timeframe AND Lower timeframe:
Based on: " open " (close - open)
Based on: " previous close " (close - previous close)
🔹 Adjustment
When the TS-line changes, this can be adjusted with a percentage of price , or a multiple of " True Range "
Default (Δ line -> Adjustment - 0)
Δ line -> Adjustment 0.03% (of price)
Δ line -> Mult of TR (10)
🔶 SETTINGS
🔹 LTF: choose your Lower TimeFrame: 1S (seconds), 5S, 10S, 15S, 30S, 1 minute)
🔹 Trigger: Choose the trigger for breaking the Trigger-line ; close or H/L (high when bullish position, low when bearish position)
🔹 Δ line ( Trailing Stop-line ): add/subtract an adjustment when the TS-line changes ( default: Adjustment ):
• Adjustment ( default: 0 ): add/subtract an extra % of price
• Mult of TR : add/subtract a multiple of True Range
🔹 Based on: compare closing price against:
• open
• previous close
🔹 "Neutral-Volume" is considered "Up-Volume" : this setting will dictate whether nV is considered as green 'buy' volume or not.
🔶 CONSIDERATIONS
🔹 The lowest LTF (1S) will give you more detail and will get data close to tick data.
However, a maximum of 100,000 intrabars can be used in calculations .
This means on the daily chart you won't see anything since 1 day ~ 86400 seconds. (just over 1 bar)
-> choose a lower chart timeframe, or choose a higher LTF (5S, 10S, ... 1 minute)
🔹 Always choose a LTF lower than the current chart timeframe.
🔹 Pine Script™ code using this request.security_lower_tf() may calculate differently on historical and real-time bars, leading to repainting .

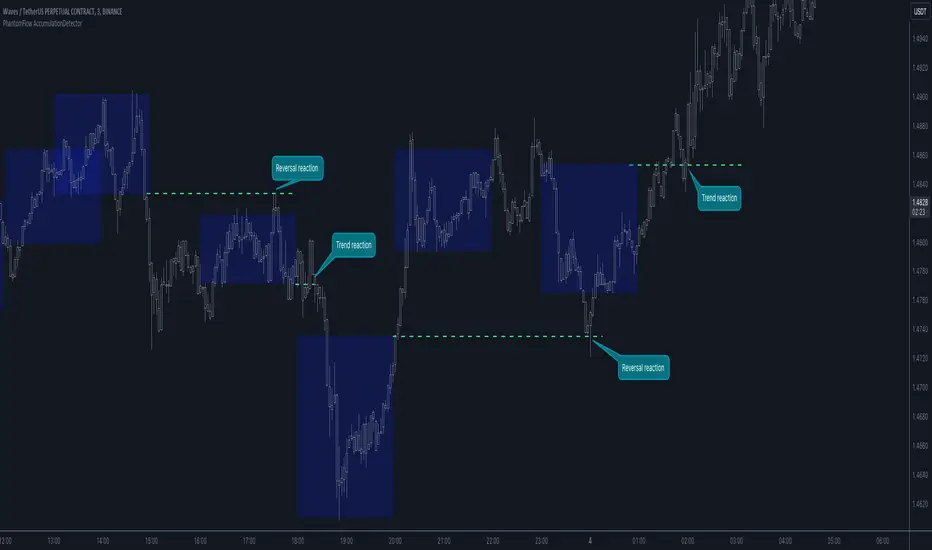
PhantomFlow AccumulationDetectorThe PhantomFlow AccumulationDetector indicator analyzes the volume profile and displays potential accumulation based on the selected timeframe in the settings. This indicator can be used both as zones for trend following and for identifying reversals, as shown in the examples on the chart. The logic behind the formation of the accumulation zone is based on the fact that the POC (Point of Control) of the current zone is within the Volume Area range of the previous period.
Optimal settings for the working timeframe should be chosen visually, and the size of the zones should not be too large or too small. Additionally, it's advisable not to consider overly wide zones during increased volatility.
Consecutive zones within the same range often indicate a potential reversal.
We borrowed the volume profile calculation code from @LonesomeTheBlue. Thank you for the work done!
Hybrid EMA AlgoLearner⭕️Innovative trading indicator that utilizes a k-NN-inspired algorithmic approach alongside traditional Exponential Moving Averages (EMAs) for more nuanced analysis. While the algorithm doesn't actually employ machine learning techniques, it mimics the logic of the k-Nearest Neighbors (k-NN) methodology. The script takes into account the closest 'k' distances between a short-term and long-term EMA to create a weighted short-term EMA. This combination of rule-based logic and EMA technicals offers traders a more sophisticated tool for market analysis.
⭕️Foundational EMAs: The script kicks off by generating a 50-period short-term EMA and a 200-period long-term EMA. These EMAs serve a dual purpose: they provide the basic trend-following capability familiar to most traders, akin to the classic EMA 50 and EMA 200, and set the stage for more intricate calculations to follow.
⭕️k-NN Integration: The indicator distinguishes itself by introducing k-NN (k-Nearest Neighbors) logic into the mix. This machine learning technique scans prior market data to find the closest 'neighbors' or distances between the two EMAs. The 'k' closest distances are then picked for further analysis, thus imbuing the indicator with an added layer of data-driven context.
⭕️Algorithmic Weighting: After the k closest distances are identified, they are utilized to compute a weighted EMA. Each of the k closest short-term EMA values is weighted by its associated distance. These weighted values are summed up and normalized by the sum of all chosen distances. The result is a weighted short-term EMA that packs more nuanced information than a simple EMA would.

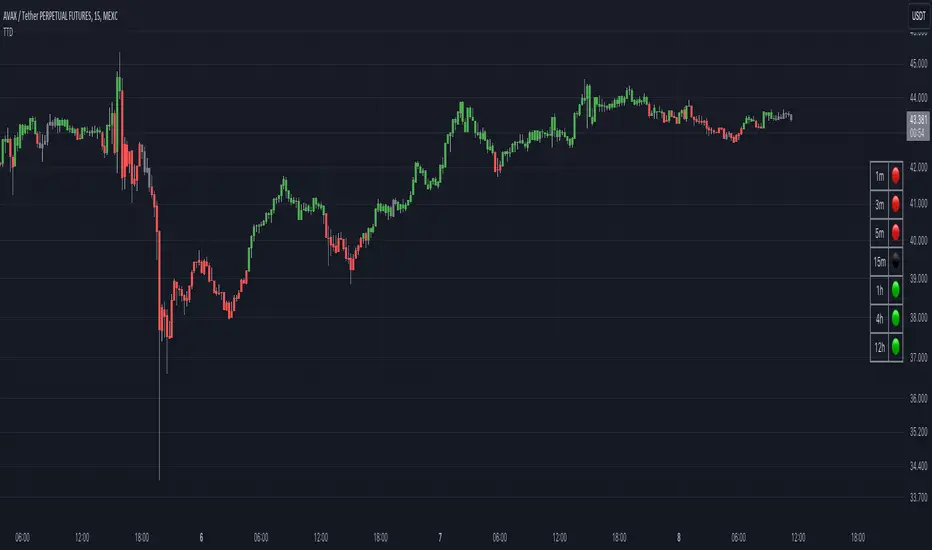
Traders Trend DashboardThe Traders Trend Dashboard (TTD) is a comprehensive trend analysis tool designed to assist traders in making informed trading decisions across various markets and timeframes. Unlike conventional trend-following scripts, TTD goes beyond simple trend detection by incorporating a unique combination of moving averages and a visual dashboard, providing traders with a clear and actionable overview of market trends. Here's how TTD stands out from the crowd:
Originality and Uniqueness:
TTD doesn't rely on just one moving average crossover to detect trends. Instead, it employs a dynamic approach by comparing two moving averages of distinct periods across multiple timeframes. This innovative methodology enhances trend detection accuracy and reduces false signals commonly associated with single moving average systems.
Market Applicability:
TTD is versatile and adaptable to various financial markets, including forex, stocks, cryptocurrencies, and commodities. Its flexibility ensures that traders can utilize it across different asset classes and capitalize on market opportunities.
Optimal Timeframe Utilization:
Unlike many trend indicators that work best on specific timeframes, TTD caters to traders with diverse trading preferences. It offers support for intraday trading (1m, 3m, 5m), short-term trading (15m, 30m, 1h), and swing trading (4h, D, W, M), making it suitable for a wide range of trading styles.
Underlying Conditions and Interpretation:
TTD is particularly effective during trending markets, where its multi-timeframe approach helps identify consistent trends across various time horizons. In ranging markets, TTD can indicate potential reversals or areas of uncertainty when moving averages converge or cross frequently.
How to Use TTD:
1. Timeframe Selection: Choose the relevant timeframes based on your trading style and preferences. Enable or disable timeframes in the settings to focus on the most relevant ones for your strategy.
2. Dashboard Interpretation: The TTD dashboard displays green (🟢) and red (🔴) symbols to indicate the relationship between two moving averages. A green symbol suggests that the shorter moving average is above the longer one, indicating a potential bullish trend. A red symbol suggests the opposite, indicating a potential bearish trend.
3. Confirmation and Strategy: Consider TTD signals as confirmation for your trading strategy. For instance, in an uptrend, look for long opportunities when the dashboard displays consistent green symbols. Conversely, in a downtrend, focus on short opportunities when red symbols dominate.
4. Risk Management: As with any indicator, use TTD in conjunction with proper risk management techniques. Avoid trading solely based on indicator signals; instead, integrate them into a comprehensive trading plan.
Conclusion:
The Traders Trend Dashboard (TTD) offers traders a powerful edge in trend analysis, combining innovation, versatility, and clarity. By understanding its unique methodology and integrating its signals with your trading strategy, you can make more informed trading decisions across various markets and timeframes. Elevate your trading with TTD and unlock a new level of trend analysis precision.
Divergance Based on Vortex IndicatorThe Vortex-Based Divergence Indicator represents a groundbreaking approach to analyzing market dynamics within the realm of technical analysis. Drawing inspiration from the concept of vortices and their cyclical patterns, this indicator strives to illuminate potential divergence points within financial markets, providing traders with valuable insights for informed decision-making.
At its foundation, the Vortex-Based Divergence Indicator builds upon the principles of the Vortex Indicator, a well-established tool for gauging momentum and identifying potential trend reversals. However, this innovative indicator goes a step further by focusing on the divergences that can occur between the Vortex Indicator and the actual price movements.
Divergences, which arise when the direction of an indicator's movement contradicts the direction of price action, hold paramount significance within the Vortex-Based Divergence Indicator. By integrating this indicator with other renowned oscillators, such as the Relative Strength Index (RSI) or the Moving Average Convergence Divergence (MACD), traders can augment their analytical capabilities significantly.
These complementary oscillators can corroborate or validate the signals generated by the Vortex-Based Divergence Indicator. For instance, when the Vortex-Based Divergence Indicator hints at a potential trend reversal, cross-referencing this insight with the RSI's overbought or oversold levels can enhance the accuracy of the prediction. Likewise, employing the MACD to confirm momentum shifts in conjunction with the Vortex Indicator's signals can provide a more comprehensive view of market dynamics.
It's crucial to emphasize the importance of synergy when combining these indicators. Rather than relying solely on the Vortex-Based Divergence Indicator, incorporating other oscillators acts as a checks-and-balances system, reducing false signals and enhancing the overall reliability of the trading strategy. However, prudent traders also recognize that no indicator or combination thereof is foolproof. Additional factors, such as fundamental analysis and market news, should also be considered to achieve well-rounded trading decisions.
In essence, the Vortex-Based Divergence Indicator's integration with established oscillators like RSI and MACD offers traders a powerful toolkit to navigate complex market landscapes. By leveraging the strengths of each indicator and cross-referencing their insights, traders can elevate their trading strategies to new heights of accuracy and effectiveness.

Colored VWAP and BarcolorThis indicator plots the Volume Weighted Average Price (VWAP) as well as changes the bar color if the current price is above or below VWAP, for quick visual reference.
Background Information
Straight from TradingView, "Volume Weighted Average Price (VWAP) is a technical analysis tool used to measure the average price weighted by volume. VWAP is typically used with intraday charts as a way to determine the general direction of intraday prices. It's similar to a moving average in that when price is above VWAP, prices are rising and when price is below VWAP, prices are falling. VWAP is primarily used by technical analysts to identify market trend."
About the Indicator
This indicator changes the VWAP line color and bar color based on the current price.
Bar Color
Bullish Up Candle Color = Current price is above VWAP and the close of the candle was greater than the open.
Bullish Down Candle Color = Current price is above VWAP and the close of the candle was less than the open.
Bearish Up Candle Color = Current price is below VWAP and the close of the candle was greater than the open.
Bearish Down Candle Color = Current price is below VWAP and the close of the candle was less than the open.

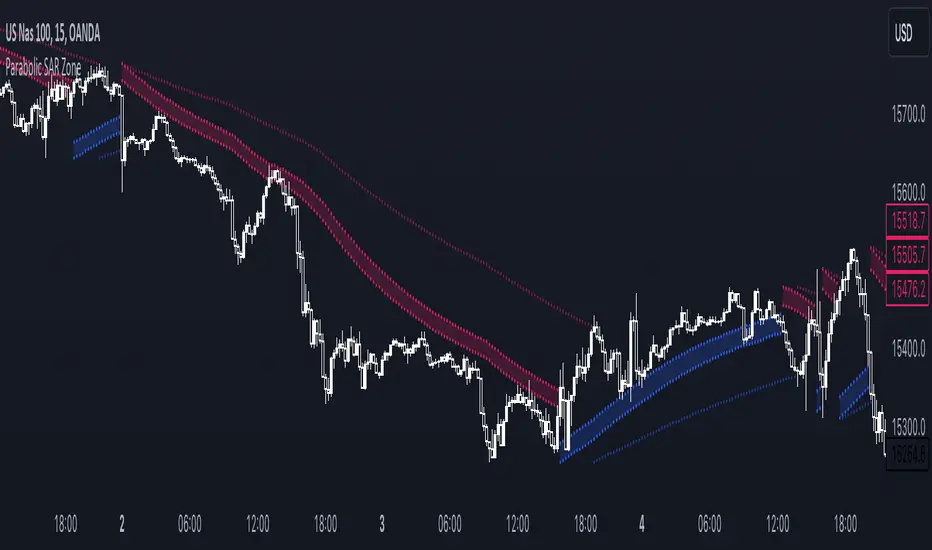
Parabolic SAR ZoneThe Parabolic SAR Zone indicator is a tool designed to help traders identify the best zone to enter in a position revisiting the usage of the standard Parabolic SAR indicator.
In the settings you can choose all the parameters of the standard indicator, and in addition to that you can also change the multiplier for the zone width.
This indicator provides two different Parabolic SAR indicators, the first one has the settings that you chose and displays the zone, meanwhile, the second one has half the parameters you have chosen and can be used to determine the long-term trend direction.
Pro Supertrend CalculatorThis indicator is an adapted version of Julien_Eche's 'Pro Momentum Calculator' tailored specifically for TradingView's 'Supertrend indicator'.
The "Pro Supertrend Calculator" indicator has been developed to provide traders with a data-driven perspective on price movements in financial markets. Its primary objective is to analyze historical price data and make probabilistic predictions about the future direction of price movements, specifically in terms of whether the next candlestick will be bullish (green) or bearish (red). Here's a deeper technical insight into how it accomplishes this task:
1. Supertrend Computation:
The indicator initiates by computing the Supertrend indicator, a sophisticated technical analysis tool. This calculation involves two essential parameters:
- ATR Length (Average True Range Length): This parameter determines the sensitivity of the Supertrend to price fluctuations.
- Factor: This multiplier plays a pivotal role in establishing the distance between the Supertrend line and prevailing market prices. A higher factor value results in a more significant separation.
2. Supertrend Visualization:
The Supertrend values derived from the calculation are meticulously plotted on the price chart, manifesting as two distinct lines:
- Green Line: This line represents the Supertrend when it indicates a bullish trend, signifying an anticipation of rising prices.
- Red Line: This line signifies the Supertrend in bearish market conditions, indicating an expectation of falling prices.
3. Consecutive Candle Analysis:
- The core function of the indicator revolves around tracking successive candlestick patterns concerning their relationship with the Supertrend line.
- To be included in the analysis, a candlestick must consistently close either above (green candles) or below (red candles) the Supertrend line for multiple consecutive periods.
4.Labeling and Enumeration:
- To communicate the count of consecutive candles displaying uniform trend behavior, the indicator meticulously applies labels to the price chart.
- The positioning of these labels varies based on the direction of the trend, residing either below (for bullish patterns) or above (for bearish patterns) the candlestick.
- The color scheme employed aligns with the color of the candle, using green labels for bullish candles and red labels for bearish ones.
5. Tabular Data Presentation:
- The indicator augments its graphical analysis with a customizable table prominently displayed on the chart. This table delivers comprehensive statistical insights.
- The tabular data comprises the following key elements for each consecutive period:
a. Consecutive Candles: A tally of the number of consecutive candles displaying identical trend characteristics.
b. Candles Above Supertrend: A count of candles that remained above the Supertrend during the sequential period.
3. Candles Below Supertrend: A count of candles that remained below the Supertrend during the sequential period.
4. Upcoming Green Candle: An estimation of the probability that the next candlestick will be bullish, grounded in historical data.
5. Upcoming Red Candle: An estimation of the probability that the next candlestick will be bearish, based on historical data.
6. Tailored Configuration:
To accommodate diverse trading strategies and preferences, the indicator offers extensive customization options. Traders can fine-tune parameters such as ATR length, factor, label and table placement, and table size to align with their unique trading approaches.
In summation, the "Pro Supertrend Calculator" indicator is an intricately designed tool that leverages the Supertrend indicator in conjunction with historical price data to furnish traders with an informed outlook on potential future price dynamics, with a particular emphasis on the likelihood of specific bullish or bearish candlestick patterns stemming from consecutive price behavior.

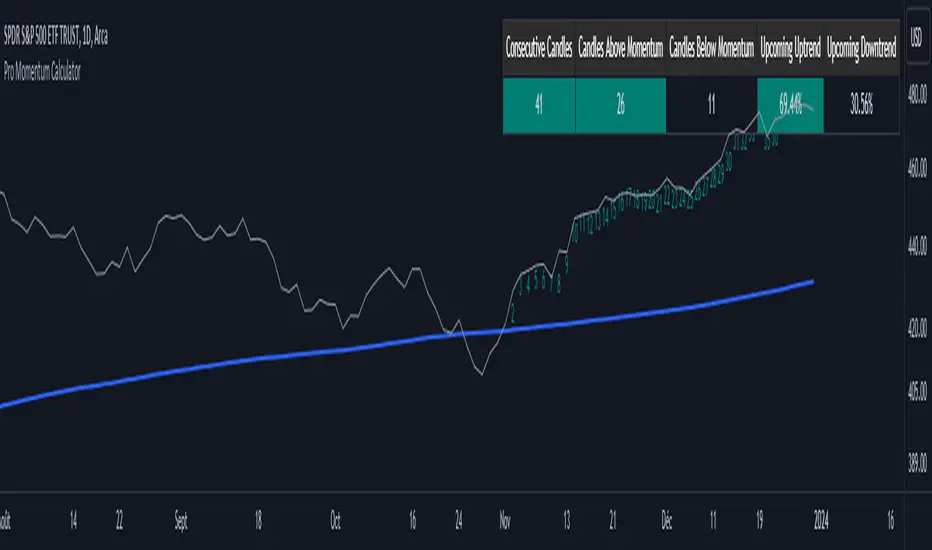
Pro Momentum CalculatorThe Pro Momentum Calculator Indicator is a tool for traders seeking to gauge market momentum and predict future price movements. It achieves this by counting consecutive candle periods above or below a chosen Simple Moving Average (SMA) and then providing a percentage-based probability for the direction of the next candle.
Here's how this principle works:
1. Counting Consecutive Periods: The indicator continuously tracks whether the closing prices of candles are either above or below the chosen SMA.
- When closing prices are above the SMA, it counts consecutive periods as "green" or indicating potential upward momentum.
- When closing prices are below the SMA, it counts consecutive periods as "red" or suggesting potential downward momentum.
2. Assessing Momentum: By monitoring these consecutive periods, the indicator assesses the strength and duration of the current market trend.
This is important information for traders looking to understand the market's behavior.
3. Predicting the Next Candle: Based on the historical data of consecutive green and red periods, the indicator calculates a percentage probability for the direction of the next candle:
- If there have been more consecutive green periods, it suggests a higher likelihood of the next candle being green (indicating a potential upward movement).
- If there have been more consecutive red periods, it suggests a higher likelihood of the next candle being red (indicating a potential downward movement).
The Pro Momentum Calculator indicator's versatility makes it suitable for a wide range of financial markets, including stocks, Forex, indices, commodities, cryptocurrencies...
Omega IndicatorThe Omega Trend and Signal indicator is a toolkit designed to help both experienced and new traders with their trading decisions.
This indicator is a part of the omega toolkit, and his creation method is based on the concept that every trading strategy should have a way to determine the trend, or the bias, that answers the question “long or short?”; the location, which identifies the best price level to enter into a position and to exit, both in profit and in loss, and that will decide the final risk-to-reward ratio of the trade you take; the signal, which is useful to determine the best moment to enter into a position and that if paired with the trend point, his purpose is to identify when the large trend picture is in confluence with the small term; and last but not least the filter point, the filter is used to have another way to have an additional confluence with the trade you want to take, and it’s important to reduce the number of false signals and to increase the win rate.
This tool aims to help traders with the identification of the trend and the signal points, based on a large number of different formula that works combined to display the final output. It’s important to note that indicator and technical analysis is only one of the several different ways to analyze an asset.
One of the main things to keep in mind when working with the financial markets is that not every asset, every historical phase, and every market condition is the same, this is why this tool can be highly personalized and adjustable and provide different overlay tools in order to allow traders to choose the best settings considering this variable and your backtests.
This tool, thanks to the previously cited characteristics, can work on any market and any horizontal time frame, and it has different features:
- Both Trends following and Mean Reversal usage: with different trend detection and signal formulas (not to be followed blindly like any other indicator or trading method).
- Minimalistic usage: with easy-to-enable functions both functionally and aesthetically, to keep your charts clean and to give you the power to choose only what you want to use this indicator for.
- Candle coloring: the easiest way to identify the trend current situation based on the technical formula, with the color you have chosen, and with 5 different variations: strong sell, sell (same color of strong sell but less opacity), neutral, buy, strong buy (same color of buy with more opacity).
- Automatic signal coloring, that will change the way the signals are visualized based on the mid-term trend condition, giving you both entry and exit suggested signals.
- Trend signals: an option that will display the signal based on the same algorithm that works for the candle coloring, but visualizing only the most significant trend changes
- Signal filters, that works differently for trend following and for mean reversal settings, and are divided into three different categories: additional filters remove the repetitive signals in the trend following usage and the low volume signals in the mean reversal usage; location filter remove the signal that is over/below the current trend fair value, giving you only premium or discount signal based on the direction of the trade; and the confluence filter, that for trend following usage filter out signal not in confluence with the Trend cloud overlay indicator and for mean reversal keeps only the signal that is at least in the first band of the Extreme zones overlay indicator.
- Signal sensitivity optimization with the “Fast length” parameter, with base value “1” you can choose the multiplier for that parameter.
- Trend detection optimization with the “Slow length” parameter, with base value “1” you can choose the multiplier for that parameter.
- Overlay indicator optimization with the “Trend length” parameter, with base value “1” you can choose the multiplier for that parameter.
- 4 Overlay indicator to keep the analysis simple and to assist traders to see the trend clearer and identifying the best zones and conditions to enter a trade.
- The option to visualize as numbers that go from 0 to 10 the current trend strength based on the settings to want to use and calculated with the historical best number that has been displayed (it’s shown under the last candles, only if you have selected the trend following or the mean reversal settings).
- Automatic alerts for Buy and Sell signals based on the settings and the filter that you have chosen.
- The option to show only some parts of the indicator, such as the signals or the candle coloring.
- Heikin Ashi: a modified and more simple version of the classic Heikin Ashi candle that is not realistic on the market when used improperly. This option enables the overlay of the candle with the same high, low, and close of the original candle, but the open is the average of the previous open and the previous close.
The signals work this way: if the script has detected a buy signal if the current trend strength is in confluence with the signal, you’ll see a colored dot under the candle (or over if it’s sell), but if the signal is not in confluence, you’ll see a gray (or the color you have chosen for neutral color settings) mark in the same location, so under the candle, if it’s a buy signal not supported by the trend and over the candle if it’s a sell signals not in confluence with the trend parameters, and in this cases the signals aim to suggest to close your open opposite position. This works both for Trend following and for Mean reversal usage.
In this image, there are enable the Adaptive Zone and the Extreme Zones overlay indicators, with the Mean Reversal candle coloring and signal usage.
As you can see, the Extreme Zones are designed to give with a complex script the zones in which the price is likely to reverse, of course depending on the market condition and asset.
The Adaptive Zone is a modified version of the popular super trend indicator, and is designed to work in a different way: instead of giving a buy and sell signal at the switch of the direction, this tool gives its best when used as an area of support and resistance to enter a trade with a bigger risk to reward ratio.
In these other photos, you can see the Trend Midline and the Trend Cloud overlay indicators, with the Trend Following candle coloring and signal usage.
The Trend Midline is a powerful tool that includes different calculations inside and can work like a moving average to identify the level of support and resistance, take profit and stop loss. In addition to that, the Trend Midline overlay indicator is colored based on a large number of different indicators that display the final output as colors, this way, whenever the indicator is colored as the positive color (blue by default) you’ll have another confirmation that the trend is bullish, and vice versa.
The Trend Cloud is a modified version of the popular Ichimoku Kumo, created to help traders identify the trend direction the best. Another great way to use this tool is to mark a horizontal line at the price level in which the two lines of the indicator have switched in position to identify potential future levels of support and resistance.
Risk Disclaimer:
All content and scripts provided are purely for informational & educational purposes only and do not constitute financial advice or a solicitation to buy or sell any securities of any type. Past performance does not guarantee future results. Trading can lead to a loss of the invested capital in the financial markets. I will not accept liability for any loss or damage, including without limitation any loss of profit, which may arise directly or indirectly from the use of or reliance on such information. All investments involve risk, and the past performance of a security, industry, sector, market, financial product, trading strategy, backtest, or individual's trading does not guarantee future results or returns. Investors are fully responsible for any investment decisions they make. Such decisions should be based solely on an evaluation of their financial circumstances, investment objectives, risk tolerance, and liquidity needs.

Trig-Log Scaled Momentum OscillatorTaylor Series Approximations for Trigonometry:
1. The indicator starts by calculating sine and cosine values of the close price using Taylor Series approximations. These approximations use polynomial terms to estimate the values of these trigonometric functions.
Mathematical Component Formation:
2. The calculated sine and cosine values are then multiplied together. This gives us the primary mathematical component, termed as the 'trigComponent'.
Smoothing Process:
3. To ensure that our indicator is less susceptible to market noise and more reactive to genuine price movements, this 'trigComponent' undergoes a smoothing process using a simple moving average (SMA). The length of this SMA is defined by the user.
Logarithmic Transformation:
4. With our smoothed value, we apply a natural logarithm approximation. Again, this approximation is based on the Taylor expansion. This step ensures that all resultant values are positive and offers a different scale to interpret the smoothed component.
Dynamic Scaling:
5. To make our indicator more readable and comparable over different periods, the logarithmically transformed values are scaled between a range. This range is determined by the highest and lowest values of the transformed component over the user-defined 'lookback' period.
ROC (Rate of Change) Direction:
6. The direction of change in our scaled value is determined. This offers a quick insight into whether our mathematical component is increasing or decreasing compared to the previous value.
Visualization:
7. Finally, the indicator plots the dynamically scaled and smoothed mathematical component on the chart. The color of the plotted line depends on its direction (increasing or decreasing) and its boundary values.

White NoiseThe "White Noise" indicator is designed to visualize the dispersion of price movements around a moving average, providing insights into market noise and potential trend changes. It highlights periods of increased volatility or noise compared to the underlying trend.
Code Explanation:
Inputs:
mlen: Input for the length of the noise calculation.
hlen: Input for the length of the Hull moving average.
col_up: Input for the color of the up movement.
col_dn: Input for the color of the down movement.
Calculations:
ma: Calculate the simple moving average of the high, low, and close prices (hlc3) over the specified mlen period.
dist: Calculate the percentage distance between the hlc3 and the moving average ma, then scale it by 850. This quantifies the deviation from the moving average as a value.
sm: Smooth the calculated dist values using a weighted moving average (WMA) twice, with different weights, and subtract one from the other. This provides a smoothed representation of the dispersion.
Coloring:
col_wn: Determine the color of the bars based on whether dist is positive or negative and whether it's greater or less than the smoothed sm value. This creates color-coded columns indicating upward or downward movements with varying opacity.
col_switch: Define the color for the current trend state. It switches color when the smoothed sm crosses above or below its previous value, indicating potential trend changes.
col_switch2: Define the color for the horizontal line that separates the two trend states. It switches color based on the same crossover and crossunder conditions as col_switch.
Plots:
plot(dist): Plot the dispersion values as columns with color defined by col_wn.
plot(sm): Plot the smoothed dispersion line with a white color and thicker linewidth.
plot(sm ): Plot the previous smoothed dispersion value with a lighter white color to create a visual distinction.
Usage:
This indicator can help traders identify periods of increased market noise, visualize potential trend reversals, and assess the strength of price movements around the moving average. The colored columns and smoothed line offer insights into the ebb and flow of market sentiment, aiding in decision-making.
ps. This can be used as a long-term TPI component if you dabble in Modern Portfolio Theory (MPT)
Recommended for timeframes on the 1D or above:

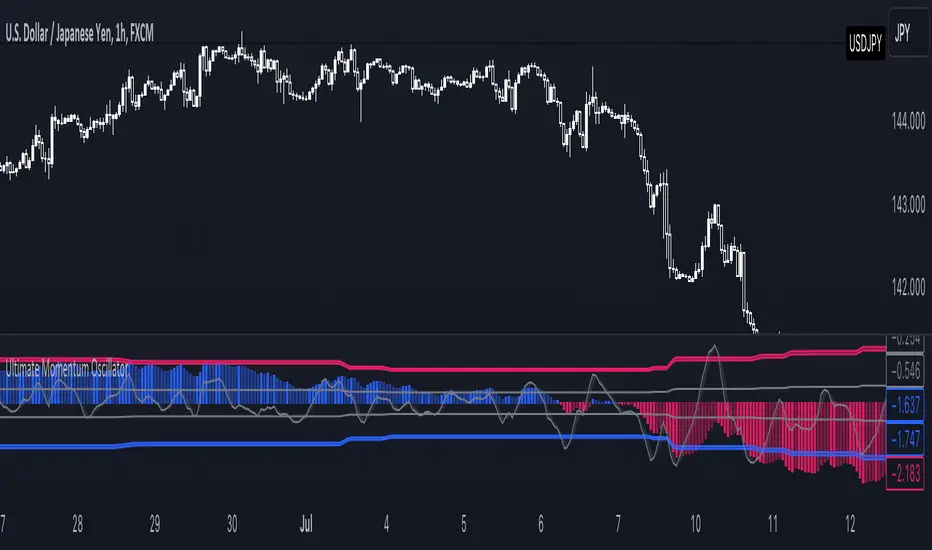
Ultimate Momentum OscillatorThe Ultimate Momentum Oscillator is a tool designed to help traders identify the current trend direction and the momentum of the prices.
This oscillator is composed of one histogram and one line, paired with the two overbought and the two oversold levels.
The histogram is a trend-based algorithm that allows the user to read the market bias with multiple trend lengths combined.
The line is a momentum-based formula that allows traders to identify potential reversal and the speed of the price.
This tool can be used to:
- Identify the current trend direction
- Identify the momentum of the price
- Identify oversold and overbought levels
LNL Trend SystemLNL Trend System is an ATR based day trading system specifically designed for intra-day traders and scalpers. The System works on any chart time frame & can be applied to any market. The study consist of two components - the Trend Line and the Stop Line. Trend System is based on a special ATR calculation that is achieved by combining the previous values of the 13 EMA in relation to the ATR which creates a line of deviations that visually look similar to the basic moving average but actually produce very different results ESPECIALLY in sideways market.
Trend Line:
Trend Line is a simple line which is basically a fast gauge represented by the 13 EMA that can change the color based on the current trend structure defined by multiple averages (8,13,21,34 EMAs). Trend Line is there to simply add the confluence for the current trend. Colors of the line are pretty much self-explanatory. Whenever the line turns red it states that the current structure is bearish. Vice versa for green line. Gray line represents neutral market structure.
Stop Line:
Stop Line is an ATR deviaton line with special calculation based on the previous bar ATRs and position of the price in relation to the current and previous values of 13 EMA. As already stated, this creates an ATR deviation marker either above or below the price that trails the price up or down until they touch. Whenever the price comes into the Stop Line it means it is making an ATR expansion move up or down .This touch will usually resolve into a reaction (a bounce) which provides trade opportunities.
Trend Bars:
When turned ON, Trend Bars can provide additional confulence of the current trend alongside with the Trend Line color. Trend Bars are based on the DMI and ADX indicators. Whenever the DMI is bearish and ADX is above 20 the candles paint themselfs red. And vice versa applies for the green candles and bullish DMI. Whenever the ADX falls below the 20, candles are netural (Gray) which means there is no real trend in place at the moment.
Trend Mode:
There are total of 5 different trend modes available. Each mode is visualizing different ATR settings which provides either aggressive or more conservative approach. The more tigher the mode, the more closer the distance between the price and the Stop Line. First two modes were designed for slower markets, whereas the "Loose" and "FOMC" modes are more suitable for products with high volatility.
Trend Modes:
1. Tight
Ideal for the slowest markets. Slowest market can be any market with unusually small average true range values or just simply a market that does have a personality of a "sleeper". Tight Mode can be also used for aggresive entries in the most ridiculous trends. Sometimes price will barely pullback to the Trend Line not even the Stop Line.
2. Normal
Normal Mode is the golden mean between the modes. "Normal" provides the ideal ATR lengths for the most used markets such as S&P Futures (ES) or SPY, AAPL and plenty of other highly popular stocks. More often than not, the length of this mode is respected considering there is no breaking news or high impact market event scheduled.
3. Loose
The "Loose" mode is basically a normal mode but a little bit more loose. This mode is useful whenever the ATRs jump higher than usual or during the days of highly anticipated news events. This mode is also better suited for more active markets such as NQ futures.
4. FOMC
The FOMC mode is called FOMC for a reason. This mode provides the maximum amount of wiggle room between the price and the Stop Line. This mode was designed for the extreme volatility, breaking news events or post-FOMC trading. If the market quiets down, this mode will not get the Stop Line touch as frequently as othete modes, thus it is not very useful to run this on markets with the average volatlity. Although never properly tested, perhaps the FOMC mode can find its value in the crypto market?
5. The Net
The net mode is basically a combination of all modes into one stop line system which creates "the net" effect. The Net provides the widest Stop Line zone which can be mainly appreciated by traders that like to use scale-in scale-out methods for their trading. Not to mention the visual side of the indicator which looks pretty great with the net mode on.
HTF (Higher Time Frame) Trend System:
The system also includes additional higher time frame (HTF) trend system. This can be set to any time frame by manual HTF mode. HTF mode set to "auto" will automatically choose the best suitable higher time frame trend system based on how appropriate the aggregation is. For everything below 5min the HTF Trend System will stay on 5min. Anything between 5-15min = 30min. 30min - 120min will turn on the 240min. 180min and higher will result in Daily time frame. Anything above the Daily will result in Weekly HTF aggregation, above W = Monthly, above M = Quarterly.
Background Clouds:
In terms of visualization, each trend system is fully customizable through the inputs settings. There is also an option to turn on/off the background clouds behind the stop lines. These clouds can make the charts more clean & visible.
Tips & Tricks:
1. Different Trend Modes
Try out different modes in different markets. There is no one single mode that will fit to everyone on the same type of market. I myself actually prefer more Loose than the Normal.
2. Stop Line Mirroring
Whenever the Stop Lines start to mirror each other (there is one above the price and one below) this means the price is entering a ranging sideways market. It does not matter which Stop Line will the price touch first. They can both be faded until one of them flips.
3. Signs of the Ranging Market
Watch out for signs of ranging market. Whenever the Trend System looses its colors whether on trend line or trend bars, if everything turns neutral (gray) that is usually a solid indication of a range type action for the following moments. Also as already stated before, the Stop Line mirroring is a good sign of the range market.
4. Trailing Tool, Trend System as an Additional Study?
In case you are not a fan of the colorful green / red charts & candles. You can switch all of them off and just leave the Stop Line on. This way you can use the benefits of the trend system and still use other studies on top of that. Similarly as the Parabolic SAR is often used.
5. The Flip Setup
One of my favorite trades is the Flip Setup on the 5min charts. Whenever the Stop Line is broken , the very first opposing touch after the Trend System flips is a usually a highly participated touch. If there is a strong reaction, this means this is likely a beginning of a new trend. Once I am in the position i like to trail the Stop Line on the 1min charts.
Hope it helps.

RenkoIndicatorIntroduction:
The Renko Indicator is a powerful tool designed to help traders identify trends and potential trade opportunities in the financial markets. This indicator overlays a Renko chart on the main price chart and generates Buy and Sell signals based on Renko brick movements. Renko charts are unique in that they focus solely on price movements, ignoring the element of time. In this guide, we will walk you through how to use the Renko Indicator effectively in your trading strategy.
Indicator Components:
The Renko Indicator consists of several components, each serving a specific purpose in aiding your trading decisions.
Market Sentiment Calculation:
At the top of the script, the indicator calculates market sentiment by analyzing recent price action. It determines whether the market sentiment is Bullish, Bearish, or Neutral based on the highest and lowest prices within specific time periods. This information provides you with a broader context for potential trading decisions.
Renko Chart Creation:
The indicator creates a Renko chart overlay on the main price chart using the Average True Range (ATR) method. ATR is used to calculate the brick size for the Renko chart, allowing you to adjust the sensitivity of the chart to price movements.
Renko Open and Close Midpoint:
The script plots the midpoint of Renko open and close prices as a line on the main chart. This visualization helps you understand the direction of Renko bricks and identify trends.
Buy and Sell Signal Generation:
The script generates Buy and Sell signals as label shapes on the chart. A Buy signal is generated when the Renko close price crosses above the Renko open price, indicating potential upward momentum. Conversely, a Sell signal is generated when the Renko close price crosses below the Renko open price, suggesting potential downward momentum.
Alert Conditions:
To ensure you never miss a trading opportunity, the script sets up alert conditions for Buy and Sell signals. These alerts notify you when the specified conditions for potential trades are met. Alerts can be customized to your preference, allowing you to receive notifications via your chosen communication channels.
How to Use the Renko Indicator:
Market Sentiment Analysis:
Start by analyzing the calculated market sentiment. This information helps you understand the broader trend in the market. A Bullish sentiment indicates potential upward movement, a Bearish sentiment suggests potential downward movement, and a Neutral sentiment signals uncertainty.
Renko Chart Interpretation:
Observe the Renko chart overlay and its midpoint line. Upward-trending Renko bricks suggest Bullish momentum, while downward-trending bricks indicate Bearish momentum. Use the Renko chart to identify trends and confirm your trading bias.
Buy and Sell Signals:
Pay close attention to the Buy and Sell signals generated by the indicator. A Buy signal occurs when the Renko close price crosses above the Renko open price. Conversely, a Sell signal occurs when the Renko close price crosses below the Renko open price. These signals highlight potential entry points for trades.
Alert Notifications:
Make use of the alert conditions to receive real-time notifications for Buy and Sell signals. Alerts help you stay informed even when you're not actively watching the charts, allowing you to promptly take action on potential trade opportunities.
Risk Management and Considerations:
Confirmation: While the Renko Indicator provides valuable insights, it's crucial to use it in conjunction with other technical and fundamental analysis tools for confirmation.
Backtesting: Before implementing the indicator in live trading, conduct thorough backtesting on historical data to assess its performance and suitability for your trading strategy.
Position Sizing: Determine appropriate position sizes based on your risk tolerance and the signals provided by the indicator. Avoid overleveraging your trades.
Market Conditions: Be mindful of market conditions and news events that could impact price movements. Use the Renko Indicator as a tool to enhance your decision-making process, not as a standalone strategy.
Conclusion:
The Renko Indicator offers a unique perspective on price movements and can be a valuable addition to your trading toolkit. By analyzing market sentiment, interpreting Renko chart patterns, and acting on Buy and Sell signals, you can make informed trading decisions. Remember to practice proper risk management and integrate the Renko Indicator into a comprehensive trading strategy to achieve consistent and successful trading outcomes.
