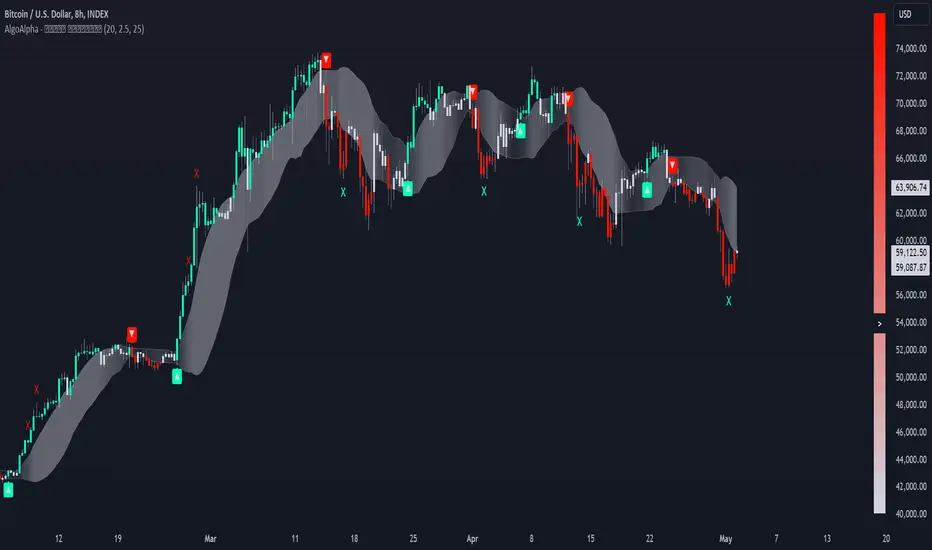
Swing Failure Zones and Signals [AlgoAlpha]Elevate your trading strategy with the Swing Failure Zones and Signals indicator by AlgoAlpha! This powerful tool helps you identify potential swing failure zones, offering clear bullish and bearish signals to guide your trading decisions. 📈💡
🎨 Bullish/Bearish Color Customization : Easily set the colors for bullish and bearish signals to match your chart preferences.
🧹 Mitigated Zone Removal : Option to remove mitigated zones from the chart for a cleaner view.
🔍 Range High/Low Lookback : Adjustable lookback period for determining significant highs and lows.
🖌 Dynamic Zone Creation : Automatically draws zones based on swing failure criteria.
🔔 Alert Conditions : Set alerts for both bullish and bearish swing failure conditions to stay informed without constant monitoring.
Quick Guide to Using the Swing Failure Zones and Signals Indicator
🛠 Add the Indicator : Search for "Swing Failure Zones and Signals " in TradingView's Indicators & Strategies. Customize settings like lookback period, colors, and zone removal options to fit your trading style.
📊 Market Analysis : Watch for the appearance of the zones and the directional arrows for potential reversal signals. Use these signals to identify key market entries and exits.
🔔 Alerts : Enable alerts for bullish and bearish swing failure conditions to capture trading opportunities without constant chart monitoring.
How it works
The indicator calculates the direction and length of each candle to identify swing failure points by comparing current high and low prices with those from the lookback period. A bullish swing failure is detected when the current low is lower than the previous low and the close is higher than the previous high, while a bearish swing failure occurs when the current high is higher than the previous high and the close is lower than the previous low. Upon detection, the script creates zones on the chart to indicate these failure points and manages them by removing invalidated zones based on the user's settings. Visual signals are plotted on the chart as arrows, and alerts are set for these conditions to help traders capture potential entry opportunities efficiently.
Enhance your trading edge with this robust tool designed to spotlight critical swing failure points in the market! 💪📈
Trendfollowing

AlgoBuilder [Trend-Following] | FractalystWhat's the strategy's purpose and functionality?
This strategy is designed for both traders and investors looking to rely on and trade based on historical and backtested data using automation. The main goal is to build profitable trend-following strategies that outperform the underlying asset in terms of returns while minimizing drawdown. For example, as for a benchmark, if the S&P 500 (SPX) has achieved an estimated 10% annual return with a maximum drawdown of -57% over the past 20 years, using this strategy with different entry and exit techniques, users can potentially seek ways to achieve a higher Compound Annual Growth Rate (CAGR) while maintaining a lower maximum drawdown.
Although the strategy can be applied to all markets and timeframes, it is most effective on stocks, indices, future markets, cryptocurrencies, and commodities and JPY currency pairs given their trending behaviors.
In trending market conditions, the strategy employs a combination of moving averages and diverse entry models to identify and capitalize on upward market movements. It integrates market structure-based trailing stop-loss mechanisms across different timeframes and provides exit techniques, including percentage-based and risk-reward (RR) based take profit levels.
Additionally, the strategy has also a feature that includes a built-in probability and sentiment function for traders who want to implement probabilities and market sentiment right into their trading strategies.
Performance summary, weekly, and monthly tables enable quick visualization of performance metrics like net profit, maximum drawdown, compound annual growth rate (CAGR), profit factor, average trade, average risk-reward ratio (RR), and more. This aids optimization to meet specific goals and risk tolerance levels effectively.
-----
How does the strategy perform for both investors and traders?
The strategy has two main modes, tailored for different market participants: Traders and Investors.
Trading:
1. Trading (1x):
- Designed for traders looking to capitalize on bullish trending markets.
- Utilizes a percentage risk per trade to manage risk and optimize returns.
- Suitable for active trading with a focus on trend-following and risk management.
- (1x) This mode ensures no stacking of positions, allowing for only one running position or trade at a time.
◓: Mode | %: Risk percentage per trade
2. Trading (2x):
Similar to the 1x mode but allows for two pyramiding entries.
This approach enables traders to increase their position size as the trade moves in their favor, potentially enhancing profits during strong bullish trends.
◓: Mode | %: Risk percentage per trade
3. Investing:
- Geared towards investors who aim to capitalize on bullish trending markets without using leverage while mitigating the asset's maximum drawdown.
- Utilizes 100% of the equity to buy, hold, and manage the asset.
- Focuses on long-term growth and capital appreciation by fully investing in the asset during bullish conditions.
- ◓: Mode | %: Risk not applied (In investing mode, the strategy uses 100% of equity to buy the asset)
-----
What's the purpose of using moving averages in this strategy? What are the underlying calculations?
Using moving averages is a widely-used technique to trade with the trend.
The main purpose of using moving averages in this strategy is to filter out bearish price action and to only take trades when the price is trading ABOVE specified moving averages.
The script uses different types of moving averages with user-adjustable timeframes and periods/lengths, allowing traders to try out different variations to maximize strategy performance and minimize drawdowns.
By applying these calculations, the strategy effectively identifies bullish trends and avoids market conditions that are not conducive to profitable trades.
The MA filter allows traders to choose whether they want a specific moving average above or below another one as their entry condition.
This comparison filter can be turned on (>/<) or off.
For example, you can set the filter so that MA#1 > MA#2, meaning the first moving average must be above the second one before the script looks for entry conditions. This adds an extra layer of trend confirmation, ensuring that trades are only taken in more favorable market conditions.
MA #1: Fast MA | MA #2: Medium MA | MA #3: Slow MA
⍺: MA Period | Σ: MA Timeframe
-----
What entry modes are used in this strategy? What are the underlying calculations?
The strategy by default uses two different techniques for the entry criteria with user-adjustable left and right bars: Breakout and Fractal.
1. Breakout Entries :
- The strategy looks for pivot high points with a default period of 3.
- It stores the most recent high level in a variable.
- When the price crosses above this most recent level, the strategy checks if all conditions are met and the bar is closed before taking the buy entry.
◧: Pivot high left bars period | ◨: Pivot high right bars period
2. Fractal Entries :
- The strategy looks for pivot low points with a default period of 3.
- When a pivot low is detected, the strategy checks if all conditions are met and the bar is closed before taking the buy entry.
◧: Pivot low left bars period | ◨: Pivot low right bars period
By utilizing these entry modes, the strategy aims to capitalize on bullish price movements while ensuring that the necessary conditions are met to validate the entry points.
-----
What type of stop-loss identification method are used in this strategy? What are the underlying calculations?
Initial Stop-Loss:
1. ATR Based:
The Average True Range (ATR) is a method used in technical analysis to measure volatility. It is not used to indicate the direction of price but to measure volatility, especially volatility caused by price gaps or limit moves.
Calculation:
- To calculate the ATR, the True Range (TR) first needs to be identified. The TR takes into account the most current period high/low range as well as the previous period close.
The True Range is the largest of the following:
- Current Period High minus Current Period Low
- Absolute Value of Current Period High minus Previous Period Close
- Absolute Value of Current Period Low minus Previous Period Close
- The ATR is then calculated as the moving average of the TR over a specified period. (The default period is 14).
Example - ATR (14) * 1.5
⍺: ATR period | Σ: ATR Multiplier
2. ADR Based:
The Average Day Range (ADR) is an indicator that measures the volatility of an asset by showing the average movement of the price between the high and the low over the last several days.
Calculation:
- To calculate the ADR for a particular day:
- Calculate the average of the high prices over a specified number of days.
- Calculate the average of the low prices over the same number of days.
- Find the difference between these average values.
- The default period for calculating the ADR is 14 days. A shorter period may introduce more noise, while a longer period may be slower to react to new market movements.
Example - ADR (14) * 1.5
⍺: ADR period | Σ: ADR Multiplier
Application in Strategy:
- The strategy calculates the current bar's ADR/ATR with a user-defined period.
- It then multiplies the ADR/ATR by a user-defined multiplier to determine the initial stop-loss level.
By using these methods, the strategy dynamically adjusts the initial stop-loss based on market volatility, helping to protect against adverse price movements while allowing for enough room for trades to develop.
Trailing Stop-Loss:
One of the key elements of this strategy is its ability to detec buyside and sellside liquidity levels across multiple timeframes to trail the stop-loss once the trade is in running profits.
By utilizing this approach, the strategy allows enough room for price to run.
There are two built-in trailing stop-loss (SL) options you can choose from while in a trade:
1. External Trailing Stop-Loss:
- Uses sell-side liquidity to trail your stop-loss, allowing price to consolidate before continuation. This method is less aggressive and provides more room for price fluctuations.
Example - External - Wick below the trailing SL - 12H trailing timeframe
⍺: Exit type | Σ: Trailing stop-loss timeframe
2. Internal Trailing Stop-Loss:
- Uses the most recent swing low with a period of 2 to trail your stop-loss. This method is more aggressive compared to the external trailing stop-loss, as it tightens the stop-loss closer to the current price action.
Example - Internal - Close below the trailing SL - 6H trailing timeframe
⍺: Exit type | Σ: Trailing stop-loss timeframe
Each market behaves differently across various timeframes, and it is essential to test different parameters and optimizations to find out which trailing stop-loss method gives you the desired results and performance.
-----
What type of break-even and take profit identification methods are used in this strategy? What are the underlying calculations?
For Break-Even:
- You can choose to set a break-even level at which your initial stop-loss moves to the entry price as soon as it hits, and your trailing stop-loss gets activated (if enabled).
- You can select either a percentage (%) or risk-to-reward (RR) based break-even, allowing you to set your break-even level as a percentage amount above the entry price or based on RR.
For TP1 (Take Profit 1):
- You can choose to set a take profit level at which your position gets fully closed or 50% if the TP2 boolean is enabled.
- Similar to break-even, you can select either a percentage (%) or risk-to-reward (RR) based take profit level, allowing you to set your TP1 level as a percentage amount above the entry price or based on RR.
For TP2 (Take Profit 2):
- You can choose to set a take profit level at which your position gets fully closed.
- As with break-even and TP1, you can select either a percentage (%) or risk-to-reward (RR) based take profit level, allowing you to set your TP2 level as a percentage amount above the entry price or based on RR.
The underlying calculations involve determining the price levels at which these actions are triggered. For break-even, it moves the initial stop-loss to the entry price and activate the trailing stop-loss once the break-even level is reached.
For TP1 and TP2, it's specifying the price levels at which the position is partially or fully closed based on the chosen method (percentage or RR) above the entry price.
These calculations are crucial for managing risk and optimizing profitability in the strategy.
⍺: BE/TP type (%/RR) | Σ: how many RR/% above the current price
-----
What's the ADR filter? What does it do? What are the underlying calculations?
The Average Day Range (ADR) measures the volatility of an asset by showing the average movement of the price between the high and the low over the last several days.
The period of the ADR filter used in this strategy is tied to the same period you've used for your initial stop-loss.
Users can define the minimum ADR they want to be met before the script looks for entry conditions.
ADR Bias Filter:
- Compares the current bar ADR with the ADR (Defined by user):
- If the current ADR is higher, it indicates that volatility has increased compared to ADR (DbU).(⬆)
- If the current ADR is lower, it indicates that volatility has decreased compared to ADR (DbU).(⬇)
Calculations:
1. Calculate ADR:
- Average the high prices over the specified period.
- Average the low prices over the same period.
- Find the difference between these average values in %.
2. Current ADR vs. ADR (DbU):
- Calculate the ADR for the current bar.
- Calculate the ADR (DbU).
- Compare the two values to determine if volatility has increased or decreased.
By using the ADR filter, the strategy ensures that trades are only taken in favorable market conditions where volatility meets the user's defined threshold, thus optimizing entry conditions and potentially improving the overall performance of the strategy.
>: Minimum required ADR for entry | %: Current ADR comparison to ADR of 14 days ago.
-----
What's the probability filter? What are the underlying calculations?
The probability filter is designed to enhance trade entries by using buyside liquidity and probability analysis to filter out unfavorable conditions.
This filter helps in identifying optimal entry points where the likelihood of a profitable trade is higher.
Calculations:
1. Understanding Swing highs and Swing Lows
Swing High: A Swing High is formed when there is a high with 2 lower highs to the left and right.
Swing Low: A Swing Low is formed when there is a low with 2 higher lows to the left and right.
2. Understanding the purpose and the underlying calculations behind Buyside, Sellside and Equilibrium levels.
3. Understanding probability calculations
1. Upon the formation of a new range, the script waits for the price to reach and tap into equilibrium or the 50% level. Status: "⏸" - Inactive
2. Once equilibrium is tapped into, the equilibrium status becomes activated and it waits for either liquidity side to be hit. Status: "▶" - Active
3. If the buyside liquidity is hit, the script adds to the count of successful buyside liquidity occurrences. Similarly, if the sellside is tapped, it records successful sellside liquidity occurrences.
5. Finally, the number of successful occurrences for each side is divided by the overall count individually to calculate the range probabilities.
Note: The calculations are performed independently for each directional range. A range is considered bearish if the previous breakout was through a sellside liquidity. Conversely, a range is considered bullish if the most recent breakout was through a buyside liquidity.
Example - BSL > 50%
-----
What's the sentiment Filter? What are the underlying calculations?
Sentiment filter aims to calculate the percentage level of bullish or bearish fluctuations within equally divided price sections, in the latest price range.
Calculations:
This filter calculates the current sentiment by identifying the highest swing high and the lowest swing low, then evenly dividing the distance between them into percentage amounts. If the price is above the 50% mark, it indicates bullishness, whereas if it's below 50%, it suggests bearishness.
Sentiment Bias Identification:
Bullish Bias: The current price is trading above the 50% daily range.
Bearish Bias: The current price is trading below the 50% daily range.
Example - Sentiment Enabled | Bullish degree above 50% | Bullish sentimental bias
>: Minimum required sentiment for entry | %: Current sentimental degree in a (Bullish/Bearish) sentimental bias
-----
What's the range length Filter? What are the underlying calculations?
The range length filter identifies the price distance between buyside and sellside liquidity levels in percentage terms. When enabled, the script only looks for entries when the minimum range length is met. This helps ensure that trades are taken in markets with sufficient price movement.
Calculations:
Range Length (%) = ( ( Buyside Level − Sellside Level ) / Current Price ) ×100
Range Bias Identification:
Bullish Bias: The current range price has broken above the previous external swing high.
Bearish Bias: The current range price has broken below the previous external swing low.
Example - Range length filter is enabled | Range must be above 5% | Price must be in a bearish range
>: Minimum required range length for entry | %: Current range length percentage in a (Bullish/Bearish) range
-----
What's the day filter Filter, what does it do?
The day filter allows users to customize the session time and choose the specific days they want to include in the strategy session. This helps traders tailor their strategies to particular trading sessions or days of the week when they believe the market conditions are more favorable for their trading style.
Customize Session Time:
Users can define the start and end times for the trading session.
This allows the strategy to only consider trades within the specified time window, focusing on periods of higher market activity or preferred trading hours.
Select Days:
Users can select which days of the week to include in the strategy.
This feature is useful for excluding days with historically lower volatility or unfavorable trading conditions (e.g., Mondays or Fridays).
Benefits:
Focus on Optimal Trading Periods:
By customizing session times and days, traders can focus on periods when the market is more likely to present profitable opportunities.
Avoid Unfavorable Conditions:
Excluding specific days or times can help avoid trading during periods of low liquidity or high unpredictability, such as major news events or holidays.
Increased Flexibility: The filter provides increased flexibility, allowing traders to adapt the strategy to their specific needs and preferences.
Example - Day filter | Session Filter
θ: Session time | Exchange time-zone
-----
What tables are available in this script?
Table Type:
- Summary: Provides a general overview, displaying key performance parameters such as Net Profit, Profit Factor, Max Drawdown, Average Trade, Closed Trades, Compound Annual Growth Rate (CAGR), MAR and more.
CAGR: It calculates the 'Compound Annual Growth Rate' first and last taken trades on your chart. The CAGR is a notional, annualized growth rate that assumes all profits are reinvested. It only takes into account the prices of the two end points — not drawdowns, so it does not calculate risk. It can be used as a yardstick to compare the performance of two strategies. Since it annualizes values, it requires a minimum 4H timeframe to display the CAGR value. annualizing returns over smaller periods of times doesn't produce very meaningful figures.
MAR: Measure of return adjusted for risk: CAGR divided by Max Drawdown. Indicates how comfortable the system might be to trade. Higher than 0.5 is ideal, 1.0 and above is very good, and anything above 3.0 should be considered suspicious and you need to make sure the total number of trades are high enough by running a Deep Backtest in strategy tester. (available for TradingView Premium users.)
Avg Trade: The sum of money gained or lost by the average trade generated by a strategy. Calculated by dividing the Net Profit by the overall number of closed trades. An important value since it must be large enough to cover the commission and slippage costs of trading the strategy and still bring a profit.
MaxDD: Displays the largest drawdown of losses, i.e., the maximum possible loss that the strategy could have incurred among all of the trades it has made. This value is calculated separately for every bar that the strategy spends with an open position.
Profit Factor: The amount of money a trading strategy made for every unit of money it lost (in the selected currency). This value is calculated by dividing gross profits by gross losses.
Avg RR: This is calculated by dividing the average winning trade by the average losing trade. This field is not a very meaningful value by itself because it does not take into account the ratio of the number of winning vs losing trades, and strategies can have different approaches to profitability. A strategy may trade at every possibility in order to capture many small profits, yet have an average losing trade greater than the average winning trade. The higher this value is, the better, but it should be considered together with the percentage of winning trades and the net profit.
Winrate: The percentage of winning trades generated by a strategy. Calculated by dividing the number of winning trades by the total number of closed trades generated by a strategy. Percent profitable is not a very reliable measure by itself. A strategy could have many small winning trades, making the percent profitable high with a small average winning trade, or a few big winning trades accounting for a low percent profitable and a big average winning trade. Most trend-following successful strategies have a percent profitability of 15-40% but are profitable due to risk management control.
BE Trades: Number of break-even trades, excluding commission/slippage.
Losing Trades: The total number of losing trades generated by the strategy.
Winning Trades: The total number of winning trades generated by the strategy.
Total Trades: Total number of taken traders visible your charts.
Net Profit: The overall profit or loss (in the selected currency) achieved by the trading strategy in the test period. The value is the sum of all values from the Profit column (on the List of Trades tab), taking into account the sign.
- Monthly: Displays performance data on a month-by-month basis, allowing users to analyze performance trends over each month.
- Weekly: Displays performance data on a week-by-week basis, helping users to understand weekly performance variations.
- OFF: Hides the performance table.
Labels:
- OFF: Hides labels in the performance table.
- PnL: Shows the profit and loss of each trade individually, providing detailed insights into the performance of each trade.
- Range: Shows the range length and Average Day Range (ADR), offering additional context about market conditions during each trade.
Profit Color:
- Allows users to set the color for representing profit in the performance table, helping to quickly distinguish profitable periods.
Loss Color:
- Allows users to set the color for representing loss in the performance table, helping to quickly identify loss-making periods.
These customizable tables provide traders with flexible and detailed performance analysis, aiding in better strategy evaluation and optimization.
-----
User-input styles and customizations:
To facilitate studying historical data, all conditions and rules can be applied to your charts. By plotting background colors on your charts, you'll be able to identify what worked and what didn't in certain market conditions.
Please note that all background colors in the style are disabled by default to enhance visualization.
-----
How to Use This Algobuilder to Create a Profitable Edge and System:
Choose Your Strategy mode:
- Decide whether you are creating an investing strategy or a trading strategy.
Select a Market:
- Choose a one-sided market such as stocks, indices, or cryptocurrencies.
Historical Data:
- Ensure the historical data covers at least 10 years of price action for robust backtesting.
Timeframe Selection:
- Choose the timeframe you are comfortable trading with. It is strongly recommended to use a timeframe above 15 minutes to minimize the impact of commissions on your profits.
Set Commission and Slippage:
- Properly set the commission and slippage in the strategy properties according to your broker or prop firm specifications.
Parameter Optimization:
- Use trial and error to test different parameters until you find the performance results you are looking for in the summary table or, preferably, through deep backtesting using the strategy tester.
Trade Count:
- Ensure the number of trades is 100 or more; the higher, the better for statistical significance.
Positive Average Trade:
- Make sure the average trade value is above zero.
(An important value since it must be large enough to cover the commission and slippage costs of trading the strategy and still bring a profit.)
Performance Metrics:
- Look for a high profit factor, MAR (Mar Ratio), CAGR (Compound Annual Growth Rate), and net profit with minimum drawdown. Ideally, aim for a drawdown under 20-30%, depending on your risk tolerance.
Refinement and Optimization:
- Try out different markets and timeframes.
- Continue working on refining your edge using the available filters and components to further optimize your strategy.
Automation:
- Once you’re confident in your strategy, you can use the automation section to connect the algorithm to your broker or prop firm.
- Trade a fully automated and backtested trading strategy, allowing for hands-free execution and management.
-----
What makes this strategy original?
1. Incorporating direct integration of probabilities into the strategy.
2. Leveraging market sentiment to construct a profitable approach.
3. Utilizing built-in market structure-based trailing stop-loss mechanisms across various timeframes.
4. Offering both investing and trading strategies, facilitating optimization from different perspectives.
5. Automation for efficient execution.
6. Providing a summary table for instant access to key parameters of the strategy.
-----
How to use automation?
For Traders:
1. Ensure the strategy parameters are properly set based on your optimized parameters.
2. Enter your PineConnector License ID in the designated field.
3. Specify the desired risk level.
4. Provide the Metatrader symbol.
5. Check for chart updates to ensure the automation table appears on the top right corner, displaying your License ID, risk, and symbol.
6. Set up an alert with the strategy selected as Condition and the Message as {{strategy.order.alert_message}}.
7. Activate the Webhook URL in the Notifications section, setting it as the official PineConnector webhook address.
8. Double-check all settings on PineConnector to ensure the connection is successful.
9. Create the alert for entry/exit automation.
For Investors:
1. Ensure the strategy parameters are properly set based on your optimized parameters.
2. Choose "Investing" in the user-input settings.
3. Create an alert with a specified name.
4. Customize the notifications tab to receive alerts via email.
5. Buying/selling alerts will be triggered instantly upon entry or exit order execution.
----
Strategy Properties
This script backtest is done on 4H COINBASE:BTCUSD , using the following backtesting properties:
Balance: $5000
Order Size: 10% of the equity
Risk % per trade: 1%
Commission: 0.04% (Default commission percentage according to TradingView competitions rules)
Slippage: 75 ticks
Pyramiding: 2
-----
Terms and Conditions | Disclaimer
Our charting tools are provided for informational and educational purposes only and should not be construed as financial, investment, or trading advice. They are not intended to forecast market movements or offer specific recommendations. Users should understand that past performance does not guarantee future results and should not base financial decisions solely on historical data.
Built-in components, features, and functionalities of our charting tools are the intellectual property of @Fractalyst Unauthorized use, reproduction, or distribution of these proprietary elements is prohibited.
By continuing to use our charting tools, the user acknowledges and accepts the Terms and Conditions outlined in this legal disclaimer and agrees to respect our intellectual property rights and comply with all applicable laws and regulations.

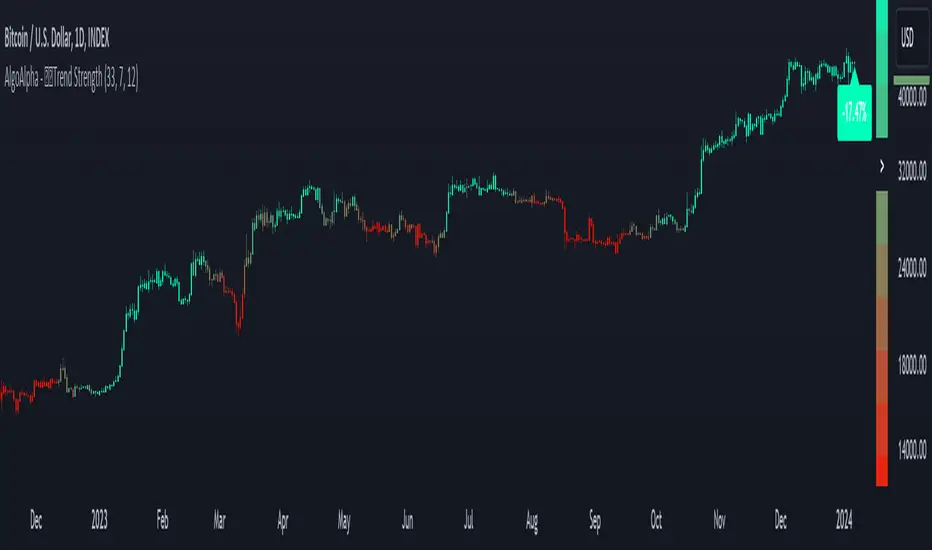
Trend Strength Signals [AlgoAlpha]🌟Introducing the Trend and Strength Signals indicator by AlgoAlpha ! This tool is designed to help you identify trends and gauge market strength with precision and ease. 📈🚀
🛠 Customizable Parameters : Adjust the period, standard deviation multiplier, gauge size, and colors to fit your trading style.
📊 Trend Detection : Visualize trends with clear color-coded signals for uptrends and downtrends.
📈 Strength Gauge : Assess market strength with a dynamic gauge that adapts to the current price action.
🔔 Alerts : Set alerts for bullish and bearish trend crossovers and take profit points to stay ahead of the market.
🎨 Visual Enhancements : Enjoy a clutter-free chart with the integration of plot shapes, color fills, and gradient gauges.
🚀 Quick Guide to Using the Trend and Strength Signals Indicator
Maximize your trading with the Trend and Strength Signals indicator by following these streamlined steps! 🎯✨
🛠 Add the Indicator : Add the indicator to your favorites. Customize settings like period, standard deviation multiplier, and colors to fit your trading style.
📊 Market Analysis : Observe the color-coded candles and gauge to understand market trend direction and strength. Use the alerts for key trading signals.
🔔 Alerts : Enable notifications for trend crossovers and take profit points to catch trading opportunities without constantly monitoring the chart.
⚙️ How it works
This indicator calculates the moving average and standard deviation of the closing price over a customizable period to identify the upper and lower bounds. When the price crosses these bounds, it signals an uptrend or downtrend. The gauge measures market strength by comparing the price to the moving average and scaling it over a customizable range, while the underlying logic uses concepts from the Bollinger Bands, this indicator gives a unique perspective on price behavior through added features and signals derived from it.
Unleash the power of trend and strength analysis with this comprehensive indicator! Happy trading! 🚀📈✨
Volume Weighted Relative Strength Index (VWRSI) [AlgoAlpha]Volume Weighted Relative Strength Index 📈✨
The Volume Weighted Relative Strength Index (VWRSI) by AlgoAlpha enhances traditional RSI by incorporating volume weighting, providing a more nuanced view of market strength. It uses custom range detection to measure consolidation strength, applying dynamic scoring to highlight trend phases. The indicator includes customizable moving averages (SMA, EMA, WMA, VWMA) and color-coded visual cues for uptrends and downtrends. Additionally, it marks significant bullish and bearish trend points with symbols, making it easier to identify potential trading opportunities. This powerful tool helps traders make informed decisions by combining volume, price action, and trend analysis.
✨ Key Features :
📊 Volume-Weighted RSI : Combines RSI with volume for better accuracy.
🔄 Range Detection : Identifies consolidation phases.
🎨 Customizable MAs : Choose from various moving averages.
🔔 Alert Capabilities : Set notifications for trend points.
🚀 How to Use :
🛠 Add Indicator : Add the indicator to favorites, and customize the settings to suite your trading style.
📊 Analyze Market : Watch RSI and range score for trends.
🔔 Set Alerts : Get notified of bullish/bearish points.
✨ How It Works :
The Volume Weighted Relative Strength Index (VWRSI) combines traditional RSI with volume weighting to offer a more comprehensive view of market momentum. It calculates the RSI using the closing price, then weights it by volume to enhance the accuracy of the trend analysis. The indicator also includes a custom range detection feature that evaluates consolidation strength by dynamically scoring the RSI over a specified period. This scoring helps identify phases of strong trends and consolidations. Visual elements like color-coded trend fills and symbols for bullish and bearish points make it easier to spot key market movements and potential trading opportunities.
Stay ahead with VWRSI by AlgoAlpha! 📈💡

Donchian Trend Ranges [AlgoAlpha]🚀🔗 Donchian Trend Ranges 🔗🚀
Elevate your trading game with the Donchian Trend Ranges indicator from AlgoAlpha! 🌟📈 This advanced tool helps you visualize market trends and potential reversal points using Donchian channels, volatility measures, and average true range (ATR).
Key Features
⚙️ Customizable Parameters: Adjust the lookback period and range multiplier to fit your trading style.
🎨 Color-Coded Trends: Easily distinguish between uptrends and downtrends with customizable colors.
📊 Dynamic Channels: Visualize multiple dynamic channels based on Donchian ranges and volatility.
☁️ Trend Clouds: See market strength and weakness with upper and lower trend clouds.
🔔 Signal Alerts: Get notified of potential trend shifts and take profit points.
How to Use
🛠 Add the Indicator: Add the indicator to favorites. Customize settings such as the lookback period and range multiplier to match your trading needs.
🔍 Analyze Trends: The indicator calculates the highest and lowest prices over a specified period to create dynamic channels. It then uses standard deviation and ATR to adjust these channels for market volatility, plotting upper and lower ranges. Green bars indicate an up trend and red bars for a down trend.
🔔 Set Alerts: Enable notifications for bullish and bearish trend shifts, as well as weak and strong take profit points, ensuring you never miss an opportunity.
How it Works
The Donchian Trend Ranges indicator calculates the highest and lowest prices over a specified period to create a basis line. It creates a range around the basis based on standard deviations and the clouds' width is determined by a 14 period ATR. The basis line and bar colors changes based on whether the closing price is above or below it, indicating trends. Clouds around these lines represent market reversal zones that can be used as entry levels when used in confluence with momentum indicators, visual signals ("X" and "◆") marking strong and weak take profit points are also printed when the prices revert from the clouds towards the basis. Integrated alerts notify you of significant events like trend shifts and take profit signals, keeping you informed without constant monitoring.
Unleash the power of the Donchian Trend Ranges in your trading strategy! 🌐📈✨

Net Buying/Selling Flows Toolkit [AlgoAlpha]🌟📊 Introducing the Net Buying/Selling Flows Toolkit by AlgoAlpha 📈🚀
🔍 Explore the intricate dynamics of market movements with the Net Buying/Selling Flows Toolkit designed for precision and effectiveness in visualizing money inflows and outflows and their impact on asset prices.
🔀 Multiple Display Modes : Choose from "Flow Comparison", "Net Flow", or "Sum of Flows" to view the data in the most relevant way for your analysis.
📏 Adjustable Unit Display : Easily manage the magnitude of the values displayed with options like "1 Billion", "1 Million", "1 Thousand", or "None".
🔧 Lookback Period Customization : Tailor the sum calculation window with a configurable lookback period, applicable in "Sum of Flows" mode.
📊 Deviation Thresholds : Set up lower and upper deviation thresholds to identify significant changes in flow data.
🔄 Reversal Signals and Deviation Bands : Enable signals for potential reversals and visualize deviation bands for comparative analysis.
🎨 Color-coded Visualization : Distinct colors for upward and downward movements make it easy to distinguish between buying and selling pressures.
🚀 Quick Guide to Using the Net Buying/Selling Flows Toolkit :
🔍 Add the Indicator : Add the indicator to you favorites. Customize the settings to fit your trading requirements.
👁️🗨️ Data Analysis : Compare the trend of Buying and Selling to help indicate whether bulls or bears are in control of the market. Utilize the different display modes to present the data in different form to suite your analysis style.
🔔 Set Alerts : Activate alerts for reversal conditions to keep abreast of significant market movements without having to monitor the charts constantly.
🌐 How It Works :
The toolkit processes volume data on a lower timeframe to distinguish between buying and selling pressures based on intra-bar price closing higher or lower than it opened. It aggregates these transactions and finds the net selling and buying that took place during that bar, offering a clearer view of market fundamentals. The indicator then plots this data visually with multiple modes including comparisons between buying/selling and the net flow of the asset. Deviation thresholds help in identifying significant changes, allowing traders to spot potential buying or selling opportunities based on the money flow dynamics. The "Sum of Flows" mode is unique from other trend following indicators as it does not determine trend based on price action, but rather based on the net buying/selling. Therefore in some cases the "Sum of Flows" mode can be a leading indicator showing bullish/bearish net flows even before the prices move significantly.
Embark on a more informed trading journey with this dynamic and insightful tool, tailor-made for those who demand precision and clarity in their trading strategies. 🌟📉📈

Crypto Realized Profits/Losses Extremes [AlgoAlpha]🌟🚀 Introducing the Crypto Realized Profits/Losses Extremes Indicator by AlgoAlpha 🚀🌟
Unlock the potential of cryptocurrency markets with our cutting-edge On-Chain Pine Script™ indicator, designed to highlight extreme realized profit and loss zones! 🎯📈
Key Features:
✨ Realized Profits/Losses Calculation: Uses real-time data from the blockchain to monitor profit and loss realization events.
📊 Multi-Crypto Compatibility: The Indicator is compatible on other Crypto tickers besides Bitcoin.
⚙️ Customizable Sensitivity: Adjust the look-back period, normalization period, and deviation thresholds to tailor the indicator to your trading style.
🎨 Visual Enhancements: Choose from a variety of colors for up and down trends, and toggle extreme profit/loss overlay for easy viewing.
🔔 Integrated Alerts: Set up alerts for high and extreme profit or loss conditions, helping you stay ahead of significant market movements.
🔍 How to Use:
🛠 Add the Indicator: Add the indicator to favorites. Customize settings like period lengths and deviation thresholds according to your needs.
📊 Market Analysis: Monitor the main oscillator and the bands to understand current profit and loss extremes in the market. When the oscillator is at the upper band, this means that the market is doing really well and traders/investors will be likely to take profit and cause a reversal. The opposite is true when the oscillator reaches the lower band. The main oscillator can also be used for trend analysis.
🔔 Set Alerts: Configure alerts to notify you when the market enters a zone of high profit or loss, or during trend changes, enabling timely decisions without constant monitoring.
How It Works:
The indicator calculates a normalized area under the RSI curve applied on on-chain data regarding the number of wallets in profit. It employs a custom "src" variable that aggregates data from the blockchain about profit and loss addresses, adapting to intraday or longer timeframes as needed. The main oscillator plots this normalized area, while the upper and lower bands are plotted based on a deviation metric to identify extreme conditions. Colored fills between these bands visually denote these zones. For interaction, the indicator plots bubbles for extreme profits or losses and provides optional bar coloring to reflect the current market trend.
🚀💹 Enjoy a comprehensive, customizable, and visually engaging tool that helps you stay ahead in the fast-paced crypto market!

Candlestick Reversal and Trend Signals [AlgoAlpha]🚀 Unleash your charting capabilities with the Candlestick Reversal and Trend Signals indicator by AlgoAlpha, your go-to tool for spotting pivotal market movements! This script enhances your trading experience by identifying key candlestick patterns and trend changes, perfect for traders aiming for precision in their technical analysis.
🛠 Key Features:
- 🔄 Multi-Timeframe Analysis : Leverages a timeframe multiplier to analyze levels on higher timeframes, enhancing the depth and applicability of insights.
- 🧩 Diverse Pattern Detection : Capable of detecting a wide array of patterns including Bull/Bear Engulfings, Dojis, Haramis, Piercing Lines, Dark Cloud Covers, and Morning/Evening Stars, each contributing to a robust trading strategy.
- 🔍 Dynamic Trend Filters : Utilizes three exponential moving averages (EMAs) and volume filters to decisively confirm trend directions and strength, providing a clearer picture of market dynamics.
- ⚙️ Customizable Settings : Features adjustable settings for filter period, signal thresholds, and appearance, allowing for a tailored analysis experience to fit individual trading styles.
- 📉 Swing Levels Identification : Marks significant high and low swing points on the chart, highlighting potential pivot points and trend reversals for strategic trading decisions.
📈 Quick Guide to Using the Candlestick Reversal and Trend Signals Indicator
1. 🛠 Add the Indicator : Add the indicator to your favorites. Adjust the settings to match your analysis needs.
2. 📊 Analysis : Keep an eye out for the specific symbols plotted on your chart that indicate various candlestick patterns. Use these signals to enhance your market analysis.
3. 🔔 Set Alerts : Enable alerts for the patterns you are most interested in to get notified of potential trading opportunities without needing to monitor the charts constantly.
Embark on your enhanced trading journey with this powerful tool! 🚀✨ Happy trading!
🧐 How It Works:
The Candlestick Reversal and Trend Signals indicator operates by integrating several candlestick patterns and trend analysis features to assist in making informed trading decisions. Initially, it gathers user-defined settings like the period for filtering, signal thresholds, and the desired patterns to detect. It analyzes candlestick formations such as Bull/Bear Engulfings, Dojis, Haramis, and more, by comparing the current candlestick's attributes (such as body length and direction) with previous data to identify potential market reversals or confirmations. The indicator enhances its accuracy through additional filters like volume ratios and exponential moving averages (EMAs) that help validate the strength and direction of trends. By marking these patterns and trends visually on the chart, it provides clear signals that aid traders in identifying significant market movements efficiently. The script is then complemented with the 3 EMA indicator for trend detection and swing levels for added confluence.

Candlestick Trend Strength [AlgoAlpha]🚀🎉 Introducing the Candlestick Trend Strength by AlgoAlpha, a dynamic TradingView indicator designed to visually communicate the strength and direction of market trends right on your charts! 🕯️💪
Key Features:
🌈 Visual gauge for trend strength, color-coded for intuitive insights.
⏳ Customizable trend detection and normalization periods to match your trading strategy.
🎨 Flexible color settings for both uptrend (green) and downtrend (red).
🔔 Real-time alerts for trend reversals, helping you stay ahead of market moves.
How to Use:
🛠 Add the Indicator: Add the indicator to favorites and customize it to suit your needs.
🔍 Analyze the Trends: Monitor the color changes in the gauge and bar color to identify strengthening or weakening trends.
🔔 Set Alerts: Configure alerts to notify you of trend changes, allowing you to react swiftly to trading opportunities without constant monitoring.
Basic Logic Explained:
The "Candlestick Trend Strength" indicator calculates the trend strength score by analyzing the ratio of the candle's wick to its body, alongside the direction of the candle (up or down). It uses a normalization period to adjust the sum of the trend score into a scale from -1 to 1, which is then plotted as a color gradient gauge from red (downtrend) to green (uptrend) on the chart. This representation helps traders quickly assess whether a trend is gaining or losing strength, and it updates in real-time with each new bar, providing a highly responsive tool for technical analysis.
Embrace the power of visual trend analysis with the "Candlestick Trend Strength" by AlgoAlpha and transform your trading experience today! 🌟📈
Unmitigated Liquidity Imbalances [AlgoAlpha]🎉 Introducing the Unmitigated Liquidity Imbalance Indicator by AlgoAlpha! 🎉
Dive into the depths of market analytics with our "Unmitigated Liquidity Imbalance" indicator. This tool harnesses unique algorithms to detect liquidity imbalances between bulls and bears, helping traders spot trends and potential entry and exit points with greater accuracy. 📈🚀
🔍 Key Features:
🌟 Advanced Analysis : Analyses candle direction and length to forecast market peaks and valleys.
🎨 Customizable Visuals : Tailor the chart with your choice of bullish green or bearish red to reflect different market conditions.
🔄 Real-Time Updates : Continuously updates to reflect live market changes.
🔔 Configurable Alerts : Set up alerts for key trading signals such as bullish and bearish reversals, as well as trend shifts.
📐 How to Use:
🛠 Add the Indicator : Add the indicator to your favourites and customize the settings to suite your needs.
📊 Market Analysis : Monitor the oscillator threshold; readings above 0.5 suggest bullish sentiment, while below 0.5 indicate bearish conditions. And reversal signals are displayed to show potential entry points.
🔔 Set Alerts : Enable notifications for reversal conditions or trend changes to seize trading opportunities without constant chart watching.
🧠 How It Works:
The core mechanism of the indicator is based on detecting changes in candlestick size and direction to identify bullish and bearish liquidity levels from the peak & valley indicator's logic. By comparing the length of a current candle to the previous one and checking the change in direction, it pinpoints moments where market sentiment could be shifting, indicating if the liquidity at that point is bullish or bearish. The script then looks at what percentage of the past few unmitigated levels are bullish or bearish based on a customizable lookback and determines the liquidity imbalance which can then be interpreted as trend.
Empower your trading with the Unmitigated Liquidity Imbalance indicator and navigate the markets with confidence and precision. 🌟💹
Happy trading, and may your charts be ever in your favour! 🥳✨
💎 Related Indicator

Rolling Point of Control (POC) [AlgoAlpha]Enhance your trading decisions with the Rolling Point of Control (POC) Indicator designed by AlgoAlpha! This powerful tool displays a dynamic Point of Control based on volume or price profiles directly on your chart, providing a vivid depiction of dominant price levels according to historical data. 🌟📈
🚀 Key Features:
Profile Type Selection: Choose between Volume Profile and Price Profile to best suit your analysis needs.
Adjustable Lookback Period: Modify the lookback period to consider more or less historical data for your profile.
Customizable Resolution and Scale: Tailor the resolution and horizontal scale of the profile for precision and clarity.
Trend Analysis Tools: Enable trend analysis with the option to display a weighted moving average of the POC.
Color-Coded Feedback: Utilize color gradients to quickly identify bullish and bearish conditions relative to the POC.
Interactive Visuals: Dynamic rendering of profiles and alerts for crossing events enhances visual feedback and responsiveness.
Multiple Customization Options: Smooth the POC line, toggle profile and fill visibility, and choose custom colors for various elements.
🖥️ How to Use:
🛠 Add the Indicator:
Add the indicator to favorites and customize settings like profile type, lookback period, and resolution to fit your trading style.
📊 Market Analysis:
Monitor the POC line for significant price levels. Use the histogram to understand price distributions and locate major market pivots.
🔔 Alerts Setup:
Enable alerts for price crossing over or under the POC, as well as for trend changes, to stay ahead of market movements without constant chart monitoring.
🛠️ How It Works:
The Rolling POC indicator dynamically calculates the Point of Control either based on volume or price within a user-defined lookback period. It plots a histogram (profile) that highlights the level at which the most trading activity has occurred, helping to identify key support and resistance levels.
Basic Logic Overview:
- Data Compilation: Gathers high, low, and volume (if volume profile selected) data within the lookback period.
- Histogram Calculation: Divides the price range into bins (as specified by resolution), counting hits in each bin to find the most frequented price level.
- POC Identification: The price level with the highest concentration of hits (or volume) is marked as the POC.
- Trend MA (Optional): If enabled, the indicator plots a moving average of the POC for trend analysis.
By integrating the Rolling Point of Control into your charting toolkit, you can significantly enhance your market analysis and potentially increase the accuracy of your trading decisions. Whether you're day trading or looking at longer time frames, this indicator offers a detailed, customizable perspective on market dynamics. 🌍💹

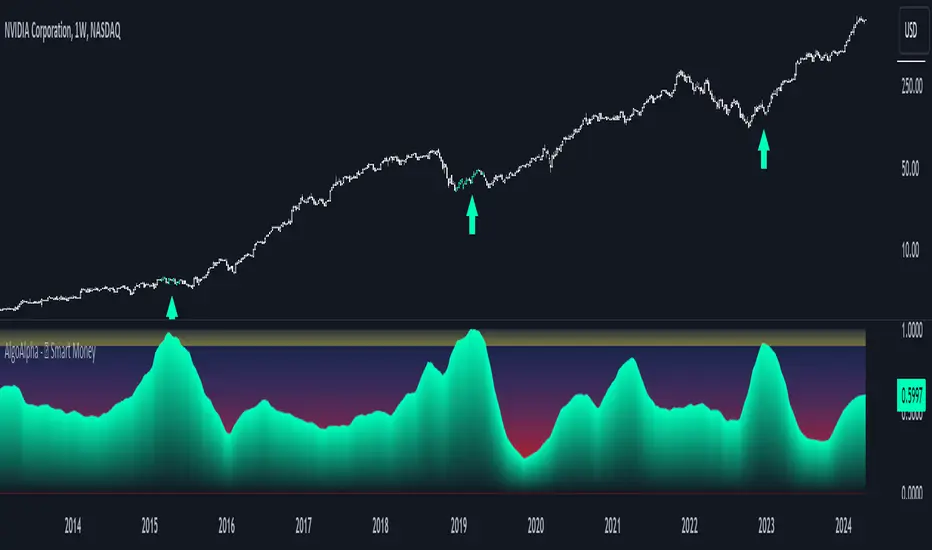
Smart Money Interest Index [AlgoAlpha]🌟 Smart Money Interest Index by AlgoAlpha 🌟
Welcome to the innovative Smart Money Interest Index indicator, designed meticulously by AlgoAlpha to revolutionize the way you trade! 📈🧠 This indicator is engineered to decipher the activities of smart money investors relative to the less informed (dumb money) and dynamically display their dominance in the trading landscape through a sophisticated visual index. 🚀💹
🔑 Key Features:
- Smart vs. Dumb Money Analysis: Tracks and compares the movements of smart money (informed investors) and dumb money (general public) within the market to identify potential investment signals.
- Relative Strength Index (RSI) Based Ratios: Utilizes RSI for both smart and dumb money to create a ratio that indicates buying or selling pressures.
- Dynamic Normalization: Employs a long-term peak normalization over a customizable period to ensure the index remains relevant regardless of market conditions.
- Visual Thresholds and Signals: Highlights significant shifts in market dynamics with color-coded thresholds, making it easier to spot changes at a glance.
🛠 How to Use the Smart Money Interest Index:
🔹 🚀 Step 1: Adding the Indicator
- Add the indicator to your favourites.
- Customize the settings according to your analysis needs:
- `Index Period`, `Volume Flow Period`, `Normalization Period`, `High Interest Threshold`
🔹 📊 Step 2: Interpretation of the Index
- Monitor the index plot; a rising index suggests increasing smart money interest, potentially indicating a buying opportunity.
- A value above the high interest threshold (in yellow) highlights significant interest by smart money, suggesting a good time to buy.
🔹 🔔 Step 3: Setting Alerts
- Configure alerts to notify you when the index crosses above the set threshold, enabling you to capitalize on trading opportunities timely and efficiently.
📐 Basic Logic Overview:
The Smart Money Interest Index by AlgoAlpha provides a unique metric that contrasts the investment behaviors of informed (smart money) and general (dumb money) investors. Utilizing the Relative Strength Index (RSI), this indicator evaluates the trading pressure exerted by both groups over specified periods, then forms a ratio of these activities to identify dominance in buying or selling trends. For example, when we see dumb money selling and smart buying, this suggests that the conditions for buying the asset is optimal as smart money is willing to buy the dip. The outputs are normalized against the highest values observed in a user-defined term to maintain consistency through varying market conditions. When the index exceeds a certain threshold, it suggests that smart money presence is particularly strong, possibly indicating that smart money is looking to enter positions on the asset. This tool serves as a sophisticated visual guide to understanding market dynamics and making well-informed trading decisions based on the activities of market-savvy investors. Smart money activity is identified during areas of low volume and the opposite for dumb money, the indicator uses the NVI and PVI metrics as its foundation for smart and dumb money analysis.
📊 Enhance Your Trading Strategy:
Leverage the Smart Money Interest Index to gain deeper insights into market dynamics and enhance your decision-making process with a powerful, data-driven approach. Whether you're looking to identify entry points or set strategic exits, this tool is designed to provide you with the competitive edge you need in the fast-paced world of trading. 🌐✨
Transform your trading with the power of smart money analysis—start using the Smart Money Interest Index today! 🚀🔔
Volumetric Fair Value Gaps [AlgoAlpha]🎯 Introducing the Volumetric Fair Value Gaps by AlgoAlpha 🎯
Embrace the power of volume and price action with the Volumetric Fair Value Gaps (VFVG) indicator, designed meticulously by AlgoAlpha. This innovative tool enhances your charting capabilities by highlighting fair value gaps in real-time, facilitating superior market entry and exit decisions. 🚀📈
🔍 Key Features:
🔹 Fair Value Gap Detection: Utilizes price action and volume to identify significant fair value gaps, offering potential high-probability trading opportunities.
🔹 Adjustability: Customize the sensitivity with 'FVG Noise Reduction Length' and 'Noise Reduction Factor' to match the volatility and characteristics of the asset being traded.
🔹 Visual Appeal: Displays bullish gaps in a soothing Bullish Color and bearish gaps in a striking Bearish Color, making it easy to spot and analyze trends on the fly.
🔹 Overlay Feature: Plots directly on the price chart for seamless integration and analysis.
🌟 Quick Guide to Using the Volumetric Fair Value Gaps Indicator:
🛠 Add the Indicator: Add the indicator to favourites and set it up with your desired settings.
📊 Market Analysis: Watch for the appearance of colored boxes (blue for bearish, gray for bullish) which represent the fair value gaps. These are high-probability areas for reversals or continuations. FVGs with higher volume are implied to induce a stronger reaction on price.
🔔 Alerts: Set up alerts to notify you when new gaps are detected, ensuring you never miss out on potential trades!
🛠 How It Works:
The Volumetric Fair Value Gaps (VFVG) indicator identifies significant price gaps that are not just based on price action but are also substantiated by volume, which are often overlooked in typical analyses. It operates by comparing the current candle’s price range against historical averages and is calculated over a user-defined period, displayed with volume for further insights. For a gap to be recognized as significant (either bullish or bearish), it must exceed a certain size relative to these averages, which can be adjusted for sensitivity using the provided settings. Bullish gaps are identified when the current low is higher than the second previous high after surpassing the threshold, and bearish gaps are marked when the current high is below the second previous low, similarly surpassing the threshold. This dual-confirmation (volume and price deviation) approach minimizes false signals and enhances the reliability of identified gaps.
Maximize your trading strategy with the VFVG Indicator by AlgoAlpha and turn those gaps into opportunities! 🌈✨

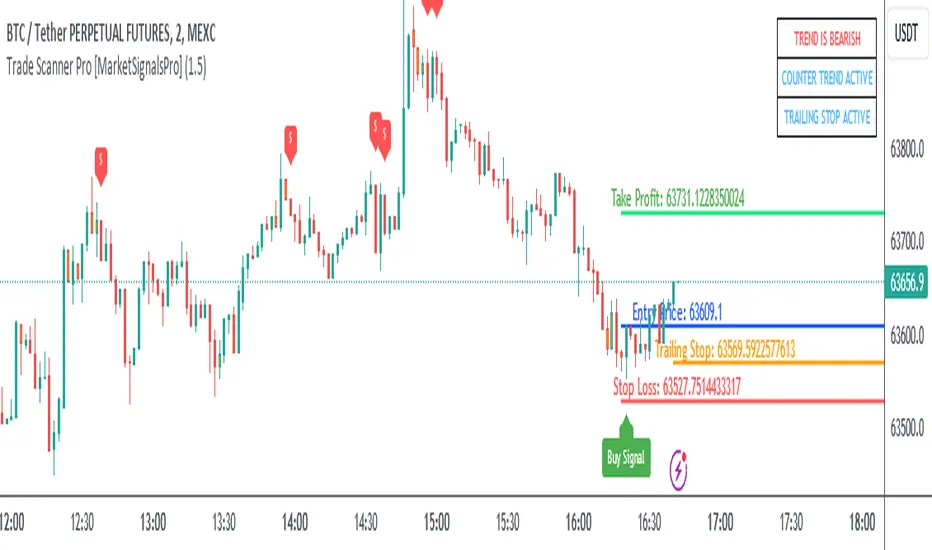
Trade Scanner Pro [MarketSignalsPro]
█ OVERVIEW
Trade Scanner Pro is a trade signal generator based on my trend following momentum reversal system. It identifies a pullback and then confirms momentum exhaustion which produces a signal appearing as a set of suggested orders (horizontal lines) on the chart. The goal is to help traders capitalize on price momentum while simplifying decision making and offering a way to gauge expectations. It can be used for any market, any time frame and configured for counter trend signals also.
█ CONCEPT
While markets are highly random, especially on smaller time frames, trends do exist.
Trade Scanner Pro offers a visually structured way to align the user
with price momentum that is relevant to the trend. It accomplishes this by incorporating a unique mix of standard technical formulas to identify a pullback followed by a momentum reversal. The process occurs in 3 steps:
1 — Identifying the trend of the current time frame.
2 — Evaluating the retrace in terms of how far it moves away from the typical price.
3 — Confirming price exhaustion by recognizing a reversal in price momentum.
Once the criteria are met, a signal appears as a blue horizontal line. This is the entry price suggestion (see label). Stop and take profit orders are also calculated simultaneously. These appear as a red line and green line respectively with price labels. The stop and take profit orders are based upon an average of previous price ranges and will be relative to the price action on the chosen time frame. The initial reward/risk ratio is set to 1.5:1, and can be changed in the settings menu.
This system can also be adjusted to cater to the experience level of the trader. For example, more advanced traders can select “counter trend” mode which will only show signals on the opposite side of the trend. A trailing stop can be activated to help stay in a trade after reaching the profit level. There is also a “heads up” mode which colors the candles orange which means a signal is more likely to appear over the next couple of candles. More on these features in the next section.
For best results, time frames of 1 minute and above should be considered. The smaller the time frame, the more signals, but also more noise and stop outs. Knowing your
market and the most active time of day is especially important for smaller time frames.
█ FEATURES
The following features can be found in the settings menu of Trade Scanner Pro.
Show Trend:
The initial setting is “on”. This shows the trend label on the upper right corner of the screen. Trend can be either bullish or bearish. At times there will be a “conflict” label that appears below the trend label. Conflict means the trend MAY be in the process of changing. This occurs when price persists against the prevailing trend for a prolonged amount of time.
Counter Trend:
When selected will ignore signals on the side of the trend and show counter trend signals only. If the “heads up” feature is selected, orange candles will only appear for potential counter trend signals.
Trailing Stop:
When selected, a trailing stop order suggestion (orange line) will appear beginning from the stop loss price (red line) after a few closed candles. The trailing stop line will follow the price upon each new close of the candles until it is touched. This serves as a point of reference to capture larger market movements and skew reward/risk favorably over time.
Heads Up:
When selected will paint orange candles when there is a greater chance a signal will appear. For example, in trend mode it will only evaluate signals on the side of the trend. In counter trend mode it will evaluate counter trend signals only. For advanced users, this “pre signal” can offer potential opportunities to enter a trade before the signal appears.
Reward Ratio:
This is the reward part of the reward/risk formula used to establish the take profit suggestion on the chart. Initially it is set at 1.5 which produces a line on the chart at a 1.5:1 ratio. The user can change this setting to better align with their expectations. For example, if a larger market movement is anticipated, 2 can be entered into the input field and will generate a take profit line 2X farther than the stop loss line (2:1 reward/risk).
█ LIMITATIONS
Markets are HIGHLY random, especially on smaller time frames. No system that is based on public domain formulas can be expected to be HIGHLY accurate. It is reasonable to expect a 50% win rate more often than not. Profitability in such systems depends on the reward/risk rather than win rate.
This is a system based on price momentum which means MOMENTUM must be present for best results especially on very short time frames.
While this system helps to reduce the burden of analysis, the user should have some basic familiarity with technical analysis. Basic knowledge can help to better determine a quality signal over noise.
█ RAMBLINGS
The stop loss orders MUST be respected otherwise the user puts their entire account at risk. Signals can appear at price locations where larger magnitude risk is extremely high. Respecting the stop loss suggestions can help to mitigate this risk.
For best results set up notifications to receive a message on your desktop, smart phone or tablet rather than sitting in front of a computer screen waiting for a signal to appear. Keep in mind a 1 minute chart in a single market can produce 5 or 6 signals throughout the entire daily session and NOT all will be profitable. A 1 hour time frame may produce 1 or 2 throughout the day. The larger the time frame the lower frequency of signals.
█ THANKS
Special thanks to Cryptosnagger for
helping me translate my concept into a pine script reality.
Squeeze Momentum Oscillator [AlgoAlpha]🎉📈 Introducing the Squeeze Momentum Oscillator by AlgoAlpha 📉🎊
Unlock the secrets of market dynamics with our innovative Squeeze Momentum Oscillator! Crafted for those who seek to stay ahead in the fast-paced trading environment, this tool amalgamates critical market momentum and volatility indicators to offer a multifaceted view of potential market movements. Here's why it's an indispensable part of your trading toolkit:
Key Features:
🌈 Customizable Color Schemes: Easily distinguish between bullish (green) and bearish (red) momentum phases for intuitive analysis.
🔧 Extensive Input Settings: Tailor the oscillator lengths for both Underlying and Swing Momentum to match your unique trading approach.
📊 Dedicated Squeeze Settings: Leverage precise volatility insights to identify market squeeze scenarios, signaling potential breakouts or consolidations.
🔍 Advanced Divergence Detection: Utilize sophisticated algorithms to detect and visualize both bullish and bearish divergences, pointing towards possible market reversals.
📈 Hyper Squeeze Detection: Stay alert to high-momentum market movements with our hyper squeeze feature, designed to extremely suppressed market volatility.
🔔 Comprehensive Alert System: Never miss a trading opportunity with alerts for momentum changes, squeeze conditions, and more.
Quick Guide to Using the Squeeze Momentum Oscillator:
🛠 Add the Indicator: Add the indicator to your favourites. Adjust the oscillator and squeeze settings to suit your trading preferences.
📊 Market Analysis: Keep an eye on the squeeze value and momentum z-score for insights into volatility and market direction. Hyper Squeeze signals are your cue for high momentum trading opportunities.
🔔 Alerts: Configure alerts for shifts in underlying and swing momentum, as well as entry and exit points for squeeze conditions, to capture market moves efficiently.
How It Works:
The Squeeze Momentum Oscillator by AlgoAlpha synergistically combines the principles of momentum tracking and market squeeze detection. By integrating the core logic of the Squeeze & Release indicator, it calculates the Squeeze Value (SV) through a comparison of the Exponential Moving Average (EMA) of the Average True Range (ATR) against the high-low price EMA. This SV is further analyzed alongside its EMA to pinpoint squeeze conditions, indicative of potential market breakouts or consolidations. In addition to this, the oscillator employs Hyper Squeeze Detection for identifying extremely low volatility. The momentum aspect of the oscillator evaluates the price movement relative to EMAs of significant highs and lows, refining these observations with a z-score normalization for short-term momentum insights. Moreover, the incorporation of divergence detection aids in identifying potential reversals, making this oscillator a comprehensive tool for traders looking to harness the power of volatility and momentum in their market analysis. The combination of the Squeeze & Release and the Momentum Oscillator allows traders to time their trades with more precision by entering when the market is in a squeeze and front running the volatility of a major move.
Elevate your trading strategy with the Squeeze Momentum Oscillator by AlgoAlpha and gain a competitive edge in deciphering market dynamics! 🌟💼 Happy trading!

TradeDots - Buy Sell SignalsThe TradeDots Buy Sell Indicator is a sophisticated multi-strategy analytics tool designed to discern market direction and identify potential trading opportunities.
The TradeDots indicator utilizes a trend-following strategy that initially identifies the long-term market trend, whether bullish or bearish, at a macro level. It then zooms in on pullback and reversal price action patterns within this broader trend. These patterns are confirmed by a micro-level candlestick analysis, which leads to the issuance of a "buy" alert. This process ensures both macro and micro elements of the market are considered before entering a trade.
How Does It Work?
In more detail, the procedure begins at the macro level where the advanced indicator applies an Exponential Moving Average (EMA) within the current timeframe. This EMA is then cross-verified with another EMA of the same length from a higher timeframe, ensuring a reliable assessment of long-term market trends. This approach helps establish whether the market situation favors long or short positions.
Following this, a complex mathematical model uses a designated window of candlesticks to calculate price action changes, storing all significant reversal patterns for subsequent comparison. The algorithm then identifies similar repeated reversal patterns in the chart, pinpointing potential market turning points.
For precision and reliability, the confirmation of these reversal patterns involves further refinement and filtering at a micro level. By calculating market momentum in tandem with an exhaustive analysis, e.g. Average True Value (ATR), candlestick body and wick data, the algorithm can affirm the reversal. Finally, the buy or sell signals are plotted on the chart in real-time.
The indicator includes 4 distinct entry strategies for both "Long" and "Short" orders. Each strategy represents different levels of rigorousness in their analysis rules. For instance, a "Weak Buy" signal represents a lighter pullback strength compared to a "Strong Buy" signal, with "Reversal Buy" exhibiting the robust pullback strength based on the change in price action value.
Each type of order comes with its minimum threshold and conditions for profit-taking to prevent excessive trading activity that could lead to high commission costs. Once these conditions are met and coupled with a reversal signal — generated with the same concepts as mentioned earlier but in the opposite direction — a sell signal is then triggered in real time. It's a systematic process that ensures an optimal balance between timely entries and exits in the market.
Generating Trading Ideas Catering To Traders Of All Kinds
TradeDots Buy Sell Indicator includes multiple strategies and many features:
4+ Types of Trading Alerts: Strong, Weak, Reversal, and Breakout for different market conditions (Should not be followed blindly).
2+ Trading Styles: Buy and Hold, Swing Trading (Should not be followed blindly).
Facilitates both "Long" and "Short" trades.
+ more. (Check the changelog below for current features)
HOW TO USE
⭐️ TRADING STRATEGY
Buy and Hold: An approach suitable for long-term investments or as an alternative to a dollar-cost averaging strategy by identifying only the undervalued positions in markets with long-term growth potential like stocks and indices.
Note: This strategy does not provide an exit strategy.
Swing Trading: This method targets buying low and selling high, adapted for traders looking to make the most of short to mid-term market volatility.
⭐️ ORDER DIRECTION
Order direction is for “Swing trading” strategy and other strategies that comes with an exit strategy. It is to choose the direction of the market that you wish to place your order on.
Long: Primarily targeting markets that exhibit a left-skewed trend (more often it rises than falls), this strategy focuses on "long" trading opportunities, avoiding "short" market actions.
Short: Apt for markets displaying a right-skewed trend (more often it falls than rises), this approach targets "short" opportunities exclusively, refraining from "long" market actions.
Long and Short: This comprehensive strategy identifies trading opportunities for both "long" and "short" market actions, facilitating increased opportunities for volatile assets.
⭐️ ALERT TYPES
Strong: These alerts designate high risk/reward return opportunities with a reasonable win rate. They tend to appear near previous support pivots where a Change in Character (CoCh) may often occur, typically coupled with a tight stop-loss strategy.
Weak: Indicative of opportunities balancing risk/reward return and win-rate, these alerts often appear during strong momentum markets.
Reversal: These signals identify potential reversals by highlighting extreme oversold or overbought states, thus revealing markets that are underpriced or overpriced for swift trading actions.
Breakout: They are to identify a change in trend and market breakout by gaps created post earnings or significant economic events, purposed for "Buy high, sell higher" strategies.
⭐️ STOP LOSS
The stop-loss feature offers customization options, enabling users to close a position upon reaching a predefined percentage drawdown. As volatility varies across different timeframes and markets, tuning this feature in accordance with the market allows optimal usage of this indicator.
CONCLUSION
While technical indicators are certainly vital in trading analysis, they are just one part of the equation. The individual trader's style and mindset significantly influence their trading outcomes, making them equally crucial in the process. Therefore, relying solely on indicators for a successful trading outcome may not be the most effective strategy.
Understanding and leveraging these indicators requires substantial time and significant effort from traders. They need to deeply engage with these tools to truly grasp their behavior and functionality. Taking this into consideration, our aim is to create highly advanced, customizable, and user-friendly technical indicators. This tool is designed to illuminate the fundamental role that technical indicators play as a supportive decision-making apparatus, aiding traders to more swiftly embark on their journey towards successful trading.
See Author's instructions below to get instant access to this indicator.
RISK DISCLAIMER
Trading entails substantial risk, and most day traders incur losses. All content, tools, scripts, articles, and education provided by TradeDots serve purely informational and educational purposes. Past performances are not definitive predictors of future results.

Adaptive Schaff Trend Cycle (STC) [AlgoAlpha]Introducing the Adaptive Schaff Trend Cycle by AlgoAlpha: Elevate Your Trading Strategies 🚀
Discover precision and adaptability with the Adaptive Schaff Trend Cycle 🎯, meticulously crafted for traders seeking an edge in the markets. This advanced tool integrates sophisticated algorithms to offer clear insights and real-time analytics 📈.
Key Features:
⚙️Adaptive Signal Processing: Utilizes evolving calculations to adjust to market changes, offering highly responsive signals.
🔍Enhanced MACD Analysis: Innovates on the traditional MACD, providing new insights into market dynamics through an adaptive lens.
🎨Customizable Visual Experience: Features customizable up and down colors for tailored chart analysis.
🔔Real-Time Alerts: Stay informed with instant alerts on indicator changes.
Quick Guide to Using the Adaptive STC Indicator
1. 🔧 Adding the Indicator: Search for "Adaptive Schaff Trend Cycle (STC) " within TradingView's Indicators & Strategies and apply it to your chart. Customize the settings according to your trading style for optimum results.
2.👀 Market Analysis: Monitor the STC and Histogram values closely. The indicator's color gradients provide a visual representation of momentum shifts, helping you to identify trends more clearly.
3. 🚨 Set Alerts: Enable alerts for specific conditions like significant moves up or down, or when the histogram crosses zero. This feature ensures you never miss a potential trading opportunity.
How It Works:
The Adaptive Schaff Trend Cycle by AlgoAlpha introduces a dynamic approach to market analysis, refining traditional indicators through adaptive logic to align with fluctuating market conditions. Here's a concise overview of its operation:
🔄 Adaptive MACD Adjustment: The foundation of the indicator is an enhanced MACD calculation, which dynamically adjusts its parameters based on real-time market trends and momentum. This algorithmic adjustment aims to ensure the MACD's responsiveness to market changes, adapting its sensitivity to offer timely insights .
🌟 Integration of Schaff Trend Cycle (STC): After adjusting the MACD, the indicator calculates STC values to provide a smoothed representation of market trends. By normalizing and smoothing the MACD values on a scale from 0 to 100, the STC method helps in identifying market phases with a clear visualization. The smoothing process is designed to mitigate noise and focus on significant market movements .
📊 Visualization and Alerts: To aid in the interpretation of these insights, the Adaptive Schaff Trend Cycle employs color gradients and customizable visual settings to indicate momentum shifts. These visual cues, combined with alert functionalities, are structured to assist traders in monitoring market developments, enabling them to make informed decisions based on the presented data .
🛠️The Adaptive Schaff Trend Cycle thus merges adaptive MACD adjustments with STC methodology, supported by visual and alert features, to create a tool aimed at enhancing market analysis. By focusing on adaptability and current market conditions, it provides a nuanced view of market trends, intended to support traders in their decision-making processes without promising predictive accuracy or reliability .
Price Action Fractal Forecasts [AlgoAlpha]🔮 Price Action Fractal Forecasts - Unleash the Power of Historical Patterns! 🌌✨
Dive into the future with AlgoAlpha's Price Action Fractal Forecasts ! This innovative indicator utilizes the mesmerizing complexity of fractals to predict future price movements, offering traders a unique edge in the market. By analyzing historical price action and identifying repeating patterns, this tool forecasts future price trends, providing visually engaging and actionable insights.
Key Features:
🔄 Flexible Data Series Selection: Choose your preferred data series for precise analysis.
🕰 Flexible Training and Reference Data Windows: Customize the length of training data and reference periods to match your trading style.
📈 Custom Forecast Length: Adjust the forecast horizon to suit your strategic objectives.
🌈 Customizable Visual Elements: Tailor the colors of forecast deviation cones, data reference areas, and more for optimal chart readability.
🔄 Anticipatory and Repetitive Forecast Modes: Select between anticipating future trends or identifying repetitive patterns for forecasts.
🔎 Enhanced Similarity Search: Leverages correlation metrics to find the most similar historical data segments.
📊 Forecast Deviation Cone: Visualize potential price range deviations with adjustable multipliers.
🚀 Quick Guide to Maximizing Your Trading with Price Action Fractal Forecasts:
🛠 Add the Indicator: Search for "Price Action Fractal Forecasts" in TradingView's Indicators & Strategies. Customize settings according to your trading strategy.
📊 Strategic Forecasting: Monitor the forecast deviation cone and forecast directional changes for insights into potential future price movements.
🔔 Alerts for Swift Action: Set up notifications based on forecast changes to stay ahead of market movements without constant monitoring.
Behind the Magic: How It Works
The core of the Price Action Fractal Forecasts lies in its ability to compare current market behavior with historical data to unearth similar patterns. It first establishes a training data window to analyze historical prices. Within this window, it then defines a reference length to identify the most recent price action that will serve as the basis for comparison. The indicator searches through the historical data within the training window to find segments that closely match the recent price action in the reference period.
Depending on whether you choose the anticipatory or repetitive forecast mode, the indicator either looks ahead to predict future prices based on past outcomes following similar patterns or focuses on the repeating patterns within the reference period itself for forecasts. The forecast's direction can be configured to reflect the mean average of forecasted prices or the end-point relative to the start-point of the forecast, offering flexibility in how forecasts are interpreted.
To enhance the comprehensiveness and visualization, the indicator features a forecast deviation cone. This cone represents the potential range of price movements, providing a visual cue for volatility and uncertainty in the forecasted prices. The intensity of this cone can be adjusted to suit individual preferences, offering a visual guide to the level of risk and uncertainty associated with the forecasted price path.
Embrace the fractal magic of markets with AlgoAlpha's Price Action Fractal Forecasts and transform your trading today! 🌟🚀

Momentum Concepts [AlgoAlpha]🚀 Introducing the Momentum Concepts™ , a robust multi-layered momentum analysis tool developed by AlgoAlpha . This All-in-One indicator offers a comprehensive approach to understanding market momentum, empowering traders with hyper customizable features to tailor their analysis to their specific trading strategies.
Designed with efficiency and compactness in mind, the script shows momentum regimes on three time horizons: The short-term ( Fast Oscillator ), medium-term ( Scalper's Momentum ) and long-term ( Momentum Impulse Oscillator and Hidden Liquidity Flow ). Additionally, the script also includes reversal signals for traders who prefer to trade contrarian/mean-reversion strategies. By utilizing a blend of advanced algorithms and customizable parameters, Momentum Concepts™ provides traders with a vast array of trading strategies ranging from high frequency scalping to timing better entries on long-term swing and investing positions.
Let's delve into the key features and functionalities of this versatile indicator:
🎯Key Features (summary):
Customizable Fast Oscillator: Tailor the fast oscillator to your preferences with adjustable settings for type, source, trend identification(signal processing) method, length, and more.
Divergence Detection: Identify potential trend reversals with ease using built-in divergence detection for both bullish and bearish signals.
Momentum Impulse Oscillator: Gain deeper insights into trending/ranging markets and underlying market bias with a dedicated oscillator, featuring adjustable trend impulse thresholds.
Scalper's Momentum: Utilize a specialized momentum indicator designed for scalping strategies, featuring agility in signal detection with noise reduction and customizable smoothing parameters.
Hidden Liquidity Flow Analysis: Assess hidden liquidity flows within the market, highlighting excess liquidity and potential squeeze situations.
Trend Confluence Indicator: Evaluate the overall momentum direction with dynamically colored zones, aggregating signals from Momentum Concepts™ components for a holistic view.
User-Friendly Interface: The indicator is presented in a clear and intuitive manner, making it accessible for traders of all experience levels.
All-Rounded Alerts: The indicator comes with a comprehensive alerts extension in a separate script, allowing you to stay informed of important market movements even when away from your trading platform.
🎯Key Features (in-depth):
The Fast Oscillator within Momentum Concepts™ comprises four components designed to provide insights into short-term momentum dynamics:
🔱Price Volume Swings :
This confirmation component uses our proprietary Price Volume Algorithm to analyze price action and volume to identify buying and selling pressure, aiding traders in spotting short-term swings for potential trading opportunities.
⚜️Price Volume Waves :
This leading component also uses our proprietary Price Volume Algorithm but differs from the Price Volume Swings by capturing dominant wave patterns instead. This indicator breaks down price and volume data into a wave-like plot which enables leading insights into market momentum due to the relatively predicable nature of sine-like waves. Leading components such as this and the Alpha Wave are best used with other confirmation components within the Momentum Concepts™ .
🌊Alpha Wave :
The Alpha Wave is a leading non-volume alternative to the Price Volume Waves . It reflects market momentum by analyzing price action only instead of using volume data, resulting in a normalized wave-like plot similar to that of the Price Volume Waves , offering a leading perspective on potential market momentum shifts. Leading components such as this and the Price Volume Waves are best used with other confirmation components within the Momentum Concepts™ .
🐲Dragon RSI :
The Dragon RSI is a confirmation component that determines market momentum by analyzing the directional movement of the Relative Strength Index (RSI). By doing so, users are able to visually identify the current short term trend of the market as well as identify overbought and oversold conditions.
Reversal Signals :
All the Fast Oscillator components come with reversal signals that are based on the respective components being either oversold or overbought.
Divergences :
All the Fast Oscillator components come with bullish and bearish divergences. Divergences within the Fast Oscillator components of Momentum Concepts ™ offer crucial signals for trend shifts. 🔱 Price Volume Swings and ⚜️ Price Volume Waves detect weakening buying or selling pressure, signalling potential reversals or continuations. 🌊 Alpha Wave and 🐲 Dragon RSI identify divergences between momentum and price, aiding traders in anticipating market movements. Leveraging these divergences enhances analysis, aiding traders in formulating meaningful analysis.
Customizable Signal Processing Methods :
All the Fast Oscillator components come with customizable signal processing methods to identify trends on the Fast Oscillator , they include (but not limited to) methods such as Heiken Ashi, and a vast selection of Moving Averages.
Diminishing Momentum Warning :
All the Fast Oscillator components come with a diminishing momentum warning that represents a reducing momentum on the Fast Oscillator . This can act as a take profit signal or as a precautionary warning that the price is about to change direction soon even though the Fast Oscillator has not detected it yet.
Dynamically Colored Reversal Zones :
Last but not least, the dynamic coloring of the reversal zones for Fast Oscillator can be customised based on either the reversal probability of the Fast Oscillator or based on the overall trend confluence of all the components within the Momentum Concepts™ indicator.
The Momentum Impulse Oscillator in Momentum Concepts™ offers crucial insights into long-term momentum trends, aiding traders in identifying the underlying momentum regime and differentiating between trending and consolidating markets.
Underlying Momentum Bias
By default, the Momentum Impulse Oscillator is set to show the longer term trend of price action, this can be used to set the directional bias for the markets and prevent users from trading against the trend.
Trending/Ranging Detection
The Momentum Impulse Oscillator comes with the option to enable trending thresholds, when the Momentum Impulse Oscillator is beyond these thresholds, it indicates a trending market, when Momentum Impulse Oscillator is within the thresholds, it indicates a consolidating/ranging market.
The Scalper's Momentum within Momentum Concepts™ furnishes traders with nuanced signals ideal for short to medium-term trading strategies. It efficiently displays both the medium-term momentum and any emerging divergences towards the opposing direction.
Medium-Term Momentum
The Scalper's Momentum is designed to fill the analysis gap between the Fast Oscillator and the Momentum Impulse Oscillator . Showing momentum insights over the medium-term.
Momentum Convergence-Divergence
The Scalper's Momentum is also capable of showing momentum convergences and divergences, which can be used as take-profit and/or confirmation signals to other components within Momentum Concepts™ .
The Hidden Liquidity Flow component of Momentum Concepts™ is designed to uncover underlying liquidity dynamics. This feature enables traders to anticipate potential price movements based on changes in liquidity flow, enhancing their ability to make informed trading decisions.
Underlying Liquidity Dynamics
The Hidden Liquidity Flow shows the underlying liquidity flow of the market, a positive liquidity flow indicates that liquidity is entering the market and increasing the probability of bullish price action, the opposite is true for negative liquidity flows.
Excess Liquidity Flow
The Hidden Liquidity Flow also indicates when there is an abnormal amount of liquidity flowing through the market, this can indicate the potential for volatility and explosive price action.
🎯Usage Examples:
Now that we have gone through the components and features of Momentum Concepts™ in detail, we'll walk you through the usage examples and strategies that you can utilise to navigate the markets.
Scalping
Using the Scalper's Momentum and the Fast Oscillator as an example, users can first use the Scalper's Momentum as a directional bias and the Fast Oscillator as a means of timing a more precise entry. Take profits can be based on either the Diminishing Momentum Warnings or the Fast Oscillator flipping signals or the Scalper's Momentum flipping signals.
Buying the Dip/Shorting the Pump
Using the Momentum Impulse Oscillator and the Fast Oscillator as an example, users will need to first determine the underlying trend with the Momentum Impulse Oscillator , after which they can use the Fast Oscillator for entry signals into the trend. Take profits can be based on either the Diminishing Momentum Warnings or the Fast Oscillator flipping signals
Reversal Trading
Using the Momentum Impulse Oscillator on a timeframe roughly 3-4 times greater than the chart's timeframe and the Fast Oscillator as an example, users will need to first ensure that the Momentum Impulse Oscillator signals a ranging market on a higher timeframe, divergence signals from the Fast Oscillator can then be used as entries. Take profits can be based on either the Diminishing Momentum Warnings or the Fast Oscillator flipping signals or the Fast Oscillator reaching the zero line.
(These are just examples for reference, the Momentum Concepts™ offers significantly more possibilities for customisation and fine tuning of your trading strategy.)
🎯Conclusion:
In conclusion, Momentum Concepts™ stands as a versatile and powerful tool for traders seeking to decode the intricacies of market momentum across multiple time horizons. With its comprehensive suite of customizable features, including the Fast Oscillator , Scalper's Momentum , Momentum Impulse Oscillator , and Hidden Liquidity Flow , traders can gain deep insights into market dynamics and make well-informed trading decisions. Whether executing high-frequency scalping strategies or timing entries for longer-term positions, Momentum Concepts™ equips traders with the tools they need to navigate diverse market conditions with confidence. By harnessing the power of momentum analysis, this indicator empowers traders to stay ahead of the curve and capitalize on emerging opportunities in the ever-evolving financial markets.
Script pago

Multi-Spectral RSI Deviations [AlgoAlpha]🌌 Multi-Spectral RSI Deviations by AlgoAlpha - Dive into Market Dynamics! 🌠
Dive deep into the essence of market trends with our 🚀 Multi-Spectral RSI Deviations indicator, a comprehensive tool designed by AlgoAlpha to enhance your trading strategy. By harnessing the power of multiple RSI lengths and innovative smoothing techniques, this indicator offers a unique perspective on market momentum and potential reversals.
🔍 Key Features:
🎨 Customizable up and down colors for immediate trend recognition.
🔢 Three RSI lengths for multi-layered market analysis.
🔄 Various Moving Average (MA) types including SMA, EMA, and more for tailored smoothing.
✅ Bullish and Bearish divergence plotting for spotting potential reversals.
🕵️♂️ Adjustable divergence sensitivity settings to fine-tune signal detection.
🔔 Built-in alerts for trend shifts and reversal conditions, ensuring you never miss a trading opportunity.
🚀 Quick Guide to Using the Multi-Spectral RSI Deviations Indicator
🛠 Add the Indicator: Search for "Multi-Spectral RSI Deviations" in TradingView's Indicators & Strategies. Adjust the RSI lengths and MA settings to suit your trading strategy.
🔍 Market Analysis: Keep an eye on the color changes for trend direction and use divergence plots to anticipate potential market reversals.
🔔 Alerts Setup: Activate the built-in alerts for trend shifts and reversals to stay ahead of the game without having to constantly monitor the charts.
🧠 How It Works:
At the core of the Multi-Spectral RSI Deviations indicator is its ability to analyze the market through various RSI lengths, providing a comprehensive view of momentum. The indicator calculates the Relative Strength Index (RSI) over three different periods, creating a spectrum of momentum insights. These RSI values are then compared to each other to identify the momentum shifts within the market.
To refine these insights, the differences between these RSI values are smoothed using a selected Moving Average type, such as SMA, EMA, etc., based on user preference. This smoothing process helps in highlighting the overall trend direction and potential reversal points with greater clarity.
Furthermore, the indicator employs a color-coding system, where the plotted line changes color based on the momentum's direction—shifting to an up color for positive momentum and a down color for negative momentum. This visual cue enables traders to quickly discern the market trend at a glance.
Divergences between the price action and the indicator's values are another cornerstone of this tool. By plotting potential bullish and bearish divergences, the indicator provides early signals of possible trend reversals, offering traders a strategic advantage.
Embrace the power of our 🌌 Multi-Spectral RSI Deviations and elevate your trading to stellar heights! 🌠✨

ziksfx Structure - LiteInspired by the 'mentfx Structure' indicator created by Anton (mentfx) on TradingView, I have developed my own unique version of the market structure indicator, enhancing it with features that resonate with my personal trading style and offer additional insights into market behaviour.
In the spirit of Anton's original concept, my indicator incorporates the fundamental idea of "sells before buys" for bullish ranges and "buys before sells" for bearish ranges. This methodological approach is designed to mirror the activities of large market participants who typically offload positions before accumulating again in a bullish context, and accumulate before offloading in a bearish context.
The "ranges" displayed on the chart represent historical and updated highs and lows, reflecting the structural delivery of price across any timeframe. This approach assumes that in a bullish range, the market is likely to sustain upward momentum until it reaches a new high or experiences a significant "sell before buy" scenario, and conversely in a bearish range.
Key Enhancements and Features:
Immediate Break of Structure (BOS) Recognition: This feature promptly updates the high/low to the candle that triggers a BOS, providing a more agile response compared to the original mentfx Structure's approach of waiting for a swing high/low to set the range. This adaptation allows me for quicker adaptation to the market's unfolding narrative.
Market Stage Visualization: By seamlessly integrating with the structure tracking, my indicator presents the current 'Market Stage,' offering a clear stage of the current market's phase, which is crucial for informed trading decisions. The core methodology for determining market stages is derived from the foundational concepts established by mentfx.
Moving Average Integration: The inclusion of a Moving Average (MA) within the indicator adds a layer of trend confirmation, reinforcing decisions based on market structure with established trend analysis techniques. You can use EMA or SMA.
Customizable Session Settings: Tailor the indicator to focus on specific market hours, enhancing its utility for session-based trading strategies and backtesting efficiency.
Triple M: The Triple-M feature is also included in this indicator, which provides a visual representation of the market's momentum and potential reverse.
ATR: Utilizes the Average True Range (ATR) to estimate stop loss levels, providing a data-driven method to manage risk in accordance with current market volatility.
Watermark: Displays the name of the ticker and the current timeframe directly on the chart for easy reference, ensuring clarity and orientation when analyzing multiple instruments or timeframes.
How It Works:
When a range is assigned as being bullish, it will continue updating the high until a new high is created after the bos (= the new high of the range) and will not update or change until a candle's body, open's or close's above it - which will re-update the high and update the low. The low will be updated based on the last time price had a candle (open or closure) below a previous candle low, and then will find the lowest low after the rule was met to assign a low (the idea here is to locate the last major "sell before buy" and showcase that range. And this will occur vice versa, where: when a range is assigned as bearish, it will continue updating the low until a true low is created (=low of the range) and will not update or change until a candle's body, open's or close's below it - which will reupdate the low and update the high. The high will be updated based on the last time price had a candle (open or closure) above a previous candle high, and then will find the highest high after the rule was met to assign a high (once again, the idea being to locate the last major "buy before sell" and showcase price as existing in that range.)
A high is considered as a high that has a lower high to its left and to its right. And a low is considered as a low that has a higher low to its left and to its right. These high and low are used to determine the final high or low of a Bullish or Bearish range (respectively).
Range Determination: The indicator assesses the market momentum and assigns a Bullish or Bearish state based on the most recent directional break.
High/Low Rules Adaptation: In a Bullish range, indicator updates the high if a candle's body, not just the wick, exceeds the current high. This subtle yet significant change allows for a more conservative and potentially more accurate portrayal of bullish sentiment.
Dynamic Updating: As the market evolves, the indicator recalibrates the high and low lines based on the latest price movements, ensuring that you always have the most current and relevant data.
The indicator is not merely a trend-following or scalping tool. It leverages a distinct interpretation of market behavior, focusing on the last major "sell before buy" in Bullish ranges and "buy before sell" in Bearish ranges. By doing so, it aims to pinpoint the true sentiment behind price movements, offering traders a more grounded basis for anticipating market trends.
Of course, a special acknowledgment is due to Anton for his foundational work and the insightful knowledge he's giving day-by-day. The principles of his structure tracking method and market approach have significantly influenced the creation of this indicator, which now carries those insights forward, adapted through the lens of my personal trading philosophy.

AI Adaptive Money Flow Index (Clustering) [AlgoAlpha]🌟🚀 Dive into the future of trading with our latest innovation: the AI Adaptive Money Flow Index by AlgoAlpha Indicator! 🚀🌟
Developed with the cutting-edge power of Machine Learning, this indicator is designed to revolutionize the way you view market dynamics. 🤖💹 With its unique blend of traditional Money Flow Index (MFI) analysis and advanced k-means clustering, it adapts to market conditions like never before.
Key Features:
📊 Adaptive MFI Analysis: Utilizes the classic MFI formula with a twist, adjusting its parameters based on AI-driven clustering.
🧠 AI-Driven Clustering: Applies k-means clustering to identify and adapt to market states, optimizing the MFI for current conditions.
🎨 Customizable Appearance: Offers adjustable settings for overbought, neutral, and oversold levels, as well as colors for uptrends and downtrends.
🔔 Alerts for Key Market Movements: Set alerts for trend reversals, overbought, and oversold conditions, ensuring you never miss a trading opportunity.
Quick Guide to Using the AI Adaptive MFI (Clustering):
🛠 Customize the Indicator: Customize settings like MFI source, length, and k-means clustering parameters to suit your analysis.
📈 Market Analysis: Monitor the dynamically adjusted overbought, neutral, and oversold levels for insights into market conditions. Watch for classification symbols ("+", "0", "-") for immediate understanding of the current market state. Look out for reversal signals (▲, ▼) to get potential entry points.
🔔 Set Alerts: Utilize the built-in alert conditions for trend changes, overbought, and oversold signals to stay ahead, even when you're not actively monitoring the charts.
How It Works:
The AI Adaptive Money Flow Index employs the k-means clustering machine learning algorithm to refine the traditional Money Flow Index, dynamically adjusting overbought, neutral, and oversold levels based on market conditions. This method analyzes historical MFI values, grouping them into initial clusters using the traditional MFI's overbought, oversold and neutral levels, and then finding the mean of each cluster, which represent the new market states thresholds. This adaptive approach ensures the indicator's sensitivity in real-time, offering a nuanced understanding of market trend and volume analysis.
By recalibrating MFI thresholds for each new data bar, the AI Adaptive MFI intelligently conforms to changing market dynamics. This process, assessing past periods to adjust the indicator's parameters, provides traders with insights finely tuned to recent market behavior. Such innovation enhances decision-making, leveraging the latest data to inform trading strategies. 🌐💥
Machine Learning: Multiple Logistic Regression
Multiple Logistic Regression Indicator
The Logistic Regression Indicator for TradingView is a versatile tool that employs multiple logistic regression based on various technical indicators to generate potential buy and sell signals. By utilizing key indicators such as RSI, CCI, DMI, Aroon, EMA, and SuperTrend, the indicator aims to provide a systematic approach to decision-making in financial markets.
How It Works:
Technical Indicators:
The script uses multiple technical indicators such as RSI, CCI, DMI, Aroon, EMA, and SuperTrend as input variables for the logistic regression model.
These indicators are normalized to create categorical variables, providing a consistent scale for the model.
Logistic Regression:
The logistic regression function is applied to the normalized input variables (x1 to x6) with user-defined coefficients (b0 to b6).
The logistic regression model predicts the probability of a binary outcome, with values closer to 1 indicating a bullish signal and values closer to 0 indicating a bearish signal.
Loss Function (Cross-Entropy Loss):
The cross-entropy loss function is calculated to quantify the difference between the predicted probability and the actual outcome.
The goal is to minimize this loss, which essentially measures the model's accuracy.
// Error Function (cross-entropy loss)
loss(y, p) =>
-y * math.log(p) - (1 - y) * math.log(1 - p)
// y - depended variable
// p - multiple logistic regression
Gradient Descent:
Gradient descent is an optimization algorithm used to minimize the loss function by adjusting the weights of the logistic regression model.
The script iteratively updates the weights (b1 to b6) based on the negative gradient of the loss function with respect to each weight.
// Adjusting model weights using gradient descent
b1 -= lr * (p + loss) * x1
b2 -= lr * (p + loss) * x2
b3 -= lr * (p + loss) * x3
b4 -= lr * (p + loss) * x4
b5 -= lr * (p + loss) * x5
b6 -= lr * (p + loss) * x6
// lr - learning rate or step of learning
// p - multiple logistic regression
// x_n - variables
Learning Rate:
The learning rate (lr) determines the step size in the weight adjustment process. It prevents the algorithm from overshooting the minimum of the loss function.
Users can set the learning rate to control the speed and stability of the optimization process.
Visualization:
The script visualizes the output of the logistic regression model by coloring the SMA.
Arrows are plotted at crossover and crossunder points, indicating potential buy and sell signals.
Lables are showing logistic regression values from 1 to 0 above and below bars
Table Display:
A table is displayed on the chart, providing real-time information about the input variables, their values, and the learned coefficients.
This allows traders to monitor the model's interpretation of the technical indicators and observe how the coefficients change over time.
How to Use:
Parameter Adjustment:
Users can adjust the length of technical indicators (rsi_length, cci_length, etc.) and the Z score length based on their preference and market characteristics.
Set the initial values for the regression coefficients (b0 to b6) and the learning rate (lr) according to your trading strategy.
Signal Interpretation:
Buy signals are indicated by an upward arrow (▲), and sell signals are indicated by a downward arrow (▼).
The color-coded SMA provides a visual representation of the logistic regression output by color.
Table Information:
Monitor the table for real-time information on the input variables, their values, and the learned coefficients.
Keep an eye on the learning rate to ensure a balance between model adjustment speed and stability.
Backtesting and Validation:
Before using the script in live trading, conduct thorough backtesting to evaluate its performance under different market conditions.
Validate the model against historical data to ensure its reliability.
