Volume OximeterOVERVIEW
The Volume Oximeter (VOXI) is a technical indicator that gauges the amount of volume currently present in the market, relative to the historical volume that was present before. The purpose of this indicator is to filter out with-trend signals during ranging/non-trending conditions.
CONCEPTS
This indicator assumes that trends are more likely to start during periods of high volume, compared to during periods of low volume. This is because high volume indicates that there are bigger players currently in the market, which is necessary to begin a sustained trending move.
So, to determine whether the current volume is "high", it is compared to an average volume for however number of candles back the user specifies.
If the current volume is greater than the average volume, it is reasonable to assume we are in a high volume period. Thus, this is the ideal time to enter a trending trade due to the assumption that trends are more likely to start during these high volume periods.
The default values in the indicator are designed for use on the daily chart but can be applied to any timeframe.
The default volume lookback period is 259 since there are usually 259 daily candles in a year on Forex daily charts. This means that the average volume will represent the average volume over the past year. This would be 365 on Crypto daily charts, since the Crypto is open 24/7 instead of 24/5). This is what the current volume will be compared to.
The default smoothing lookback period is 10, but this can be adjusted depending on the indicator that's giving you your with-trend signals. After my backtesting, 10 was the best value for my with-trend indicator, so you should do your own testing to see which value works best with your with-trend indicator.
HOW DO I READ THIS INDICATOR?
If the VOXI line is above or equal to zero (indicated by the blue color), the current volume is greater than the historical average volume.
This is a good time to take with-trend signals since high volume is necessary for sustained trending moves to begin.
If the VOXI line is below zero (indicated by the red color), the current volume is less than the historical average volume.
This is a good time to ignore with-trend signals since an absence of volume indicates that there aren't big market participants to participate in a new trending move.
Trendfilter

Fractal Dimension Index The Fractal Dimension Index is a technical indicator that gauges the amount of volatility currently present in the market.
The theory behind this indicator is that a value of 1.5 suggests the market is acting in a completely random fashion. As the market deviates from 1.5, the opportunity for earning profits is increased in proportion to the amount of deviation.
Keep in mind that the indicator does not show the direction of trends ! Although you can try to test it as a trend-following indicator that gives trend-following signals, that isn't the intended use of the indicator.
The Fractal Dimension Index is red when the market is in a trend. And it is blue when there is high volatility. When the Fractal Dimension Index changes its color from red to blue , it means that a trend is finishing. The market becomes erratic and high in volatility when the Fractal Dimension Index is blue . Usually, these "blue periods" do not go on for a long time, they come before a new trend.
So, look for trend-following signals while the Fractal Dimension Index is blue since this indicates high volatility before a potential trend, and avoid trend-following signals when the Fractal Dimension Index is red since this indicates a ranging/non-trending market or a trend that started long ago.

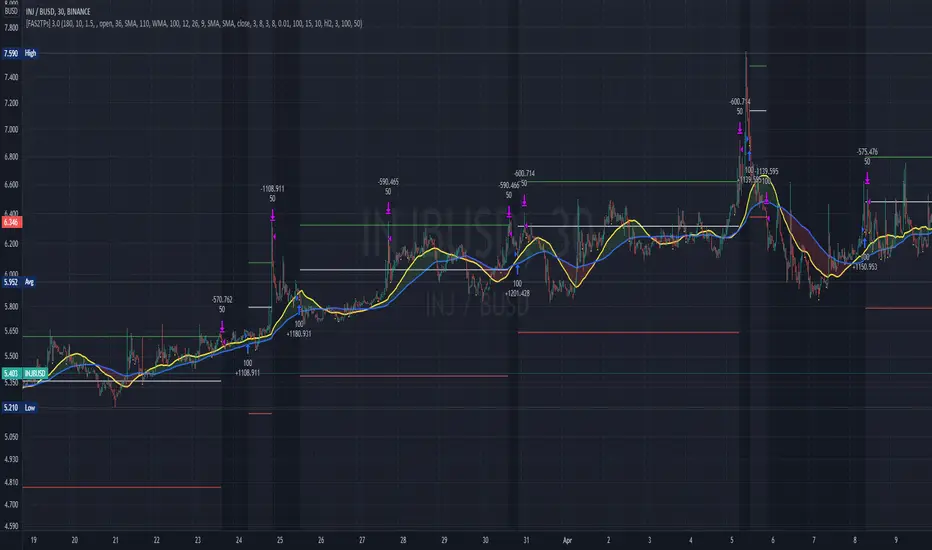
[Fedra Algotrading 2TPs]This strategy uses the deviation of a simple linear regression to determine the entry point into a short-term trend. It also includes an intelligent trend filter (SMA, WMA, Super trend and MACD), to determine the dominant trend over a longer time frame and avoid opening trades against the market.
It manages capital by dividing the position into 2 take profits, the first one configurable in a fixed percentage, which will sell half of the position, and the second one that will trigger a trailing take profit once the desired percentage is reached, with the rest of the position.
Each parameter is optimizable to adapt it to the desired market, but this strategy benefits from the high volatility of mid and low capitalization cryptocurrencies due to their higher volatility.
It also includes tools to adjust the backtests, and command inputs so that the script can automatically work with bots.
Williams Alligator Trend FilterI've edited the normal Bill Williams Alligator indicator to have a color fill that indicates the trend. There is a percentage range filter which checks if the 2 outer lines are enough far away from eachother to indicate a trend. The indicator also checks if the lines are below or above eachother in the right order as a last check to confirm Trend

MACD Cross [Momentum & Trend Filter]This is MTF MACD crossover and crossunder, with EMA trend filter and MTF RSI overbought/oversold filter.
Guidelines:
- User can set stop loss, take profit target and risk to reward ratio in setting
- ATR Stop and ATR Multiplier are use to set stop loss and take profit levels, setting are varies depend on what you are trading, play around and find appropriate number
- Don't trade if range between stop loss and target profit are too small or if there are too many small range try to increase multiplier
- If MACD Zero Line Filter enable, detect MACD crossover only under zero line for LONG, and detect MACD crossunder only above zero line for SHORT
- If EMA Trend Filter enable, detect MACD crossover which price above EMA for LONG, and detect MACD crossunder which price below EMA for SHORT
- RSI timeframe 1-3 should not lower than chart timeframe to display Overbought and Oversold correctly
- Enable MTF Overbought and Oversold just to display red background for Overbought, and green background for Oversold
There are 3 alert options:
(For those free user which can get only 1 alert, please choose "MACD crossover & crossunder" if you want to get alert for both long and short directions)
Have fun :)

Nearest Percentile Moving Average BandsWhile coding some filters into another indicator for Long/Short I noticed that ta.nearest.percentile might be the most useful tool in pinescript I've ever encountered.
While percentile_nearest can be used for all kind of things I decided to code moving averages from it and made bands for bottom percentage and top percentage.
The indicator will calculate the top % price of the given bar length.
Example settings:
length: 150
percentile: 99
So when using 99% it will draw a green line when price is moving above the top 1% price of the last 150 candles. It then calculates if the price is below the bottom 1% of the last 150 candles.
Trading use:
Use this indicator to check if the market is leaving normal territory. This signals a breakout move for example the dogecoin pump or the top of the range. I use this indicator to catch bull/bear moves for botting purposes. An other use would be to countertrend trade after the move has ended. With price being in top 1% for a while it is very probable that we see a large correction.
Below example of dogecoin pumps:

Prophit Ninja: Hidden ScrollStay ahead of the markets moves with "Prophit Ninja: Hidden Scroll".
Our legendary senseis have mastered the arts of wielding the Katana and Shuriken over many decades of focused practice and distilled their systems and techniques down to their most vital form- storing their knowledge in this ancient scroll for easy adoption by any ninja practiced enough to be able to decipher it.
═════════════════════════════════════════════════════════════════════════
█ INTERPRETATION
Each sub-indicator in this package can be used as a confirmation tool to check your bias and give you a more informed decision as they all take into account every reading shown and not shown being calculated across all Prophit Ninja packages. A sentiment rating below the candle shows bullish bias while a green color emphasizes bullish strength- a sentiment rating above the candle shows bearish bias while a red color emphasizes bearish strength- gold color signifies a strong turn in the market while grey/dark grey is a weak reading. A green trend sensei reading is bullish- while a red trend sensei reading is bearish. A green bull trade sensei label signifies a possible bullish trade set up, while a red bear label trade sensei signifies a possible bearish trade set up. Stat sensei gives you tick by tick multi-time frame readings to always keep you aware of the exact environment you're in. Lastly risk sensei will give you the most optimal least risk trade set-up based on user defined variables and give you tick by tick readings of your trade status. This can be used as a standalone decision-maker, or used in confluence with other indicator packages in our Prophit Ninja bundle to get higher precision.
═════════════════════════════════════════════════════════════════════════
█ OVERVIEW
1 — Sentiment Sensei: A toggle-able tick by tick rating system (0-100%) for each candle based on over 100 individual readings .
2 — Trend Sensei: A toggle-able background coloring that easily shows you the trend bias behind the moves.
3 — Trade Sensei: A toggle-able trade finder that finds confluent trade set-ups to give you the upper hand.
4 — Stat Sensei: A toggle-able multi-time frame candle progress tracker with a built in trend bias and price/volume/momentum change/ratio trackers.
5 — Risk Sensei: A toggle-able risk manager with two variations of auto profit target zones , three variations of trailing stop losses , a win/loss tracker , trade duration timer and all the information you need to stay updated with the status of your trade at a glance whether long or short.
═════════════════════════════════════════════════════════════════════════
█ EASY CUSTOMIZATION
i.imgur.com
With a fully customizable and easy-to-use input menu , this indicator gives you the ability to tailor your trading experience to your needs and see as much (or as little) information as you want to; presented in the manner you deem most viable with the following options in just a few clicks:
Indicator Package- This option allows you to switch between the four display modes available so in any moment you can completely change the metrics you’re reading in just two clicks. This allows you the ability to make decisions based on not only what you’re comfortable with; but also to find confirmation or disagreement with other systems instantly.
Color Theme- There are four color themes available which include original, colorful, monochrome and solid. These not only allow you a quick and easy way to change the colors to suit your style; they also make it so you can challenge your bias in an instant by viewing the data in a completely different way.
Dual Attack Modes- Whether you’re a scalper, day trader, swing trader, or investor; this option allows you to see the chart based on four different risk tolerance/time expectancy mentalities for the Katana and Shuriken separately in just two clicks. Investors can see what the scalpers are thinking and vice/versa to broaden their decision making and/or hone in when optimal.
Dual Sharpness Levels- This algorithm allows the user to display the data on five different smoothness levels for the Katana and Shuriken separately without suffering the inherent lag that accompanies most other indicators. Whether you like to see every tick of a choppy movement, or filter out the false signals into smooth readings, you can do so at any moment.
═════════════════════════════════════════════════════════════════════════
█ RISK SENSEI EXAMPLE
═════════════════════════════════════════════════════════════════════════
█ PRE-BUILT ALERTS
With Prophit Ninja: Hidden Scroll's built-in alerts you can enable alerts for any piece of the Hidden Scrollin just a few clicks. These alerts are way more specific and optimized than you can possibly achieve with the custom alert settings. Each checking for multiple possible activation triggers instead of one and populating the message field automatically so you can just click create.
═════════════════════════════════════════════════════════════════════════
As you can see; this ancient scroll has the ability to adapt to any reader or adversary and give those in control of its power the upper hand. Any mode of battle, any opponent, any circumstance- 'Prophit Ninja: Hidden Scroll' was polished by our finest artists to inform any reader and make sure they know when to attack, defend or simply allow the fight to play out by its easy-to-read coloring system. As long as you learn the techniques you'll have a much better chance of making the right decision than when you didn't.
This state-of-the-art tool is great for experienced traders, those who just started learning to trade, or anyone in between- truly made to suit the needs of any trader, in any moment, with any mindset (along with the other indicators in our Prophit Ninja bundle) you'll notice an immediate improvement in your market dexterity after learning it.
═════════════════════════════════════════════════════════════════════════
*everything displayed is part of the Prophit Ninja indicator bundle; this is an otherwise blank chart*

Price Cross Range StrengthPurpose:
This script shows when price is in a range or trending. When the green line rises above the threshold the price is trending. When the green line falls below the threshold it's ranging. You may try adjusting the lookback way far back to find more areas of resistance.
Logic:
It shows how many instances the current price has been crossed in the past measured bars. The logic is that any price area that has been crossed many times is a strong area where ranging occurs.
Ideas:
1. Can be used as a dynamic length to other moving averages.

Donchian Channel - trend filterTrend filter created based on donchian channel. I am using my custom donchian channel as base for this indicator:
Concept is simple.
We count how many times price is hitting donchian channel top or bottom without hitting the other side and keep counter for both. Thus:
upCount is the number of times price hits donchian channel top without hitting bottom
downCount is the number of times price hits donchian channel bottom without hittin top
trendCountLimit is the minimum value of upCount or downCount to call it uptrend or downtrend.

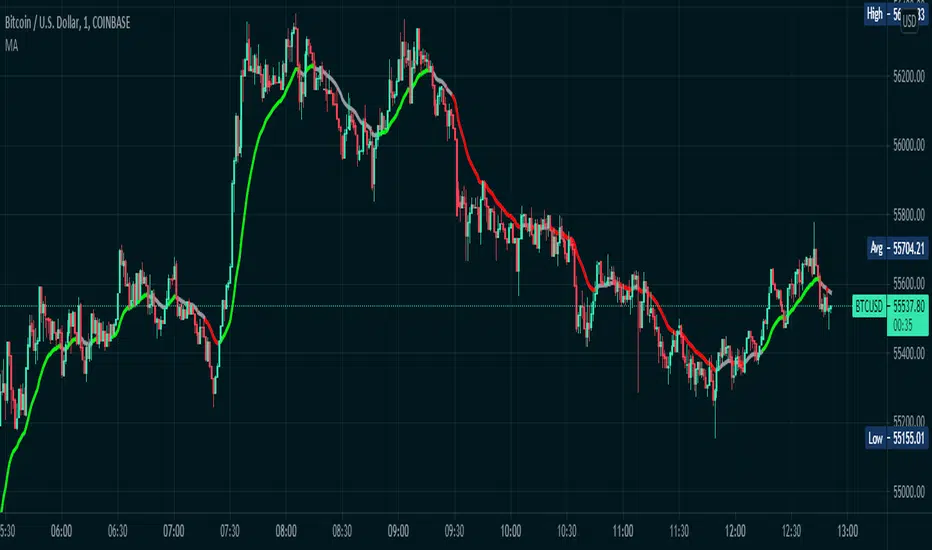
Color Changing Moving Average
Hello everybody!
I'm not much of a coder but I do make indicators for myself for fun sometimes and found this one super cool. Hope it helps!
Basically it's a moving average that changes colors based on the trend. How does it do it, you may ask? Simply put, it checks and makes sure that the open and close price is above the moving average, then it checks and sees if the 50-period RSI (length adjustable) is above 50. If both conditions are met, the moving average turns green. Simple as that.
If the price is below the moving average and the RSI is below 50, the moving average turns red.
If the price is above the moving average but the RSI is below 50, the line is grey and I advise to simply waiting for the trend direction to be decided. Likewise, if the price is below the moving average, but the RSI is above 50, the line is also grey.
This is NOT a comprehensive system, and the changing color of the moving average does not indicate a buy or sell signal. It simply indicates that the price is trending. You should use your own entry and exit strategy, such as the MACD, Wave Trend, Schaff Trend Cycle, etc.
As well, I would recommend waiting for confirmation of a trend change when the color changes, since in a range price can cross multiple times before deciding on the right direction.
The slope of the moving average can help too, since in a range the moving average is typically flat.
I would recommend using a fixed risk to reward ratio, to limit emotions. But, this would also help with a trend-following strategy due to the trend filter functionality.
The length of the moving average is adjustable, as well as the RSI period- though I wouldn't recommend selecting an RSI lower than 30 because it will whipsaw more. Disabling the EMA option will give you an SMA that does the same thing as the EMA. You can also disable the RSI filter and simply have a moving average that changes color when the price is above/below- but that's pretty boring, huh?
Anyways, hope this helps, happy trading everybody :)
Trend Stability (Expo)
Trend Stability (Expo) is a multifunctional trend trading tool that identifies all aspects of trend trading. The indicator helps traders to stay on the right side of the market, identify retracements, reversals, and trend strength. In addition to that, we have added momentum - moves for traders that want to do trend scalping. The candle coloring displays the current trend and gives early signs of trend reversals and retracements.
➤ All in one trading tool that filters out noise and leaves us with insights that matter.
Real-Time with Alerts
No Repainting
Works on any market and in any timeframe
HOW TO USE
Use the indicator to gain insights into all aspects of trend trading:
Trend Stability/equilibrium
Trend Strength
Trend Retracements
Trend Reversals
Trend Filter
Momentum Moves
INDICATOR IN ACTION
4-hour chart
The setting used on the chart below displays negative momentum-moves with a noise-free positive trend.
I hope you find this indicator useful , and please comment or contact me if you like the script or have any questions/suggestions for future improvements. Thanks!
I will continually work on this indicator, so please share your experience and feedback as it will enable me to make even better improvements. Thanks to everyone that has already contacted me regarding my scripts. Your feedback is valuable for future developments!
-----------------
Disclaimer
Copyright by Zeiierman.
The information contained in my scripts/indicators/ideas does not constitute financial advice or a solicitation to buy or sell any securities of any type. I will not accept liability for any loss or damage, including without limitation any loss of profit, which may arise directly or indirectly from the use of or reliance on such information.
All investments involve risk, and the past performance of a security, industry, sector, market, financial product, trading strategy, or individual’s trading does not guarantee future results or returns. Investors are fully responsible for any investment decisions they make. Such decisions should be based solely on an evaluation of their financial circumstances, investment objectives, risk tolerance, and liquidity needs.
My scripts/indicators/strategies/ideas are only for educational purposes!
ACCESS THE INDICATOR
• Contact me on TradingView or use the links below

Aligned Moving Average FilterThis is another adoption of Aligned Moving Average index study published earlier:
Instead of summing up the aligned moving average strength, here we are checking the max and min values from X bars. If maxValue is above threshold, we show bullish bias by coloring candles lime. Similarly if minValue is below threshold we show bearish bias by coloring candles orange. If the max and min signals are mixed - showing both bullish and bearish or showing neither bullish or bearish, then we do not have any bias and candles are colored in silver.
Parameter descriptions are as below:
Moving Average Type : Select moving average type to calculate moving average alignment index
LookbakPeriod : Periods to calculate min and max values
Threshold : Percentage less/more than min/max values of alignment index. At present, max value of alignment index is 36. Hence, 25 threshold will consider max ma alignment index above 27 as bullish and min alignment index below 9 as bearish
Filter type : allows you to use only bullish or bearish filter.
If bullish type is selected, then candle colors are based only on the maxValue of moving average alignment. Candle color will be lime if above threshold and silver otherwise.
If bearish type is selected, then candle colors are based only on the minValue of moving average alignment. Candle color will be orange if below threshold and silver otherwise.

SMOTHING_MOVE_SIDDThis Indicator is used to smooth the movement of scripts with SMMA and SEMA .
Inspired by Chris Moody RSI-EMA .
This indicator help to avoid any kind of small correction in trending direction and it filter small kind of correction.
Small correction like 2-15 irregular corrective candles is filtered with the help of smooth moving average and Arnaud Legoux Moving Average.
Keep default setting help for optimal trend filter changing setting may change the results.
This Indicator is not recommending for Buy and Sell.

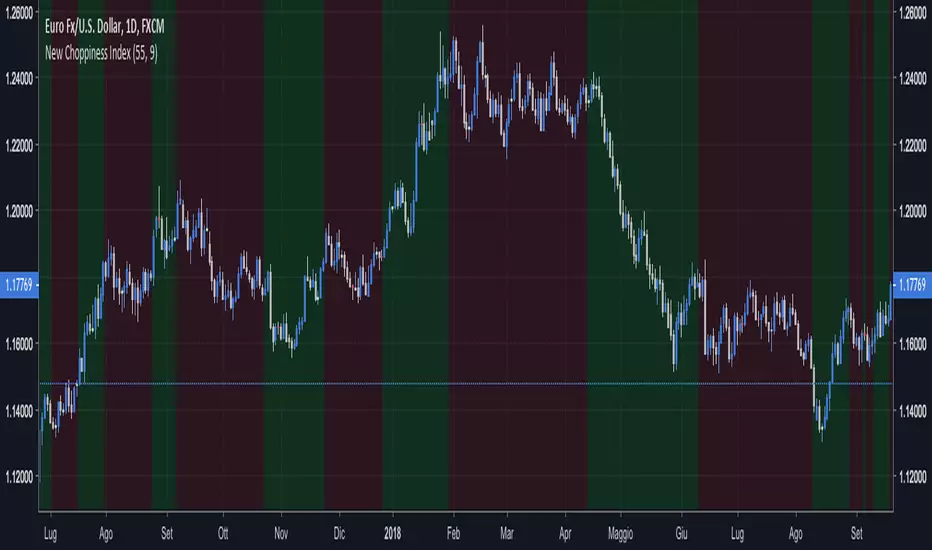
New Choppiness IndexThis script tries to identify trending regions and ranging choppy regions.
Green areas are trends; Red areas are consolidation areas.
If you are a trend follower trader you should focus on green areas;
If you are a harmonic pattern trader you should focus on red areas.
I did not play with the parameters extensively, but as a rule of thumb higher parameters
helps on long term trades.
This tool seems to work better for major currencies pairs, presumably due to the
high exchanged volumes that reduces weird fluctuations.
Good set of parameters are:
(55, 9) the default ones, doing impressively well in EURUSD Daily;
(8, 5) doing well in GBPCHF Daily, short trades to be set at lower timeframes.
Happy trading,
vitelot/yanez/Vts
January 2019
Hitting the like button is a free sign of gratitude.
dual ma cross colored barsSimple Indicator that colors the bars based on whether the fast ma is over or under the slow ma to visually identify trends and when do the crossover occur.

wTF50This is a customized trend filter that has several uses:
It helps identify trend direction, either bullish or bearish
It distinguishes between a pullback and a trend reversal
It helps identify areas where traders should stand aside
It highlights areas of consolidation
dTF50This is a customized trend filter that has several uses:
It helps identify trend direction, either bullish or bearish
It distinguishes between a pullback and a trend reversal
It helps identify areas where traders should stand aside
It highlights areas of consolidation
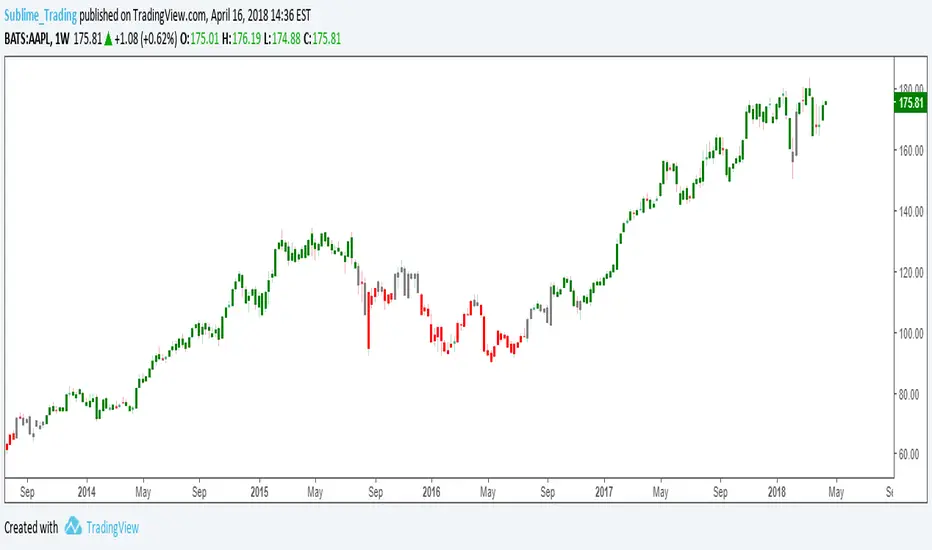
Trend FilterThe indicator colours the candles either Green or Red depending on the following conditions:-
If the N Bar Average Close > N Bar Average Open, the Bars are coloured Green.
If the N Bar Average Close < N Bar Average Open, the Bars are coloured Red.
