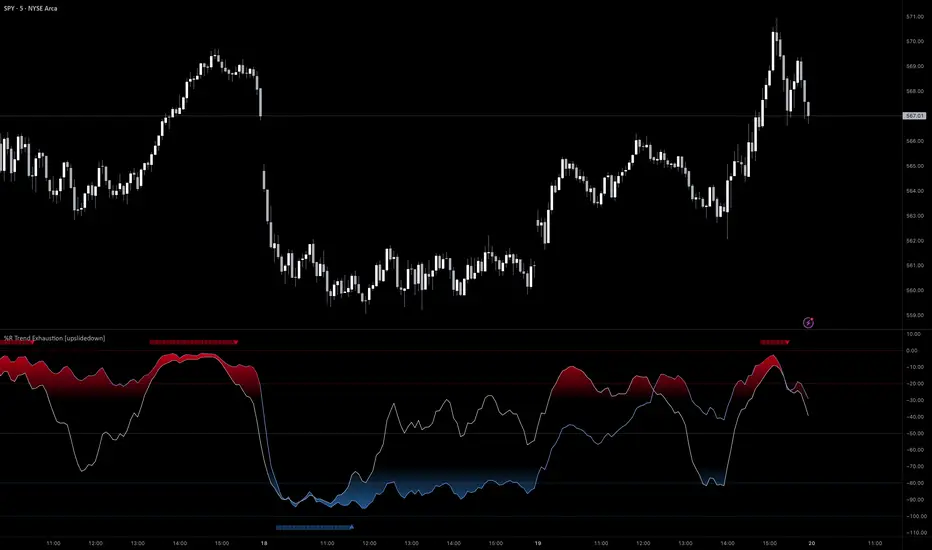
%R Trend Exhaustion [upslidedown]I love Williams %R! This indicator mixes two %R periods... a standard %R with a longer period %R. The longer period of 112 has interesting results for trend following strategies in the crypto market through backtesting.
Alone these are fairly ordinary but together they provide a very interesting trend exhaustion/reversal system while filtering out some noise. I have highlighted key areas of interest with filled boxes. An "area of interest" is when there is confluence between the short and long period %R values along with being overbought or oversold. Once there is a break in the overbought or oversold trend, an arrow will print.
This is one of my odder ideas that appears to have some merit and detects interesting tops or bottoms (or confirms a trend reversal) so I'm publicly publishing for the community to find. If you find this useful please reach out and let me know how you use it as it's fairly unique... and thus different than anything I've ever seen or used.
Trendbreak
ADX Di+ Di- [Gu5]Fill indicates Strong Trend
Cross indicates End of Trend
--
El relleno indica una fuerte tendencia cuando el Di supera "Level Trend"
El cruce de Di+ con Di- indica el fin de la tendencia
Cuando el valor del ADX es menor a "Level Range", estamos en Rango

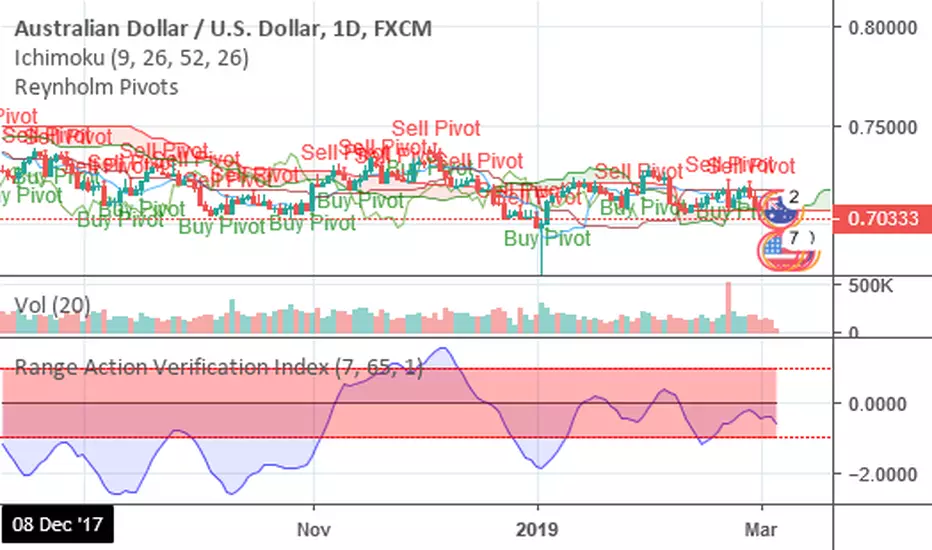
Range Action Verification IndexThe Range Action Verification Index or RAVI as it is commonly known is a trend detection indicator.
When RAVI is greater than 1% for longs and -1% for shorts (FX setting), the currency is in a trend.
The standard MA settings are 7 and 65 days for use on the daily chart, which are the cycles of 7 days and 3 months.
For trading the hourly charts the moving averages should be set to 24 and 120 with a threshold of 3%.
RAVI also keeps you out of a trend less market, so if the RAVI does not break above or below the set threshold,
the market is trend less.
Trend Break CandlesBar Colors based on trend breaks
Trend lines not included, just drawn as an example of what is happening.
