Heikin Ashi Color Flip StrategyManual HA calculation → no repainting
✔ Entry on first green after red
✔ Exit on first red after green
✔ process_orders_on_close = false → orders execute on next bar open
✔ Logic is clean and readable
How to make it your kind of strategy (next step)
Given your past preferences, the best upgrade is:
• Trade only when price > EMA 21
• Or only when SPY > EMA 50 & VIX < 20
• Exit on price close below EMA 21 (your preferred rule)
Consider the following to increase win rate and decrease drawdown:
• Add EMA-21 exit instead of HA red
• Add SPY/VIX regime filter
• Give you real QQQ daily backtest metrics
• Convert this into a scan/alert-only indicator
Disclaimer:
This indicator is provided for educational and informational purposes only and does not constitute financial, investment, or trading advice. The signals generated by this indicator are not guaranteed to be accurate or profitable. Past performance is not indicative of future results. Trading and investing involve substantial risk, and you should perform your own analysis and consult a qualified financial professional before making any trading decisions. The author is not responsible for any financial losses incurred from the use of this indicator.
Análise de Tendência

Ichimoku Cloud Strategy - 1H HyperliquidStategy for Hyperliquid 1hr time frame using Ichimoku's Cloud.

Supertrend + EMA + RSI Algo (Low Risk High Accuracy)This is a trend-following + momentum confirmation strategy designed to reduce false signals and control loss.
Supertrend (10,3) → Identifies overall market direction (Buy in uptrend, Sell in downtrend)
EMA 50 & EMA 200 → Confirms strong trend and avoids sideways market
Buy only when EMA 50 is above EMA 200
Sell only when EMA 50 is below EMA 200
RSI (14) → Confirms momentum
Buy when RSI > 55 (strong bullish momentum)
Sell when RSI < 45 (strong bearish momentum)
---
🔹 Entry Logic
BUY: Market is in uptrend + strong momentum
SELL: Market is in downtrend + strong bearish pressure
---
🔹 Risk Management (Most Important)
Stop Loss: Based on ATR (adapts to volatility)
Target: Fixed Risk-Reward ratio (example: 1 : 2.5)
This keeps loss small and profits larger
---
🔹 Best Use Case
Works best in trending markets
Ideal timeframes: 15m, 1h, 4h
Suitable for crypto futures & swing trading
Beginner-friendly if used with low leverage


SMH_DualMomentum (ROC + Volume Trend)SMH Dual Momentum (ROC + Volume Confirmation)
This indicator identifies high-quality bullish trends by combining price momentum (Rate of Change) with volume confirmation, and exits when momentum structurally fails.
Core Logic
BUY signal
Rate of Change (ROC) over N periods is above a positive threshold (strong upside momentum)
Current volume is above its moving average (rising market participation)
SELL signal
ROC crosses below zero, indicating loss of bullish momentum
Why It Works
ROC measures the speed and strength of price movement, filtering out weak or drifting trends
Volume confirmation ensures momentum is supported by real capital flow, reducing false breakouts
Momentum-based exit avoids prolonged drawdowns and capital stagnation
Key Advantages
Focuses on trend continuation, not prediction
Filters out low-quality price moves and range-bound markets
Captures long, high-conviction trends with relatively few trades
Simple, robust rules using only price and volume
Best Use Cases
Designed for trend-driven ETFs such as SMH (Semiconductors)
Suitable for swing to position trading on daily charts
Works best in markets with strong sector rotation and institutional participation
Notes
This is a trend-following momentum tool, not a mean-reversion indicator
No stop-loss is built in; risk management should be handled externally if required
Parameters can be adjusted to match different timeframes or assets

ParetoCapital AlogrithmThis strategy is a volatility-based breakout system designed to trade only when the market shows sufficient expansion and directional clarity.
It operates by:
Filtering market regime using a long-term trend reference to avoid trading against dominant momentum.
Activating only during elevated volatility, ensuring trades are taken when price movement has enough energy to justify risk.
Entering via breakout orders, not market orders, so trades are triggered only if price confirms continuation.
Applying strict risk control, with capital usage and risk capped per trade.
Separating backtest logic from live execution, using fixed external order sizing for consistency in automation.
The strategy is intended for systematic, automated execution and avoids overtrading by remaining inactive during low-volatility or unclear market conditions.

Signal Algo - Elephant Edge Strategy🔶 Strategy Overview:
This strategy is designed for intraday trading and focuses on taking trades near important price reference areas instead of random market locations.
This strategy is designed to:
Take trades only near important price levels
Avoid random mid-market entries
Validate every trade using multiple confirmation filters
It combines the following core concepts:
Elephant Edge zones based on previous session volatility
Index & F&O strike price levels (psychological and liquidity-based levels)
Previous Day OHLC levels (important institutional reference prices)
The goal of this strategy is to allow trades only when price behavior is meaningful and occurs near key market reference areas, while filtering out low-quality signals. All filters are optional, allowing traders to customize the strategy according to their trading style, risk preference, and market conditions.
🔶 How to Use: Elephant Edge Support–Resistance
This strategy is based on the Elephant Edge Support–Resistance concept, where trades are taken only near important price zones instead of random market areas.
The image above shows how the strategy identifies Support Zones, Resistance Zones, and how trade entries and exits are generated.
🟩 Support Zones:
Shown as green areas. These are considered potential Buy zones.
A positive price reaction from these zones is required before a Buy entry is generated.
🟥 Resistance Zones:
Shown as red areas. These are considered potential Sell zones.
Price rejection from these zones is required before a Sell entry is generated.
Important:
The strategy does not blindly buy or sell at the zone. Entries are generated only after additional confirmation, such as: Candle structure validation, Directional filters, Optional, volume and time filters (if enabled)
Trade entries are generated only when price touches a Support or Resistance zone.
These zones represent areas where price is more likely to react, helping to avoid low-quality trades during sideways or random market movement.
Final Understanding:
This strategy is not about predicting the market. It is about reacting to price behavior at important levels and trading only when conditions are meaningful.
🔶 How to Use: Index Strike Price Support–Resistance
This concept is based on *Index & F&O Strike Price levels*, where trades are taken near important *round-number strike prices* (for example: every 50 or 100 points), instead of random price locations.
The image above shows how *strike prices act as natural Support and Resistance levels** in index trading.
🟩 Strike Price Support:
Strike levels below the current price act as potential Support zones. Price reaction from these levels is required before a Buy entry is generated.
🟥 Strike Price Resistance:
Strike levels above the current price act as potential Resistance zones. Price rejection from these levels is required before a Sell entry is generated.
Trade entries are generated only when price touches or reacts near a strike price level.
These levels represent *psychological and liquidity-based areas*, where price is more likely to pause, reverse, or react.
🔶 How to Use: Previous Day OHLC Levels
This concept is based on *Previous Day Open, High, Low, and Close (OHLC)* levels, which are widely used as *important market reference prices* by traders and institutions.
The image above shows how price reacts around Previous Day OHLC levels and how they act as natural *Support and Resistance areas** during intraday trading.
🟩 Previous Day Support Levels:
Previous Day Open, Low, or Close levels below the current price act as potential Support zones.
A positive price reaction from these levels is required before a Buy entry is generated.
🟥 Previous Day Resistance Levels:
Previous Day Open, High, or Close levels above the current price act as potential Resistance zones. Price rejection from these levels is required before a Sell entry is generated.
Trade entries are generated only when price touches or reacts near a Previous Day OHLC level.
These levels represent *high-interest price areas* where price is more likely to pause, reverse, or show strong reactions.
🔵 Strategy Setting Features Overview :
Trade Direction Controls : -
Buy Only When enabled: The strategy will generate only Buy trades All Sell signals are ignored Sell Only When enabled: The strategy will generate only Sell trades All Buy signals are ignored
Important Note If both Buy Only and Sell Only are enabled: The strategy can generate both Buy and Sell trades
Candle Direction & Color Filter : -
Available Options:
Both - Candle color is ignored Trades depend only on strategy logic
Trend - Buy → Green candles only. Sell → Red candles only
O-Trend - Buy → Red candles only. Sell → Green candles only
Continuous Buy / Sell Check : -
When enabled: Prevents repeated trades in the same direction Reduces over-trading during sideways markets Example: After a Buy trade, another Buy trade will not be taken immediately unless conditions reset.
Elephant Edge Percentile Levels : -
When enabled: Buy trades are allowed only near lower percentile levels Sell trades are allowed only near upper percentile levels
Why this matters: Percentile levels act as dynamic intraday support and resistance based on historical price movement.
Strike Price Level Filters : -
When enabled: Buy trades require price to touch lower strike zones Sell trades require price to touch upper strike zones
Why strike levels are important: Strike prices often act as psychological and liquidity zones, especially in index trading.
Previous Day OHLC Levels : -
When enabled: Draws Previous Day Open, High, Low, and Close on the chart Trades are allowed only when price touches any of these levels
Why Previous Day levels matter: These levels are widely watched by traders and institutions Price often reacts strongly near them Helps filter out low-probability trades
Stoploss Settings : -
Candle Touch: Stoploss triggers immediately when price touches the level
Candle Close: Stoploss triggers only after candle closes beyond the level
Stoploss Type Choose how stoploss distance is calculated:
Candle High / Low
Fixed Points
Percentage based
Trailing Stoploss : -
Trailing stoploss helps protect profits as price moves favorably. Trailing Mode
Points
Percentage
Trailing Activation Defines how much profit is required before trailing starts.
Candle Structure Filters : -
Candle Size : Filter Avoids trades on: Very small candles (low momentum) Extremely large candles (high risk)
Candle Body : Filter Ensures trades are taken only on candles with sufficient body strength.
Wick Filter : Filters out candles with unusually long wicks, which often indicate fake breakouts.
Hammer Candle Detection : -
Enable Hammer Pattern Detects hammer-type candles using wick-to-body ratios.
Useful for: Reversal-based setups near key levels
Entry & Stop Buffers : -
Buffers add small offsets to: Entry price Stoploss price
Purpose: Helps avoid false triggers caused by small price spikes or noise.
Volume-Based Validation : -
Use Volume Alert Validity Trades are allowed only after a high-volume candle appears.
Why volume matters: High volume confirms participation and interest.
Time & Trade Limits : -
Entry / Exit Time Restricts trades to specific market hours. Trade Count Limits Controls the maximum number of trades per session to avoid over-trading.
Quantity Calculation: -
Investment Amount Automatically calculates trade quantity based on capital amount.
Benefit: Helps maintain consistent risk across different instruments.
JSON Alert Output: -
Used for: Automation Broker integration This does not affect strategy logic.
⚠️ Disclaimer This strategy is provided for educational and research purposes only. Past performance does not guarantee future results. Users should test and manage risk independently.

New Rate - PREMIUM v2New Rate - PREMIUM v2
New Rate - PREMIUM v2 is an intraday Opening Range Breakout (ORB) strategy built around a strict one-trade-per-day execution model.
The strategy defines a price range using the first N candles of a user-defined session, freezes the High/Low at the close of candle N, and places OCO stop orders exactly at those levels. The first breakout fills, the opposite order is canceled, and no further trades are allowed until the next trading day.
This script is published for educational and research purposes, with documented mechanics and backtest settings to support transparency and reproducibility.
How the strategy works
Session range construction
The user selects a minutes-based timeframe, a session start time, and the number of candles N. During the session window, the strategy tracks the highest High and lowest Low formed by the first N candles. These candles are visually highlighted on the chart.
Range freeze
When candle N closes, the range is locked. Horizontal High/Low lines are drawn and extended forward. An optional 50% midpoint can be displayed for reference.
OCO breakout execution
Immediately after the range is frozen, the strategy places:
A buy stop at the frozen High
A sell stop at the frozen Low
Orders are linked using OCO (One-Cancels-Other) logic. When one side fills, the opposite order is automatically canceled.
Exit management
Two exit frameworks are available:
Tick-based exits: stop-loss and take-profit are fixed distances in ticks from entry.
Risk/Reward exits: optional stop at the opposite side of the range, with TP calculated as RR × risk.
Both modes can display SL/TP boxes projected forward for visual review.
Daily execution lock
After the first filled trade of the day, the strategy blocks any new entries until the next daily reset. This enforces strict discipline and prevents over-trading.
Visual features
Configurable High/Low lines and labels (color, style, width, alignment)
Optional midpoint (50%) line
Session background highlight with adjustable opacity
Optional SL/TP boxes with configurable colors, borders, and projection length
Weekday filter (trade only selected days)
Settings used for the published backtest (replication)
The performance screenshots included with this publication were generated using the following configuration:
Market & chart
Symbol: FX:XAUUSD
Timeframe: 15 minutes
Session & range
Session start: as configured on chart (exchange time)
Range candles (N): 1
Auto range end: enabled (TF × N)
Line extension: 20 bars
Exits
Exit mode: SL/TP by ticks
Stop-loss: 1500 ticks
Take-profit: 2000 ticks
Weekdays
Monday to Friday enabled
Strategy Properties (TradingView settings)
Initial capital: 1,000 USD
Commission: 0.1 (as set in Strategy Properties)
Slippage: 1 tick
Users should adjust commission, slippage, and position sizing to match their own broker and execution conditions.
Backtest context and limitations
This strategy uses stop orders that may fill intrabar depending on TradingView’s execution model.
Results vary by symbol, timeframe, session selection, and trading costs.
Past performance does not guarantee future results.
This script is not financial advice.
Originality and usefulness
While opening-range breakouts are a known concept, this strategy’s implementation focuses on:
Exact range-freeze timing: orders are armed precisely at the close of the N-th candle.
True OCO + hard daily lock: one-and-done execution enforced at the engine level.
Dual exit framework: fixed-tick and RR exits analyzed with the same SL/TP visual logic.
Operational safeguards: weekday filters and drawing limits designed for stable long-term backtesting.

FluxMA ProFluxMA Pro
FluxMA Pro is an intraday trend-following strategy based on moving-average cross signals , with built-in execution filters (time window + weekdays), direction control, and an optional strict one-trade-per-day rule.
The system enters when price crosses the selected moving average, and manages risk using fixed SL/TP in ticks . For clarity and auditing, it plots the MA and draws risk (SL) / reward (TP) zones on the chart.
This script is published for educational and research purposes , with documented mechanics and replication settings to support transparency and reproducibility.
How the strategy works
Signal engine (MA cross)
A base Moving Average (MA) is computed from a selectable price source.
A Long signal triggers when price crosses above the MA.
A Short signal triggers when price crosses below the MA.
Execution filters
Time filter : trades only inside the configured window (supports overnight windows correctly).
Weekday filter : enable/disable trading by day (Mon–Sun).
Direction filter : run Long only , Short only , or Both .
One trade per day (optional) : if enabled, once a trade is placed, no new trades are allowed until the next daily reset.
Risk management (ticks)
Stop-loss and take-profit are set using fixed distances in ticks from entry.
Orders are placed with a stop and a limit exit to keep execution auditable.
Visual audit layer
Plots the Moving Average on the chart.
Draws SL/TP zones as boxes that extend while the position is open.
Adds entry labels (“buy” / “sell”) for quick review in replays and optimizations.
Visual features
MA plot with selectable MA type (SMA/EMA/WMA/RMA) and length.
Risk/Reward boxes projected from entry (SL zone + TP zone).
Entry labels with configurable styling (label/flag) and colors.
Settings used for the published backtest (replication)
The performance screenshots included with this publication were generated using the following configuration:
Market & chart
Symbol : XAUUSD (FXCM feed)
Timeframe : 15 minutes
Date range : 02 Jan 2025 → 07 Nov 2025
Inputs (Strategy settings)
Source : Close
MA type : SMA
MA length : 10
Stop Loss : 1400 ticks
Take Profit : 2000 ticks
Time filter : enabled — 06:00 to 22:15 (exchange time)
Weekday filter : enabled — Monday to Sunday enabled
Direction : Long only
One trade per day : enabled
TradingView Strategy Properties used
Initial capital : 1,000 USD
Commission : 0.2 (as set in Strategy Properties)
Slippage : 1 tick
Backtest snapshot (as shown)
Net Profit : +727.41 USD (+72.74%)
Max Drawdown : 200.25 USD (12.71%)
Total Trades : 218
Win Rate : 52.29% (114 / 218)
Profit Factor : 1.485
Backtest context and limitations
Stop/limit fills may occur intrabar depending on TradingView’s execution model and bar magnifier assumptions.
Results vary by symbol, timeframe, broker feed, spreads, commissions, slippage, and session selection.
Past performance does not guarantee future results.
This script is not financial advice.
Originality and usefulness
While MA-cross strategies are a known concept, FluxMA Pro focuses on an execution-grade implementation designed for testing and disciplined deployment:
Execution guardrails : optional one-trade-per-day lock + direction filter to prevent over-trading and strategy drift.
Session handling done properly : time windows support overnight logic (no “broken window” edge cases).
MA modularity : SMA/EMA/WMA/RMA selection enables controlled experiments without rewriting logic.
Auditable visuals : SL/TP zones and labels allow fast review of behavior during replays, optimization, and multi-asset scans.

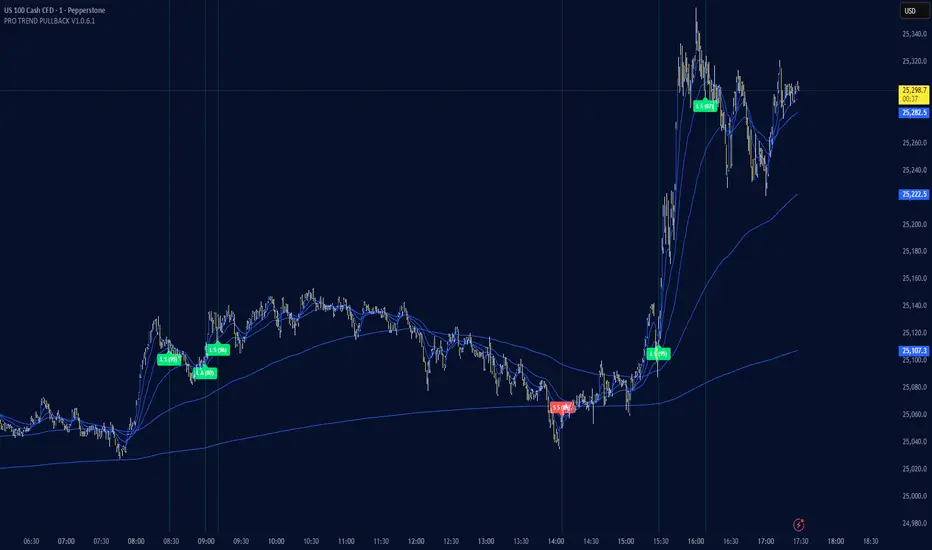
PRO TREND PULLBACK
PRO TREND PULLBACK – trend-following pullback strategy (NAS100 / US30 focus, 1m)
What is this?
- EMA-based trend + pullback entry logic, with optional VWAP and EMA-order filters.
- Built-in preset system for NAS100/US30 on the 1-minute timeframe (Safe / Balanced / Turbo), plus a fully manual “Custom” mode.
Core logic (quick overview)
1) Trend filter:
- Above EMA TREND: long bias, below: short bias
- Optional: VWAP filter, EMA order filter, HTF EMA TREND filter, Multi-EMA direction filter
2) Pullback trigger:
- Pullback level selectable: FAST / MID / SLOW EMA
- Long: touch + bullish confirmation, Short: touch + bearish confirmation (toggleable)
3) Quality filters:
- RSI zone filter (separate for long/short)
- Candle filters: doji / oversized candle / wick (pin-zone) / low-volatility block
- ADX trend-strength filter (via ta.dmi), entry cooldown (bar-based)
- Sideways/range handling: Filter / Penalty / Edge-only mode (ADX + slope + “chop” cross counter)
Risk management / trade management (backtest & automation)
- ATR-based SL/TP: SL, TP1, TP2 (TP1 partial close optional)
- Break-even trigger based on ATR (optional)
- “Max bars in trade” time-based exit (optional)
- Volatility-regime scaling: dynamic SL/TP scaling in high-volatility regimes (optional)
Signal grading (Grade / Score)
- Radar-style scoring + grade: S / A / B / C
- Structural penalties (e.g., lower low / higher high, EMA50 touch, proximity to swing high)
- Trend “fatigue” penalty (down-weights repeated same-direction signals)
- Optional “Lux SMC-lite” score layer (BOS/CHoCH + OB + EQH/EQL + Premium/Discount)
- Optional “ABC-lite (Elliott A-B-C)” score layer (pivot-based)
Alerts / Robot JSON (for webhook)
- Built-in JSON alerts via alert() with watchlist-friendly fields:
secret, strategy, signal, signal_type, symbol, timeframe, time (UTC), price, + optional grade/score
- TradingView alert setup: Condition = “Any alert() function call”
(Webhook URL + your own secret is recommended)
Important notes
- This is a STRATEGY (strategy) intended for backtesting and signal logic. Before live use, test thoroughly and account for slippage/spread differences.
- Pivot-based components (SMC-lite / ABC-lite) are naturally confirmation-based (delayed), so “structure/ABC” values do not print instantly.
- Not financial advice. Use at your own risk.
Suggested starting setup
- Presets: Auto + Balanced (NAS100/US30 1m), then fine-tune with Safe/Turbo.
- For robot mode: turn useRobotAlert=ON and change payloadSecret to a unique value.
sullaojo 3mHere is the English translation for the alert setup instructions:
**How to Set Up Alerts (After Adding the Code)**
1. Click the **Add to chart** button to apply the indicator to your graph.
2. Click the **Alarm Clock icon (Alerts)** on the top right toolbar of TradingView, or press `Alt + A`.
3. In the **Condition** field:
* Select the indicator named **"MA Crossover Buy Alert..."**
* Select **"แจ้งเตือนซื้อ (Buy Alert)"** to receive only buy signals.
4. In the **Trigger** (or Options) section: Select **Once per bar close**.
*(This is recommended per the textbook to confirm that the closing price actually crossed the line, avoiding false signals during intraday volatility.)*
5. Check **Notify on App** (for mobile) or **Show pop-up** as desired, then click **Create**.
Now, when the moving averages cross according to the textbook's conditions, the system will send you an alert immediately!

Liquidity Sweep pro📌 Liquidity Sweep Pro – Strategy Description
Liquidity Sweep Pro is a price–action based trading strategy designed to identify liquidity grabs and smart money reversals around key swing highs and lows.
This strategy focuses on moments where price takes out resting liquidity above recent highs or below recent lows, then shows clear rejection and directional intent, which often precedes strong reversals or continuations.
🔍 Core Logic
The strategy is built on three main concepts:
1️⃣ Liquidity Sweep Detection
Identifies recent swing highs and swing lows using pivot structure
Detects when price sweeps above a high or below a low, signaling liquidity collection
2️⃣ CISD Confirmation (Change in State of Delivery)
After a liquidity sweep, the strategy waits for:
Bearish confirmation after sweeping highs
Bullish confirmation after sweeping lows
This confirmation is based on candle behavior and price closing back inside the structure, filtering out false breakouts.
3️⃣ Optional Trend Filter (Hull MA)
An optional Hull Moving Average filter can be enabled to trade:
Longs in bullish conditions
Shorts in bearish conditions
This helps reduce counter-trend trades while keeping the strategy flexible.
🎯 Risk Management
Stop Loss and Take Profit are calculated dynamically using ATR
Fully customizable Risk : Reward ratio
Designed to adapt to different market conditions and volatility levels
⚙️ Recommended Usage
Best suited for intraday and scalping trading
Works well on:
XAUUSD (Gold) – M3 / M5
Crypto – M5 / M15
Indices – M5
The strategy does not repaint and only generates signals after candle close.
⚠️ Disclaimer
This strategy is for educational and research purposes only.
Always test and optimize parameters for your specific market and timeframe before using it in live trading.

Panic Spike Reversal Strategy | KR3000Panic Spike Reversal Strategy | KR3000
This is a highly attractive yet dangerous trading tool, designed for traders who understand risk and are willing to face it.
The core idea is simple but powerful:
when the market experiences an abnormal surge or collapse within a higher timeframe, this strategy identifies those panic-driven spikes and enters against the move, aiming to capture the natural price mean reversion that often follows extreme emotional behavior.
This strategy is not designed for comfort.
It is designed for discipline, execution, and courage.
🔍 What This Strategy Does
Monitors a higher timeframe (e.g. 1H) in real time
Detects sharp upward or downward price spikes based on user-defined percentage thresholds
Automatically enters contrarian positions:
Spike up → Short
Spike down → Long
Optionally allows both directions within the same monitoring bar, selecting the stronger extreme when both occur
Executes all entries only after bar close, ensuring non-repainting behavior
Uses fixed percentage-based take profit and stop loss, fully adjustable by the user
Limits signals to one trigger per monitoring timeframe bar (optional), preventing overtrading
⚙️ Core Logic & Principles
Markets do not move in straight lines.
Extreme moves are often driven by fear, greed, and forced liquidity, not balanced price discovery.
This strategy is built on the assumption that:
Violent price expansions are statistically unstable
Panic moves frequently overextend, creating short-term opportunities in the opposite direction
However, mean reversion is not guaranteed.
This is why strict stop loss control is essential and fully configurable.
⚠️ Risk Warning
This is a contrarian strategy by nature.
It intentionally trades against strong momentum
Losses can occur quickly if the trend continues
It is not suitable for beginners
Best used by experienced traders who understand:
market structure
volatility behavior
and emotional discipline
If you are looking for safety, this strategy is not for you.
If you are looking for controlled danger with defined risk, this tool may be worth your attention.
🧠 Who This Strategy Is For
Traders who specialize in mean reversion or fade setups
Instruments with high liquidity and volatility (e.g. indices, gold, FX majors)
Users who value transparent logic, non-repainting signals, and full parameter control
Traders who accept that high reward potential comes with high psychological pressure

SU Trend Filter Box-15min-SOLSU Trend Filter Box-15min-SOL,Within this strategy, you can configure various box range criteria, freely combine them, select the number of filters to activate, and it supports 12 different box filtering methods.


Alpha Protocol v2 [High Precision] - Trend Following & Momentum Description: This strategy is designed for swing traders operating in the NSE (National Stock Exchange) or other high-volume equity markets. It utilizes a classic Trend Following approach filtered by institutional liquidity requirements and momentum confirmation.
The Core Philosophy: The "Alpha Protocol" is built on the premise that the strongest moves occur when price action aligns with the primary trend, supported by volume and volatility contraction. It aims to capture the "meat" of the move while strictly limiting downside risk.
Technical Architecture:
Trend Filter: The strategy only takes long positions when the 50-DMA is above the 200-DMA, and the 200-DMA slope is positive (rising).
Momentum triggers:
RSI (14): Must be in the bullish zone (55-75) but not overheated.
MACD: Requires a bullish crossover or positive histogram expansion.
ADX: Must be > 20 to ensure we are not trading in a choppy/sideways market.
Liquidity Filter: To ensure realistic execution, the script requires a minimum daily turnover (Price * Volume) of ₹5 Crores (configurable).
Price Action: Entries are triggered on a breakout of the 20-day high, confirmed by a strong close in the upper 30% of the daily range.
Risk Management (Hard Coded):
Stop Loss: Placed at the recent 10-day Swing Low.
Circuit Breaker: If the Swing Low is more than 5% away from the entry price, the trade is ignored (Capital Protection Rule).
Profit Target: Dynamic 1:2 Risk-Reward Ratio.
Instructions for Use:
Timeframe: Daily (D) is recommended.
Universe: Liquid Mid-caps and Large-caps (Nifty 500).
Alerts: This script is alert-compatible. Use the "Alert() function calls" option to receive precise Entry, Stop, and Target prices on your device.
Disclaimer: This script is for educational and backtesting purposes only. Past performance does not guarantee future results.

Hosoda ZHosoda’s Clouds is a trend-following strategy designed to trade only long positions in traditionally trending markets with a strong bullish bias: SPY(D); DJI (D); NDX (D); XAUUSD (D); Tesla (D, H4, H1); AAPL (D, H4, H1); GOOG (D, H4); META (D, H4); NVDA (D, H4); AMZN(D, H4).
Strategy Parameters
Initial Capital: $10,000 USD.
Position Size: Risks 10% of your equity per trade.
Commission: 0.1%
Indicators
The strategy combines two main technical tools:
A. Ichimoku Cloud This is the core of the strategy. It calculates the classic lines:
• Tenkan-sen (Fast Line): Average of the highest high and lowest low of the last 9 periods.
• Kijun-sen (Base Line): Average of the last 26 periods.
• Cloud (Senkou Span A and B): Projects future support/resistance.
B. EMA 500 (Trend Filter)
• A 500-period Exponential Moving Average is calculated.
• Function: Serves as a very long-term trend filter. If the price is above the EMA 500, the market is considered bullish in the long term.
Entry Rules
• Bullish Cross (Bull Cross): The fast line (Tenkan) crosses above the base line (Kijun). This is the classic Ichimoku entry signal.
• Trend Filter (Optional):
•If you check the "Enable EMA Filter" box in the options, the system will only buy if the closing price is above the EMA 500.
•If the box is unchecked, it will ignore the EMA and buy based solely on the Ichimoku cross.
Exit Rules
A. Stop Loss (Loss Protection) It is a dynamic Stop Loss based on market structure, not a fixed percentage.
• At the moment of entry, the code looks back 12 bars (configurable in sl_bars_back) and finds the lowest price (low).
• It places the Stop Loss at that minimum level.
• Visual: Draws a dotted red line on the chart showing where your Stop Loss is.
B. Technical Take Profit (Exit due to Weakness) Lets profits run until the trend shows weakness.
• Condition: Closes the trade if the Tenkan line crosses below the bottom of the Cloud .
• This means short-term momentum has been lost and the price has entered or crossed below the cloud.
Statistics Panel
In the top right corner, the code draws a table (Panel) that updates in real-time or at the end of Backtesting. It shows:
• Total P&L: Net profit or loss in dollars.
• Win Rate: Percentage of winning trades.
• Trades: Total number of trades executed.
Summary
1. The script waits for the blue line (Tenkan) to cross over the red line (Kijun).
2. It verifies if the price is above the orange line (EMA 500) (if the filter is active).
3. If so, it BUYS.
4. It immediately places a Stop Loss at the low of the last 12 candles (red dotted line).
5. It keeps the trade open until the Stop Loss is hit or until the Tenkan line drops below the Cloud.
Customizable Settings
• Whether to use the EMA filter or not.
• The EMA length (default is 500).
• The Ichimoku periods (9, 26, 52 are standard).
• How many bars to look back to set the Stop Loss.

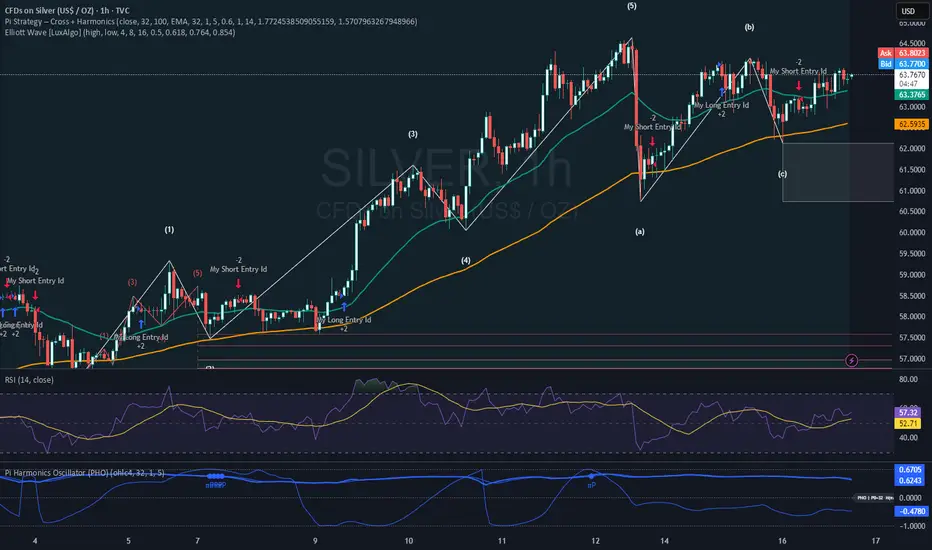
Pi Strategy Cross Harmonicsstill customizing this one, buy and sell seems to off on alternate time settings.
a work in progress, see if this works for anyone.
thanks again.
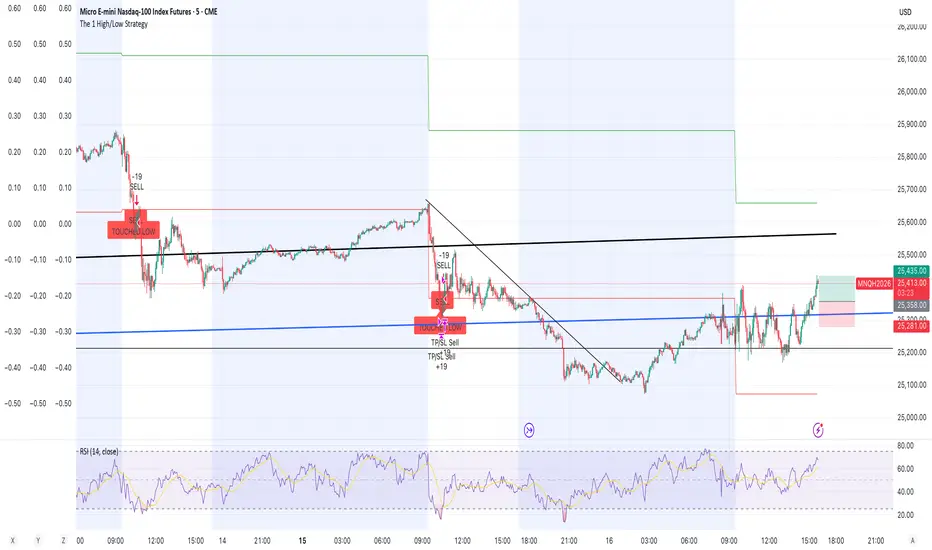
The 1 High/Low StrategyThis strategy takes advantage of price Support and Resistance at High and Low level points of the day to enter high Risk to Reward positions with a high win rate.
Relative Outperformance + EMA Trend Filter (Long Only)Relative Outperformance based on underlying and EMA based trend filtering

SaLaSaLa V6 5m By Aleem MubarakThis strategy uses RSI-MA, Multi-timeframe crossing of RSI, Multi-timeframe crossing of MA and the Crossing of RSI with MA itself on the baseline timeframe (5 minutes), while the alignment timeframes are 15m, 1hr, 4hr.
It uses Bolinger Bands to filter out false breakouts and uses an adjustable step-wise trailing as the exit conditions, so for this reason the strategy has a trailing take profit.
This strategy works best on 5 minutes timeframe for scalpers.
You may find the backtesting result using the tester option on trading view.
Just Integrate your broker on Trading View and make the strategy pick trades automatically and watch your investment grow.
Credit to
Lux Algo, Techno Bloom for their indicators which was used as vision during checks

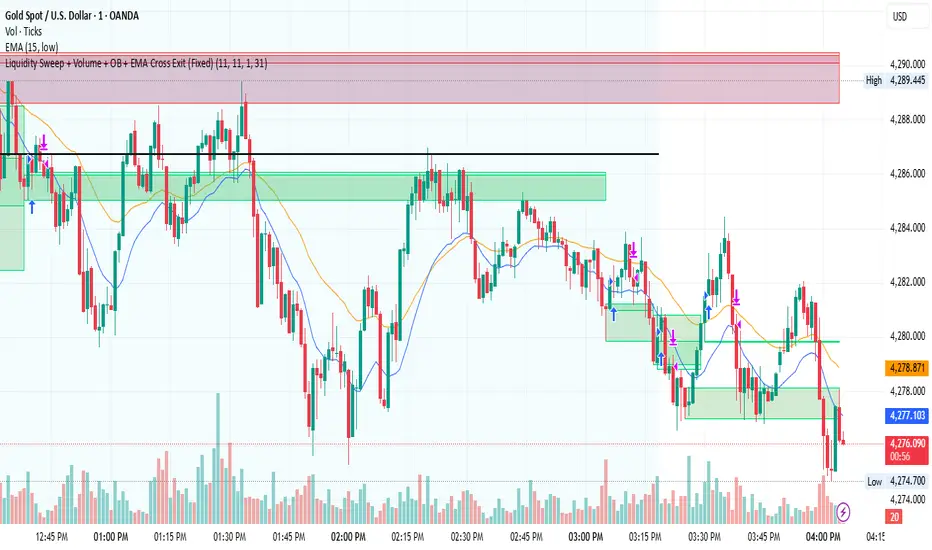
Liquidity Sweep + Volume + OB + EMA Cross Exit This strategy is a smart-money–inspired trading system designed to capture high-probability reversals after liquidity is taken from the market.
It combines liquidity sweeps, volume confirmation, order block validation, and a dynamic EMA-based exit to control risk and let profits run.
Core Concept
Institutions first take liquidity, then move price in the real direction.
This strategy aims to enter after liquidity is swept and price shows confirmation.
1️⃣ Liquidity Sweep Detection
2️⃣ Volume Confirmation
3️⃣ Order Block Identification
4️⃣ EMA Trend Filter (Optional Entry Bias)
5️⃣ Trade Entry Logic
6️⃣ Exit Strategy – EMA Cross Exit
Benefits:
Lets strong trends run
Exits automatically when momentum weakens
Adapts to different market conditions
🛡 Risk & Trade Management
One trade at a time (anti-overtrading logic)
Early exit if trade moves against position after a few bars
Opposite signal forces exit
EMA cross provides trend-based exit
Trend Core Strategy v1.0 - GUMROADLog Regression Channel Pro Strategy
This is a trend-following pullback strategy built for TradingView (Pine Script v6).
It uses logarithmic regression channels to define the market’s primary trend, and looks for low-risk pullback entries within strong trending conditions.
Momentum and trend strength filters are applied to avoid ranging or weak markets.
This strategy is designed to be used when the market is clearly trending, not during choppy or sideways price action.
Best Used When
Strong uptrend or downtrend is present
Price is pulling back toward the regression channel
Volatility is sufficient (ADX confirms trend strength)
Suitable for 1H / 4H timeframes
Commonly used on BTC, ETH, and major crypto pairs
Key Characteristics
Non-repainting logic
Volatility-based risk management (ATR)
Designed for realistic backtesting
No martingale, no grid, no over-optimization
Gumroad Disclaimer (3 Lines)
This strategy is provided for educational purposes only and is not financial advice.
Trading involves risk, and losses may occur.
You are fully responsible for your own trading decisions.
