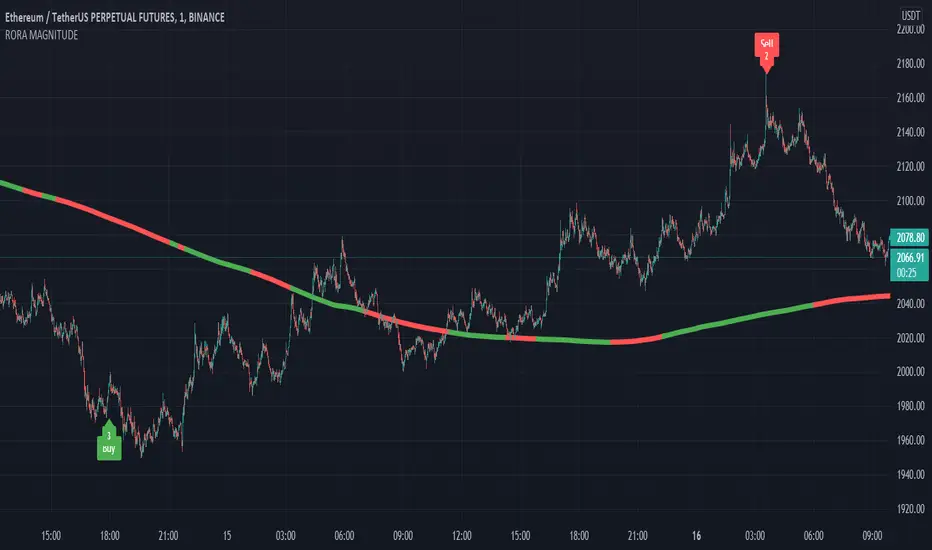
RORA MAGNITUDE👉 What is this indicator ?
This indicator is made up of super trend and moving average, the logic used in this indicator is to understand the trend with moving average and take buy sell entry with super trend
👉 What kind of buy sell signal is there on this indicator ?
Six types of buy sell signals are displayed on this indicator, each marked as Buy1, Sell1, Buy2 , Sell2, Buy3, Sell3, Buy4 , Sell4, Buy5 , Sell5 , Buy6 and Sell6 respectively. These Six types of indicators are obtained by differentiating the small trends detected by the super trend coming in the same trend in the moving average by percentage.
The percentage to be given for each of these six types of signals can be given in the indicator setting.
👉 How many alarms does this indicator have ?
This indicator has two types of alarm for buy signal and sell signal, and it is best to set the alarm by selecting the Alert Once Bar Close option to avoid repaint.
👉 On which coins can this indicator be used ?
This indicator is best used on all cryptocurrencies, the best suitable TIMEFRAME is 1 Min , and this indicator is set to the ETHUSDT coin by default. Use appropriate values when using other coins. If you have difficulty finding the value, you can contact us.
Default Setup Instructions 👇
Duration: 1 Minute
Default Coin : ETHUSDT
The following settings can be found in this indicator
1. Base Threshold: This value can be adjusted according to the volatility of each coin
👉 Default value : 3
2.Interval: Option used to increase or decrease the distance between Buy Trend and Sell Trend (stop loss should be increased with increasing interval)
👉 Default value : 5
3. First : Percentage to take the first signal from the trend
👉 Default Value : 0
4. Second : Percentage to take the second signal from the trend
👉 Default Value : 1.5
5. Third : Percentage to take the third signal from the trend
👉 Default Value : 0.5
6. Fourth : Percentage to take the fourth signal from the trend
👉 Default Value : 0.5
7. Fifth : Percentage to take the fifth signal from the trend
👉 Default Value : 1
8. Sixth : Percentage to take the sixth signal from the trend
👉 Default Value : 50
9. Initial Time interval : This is the time gap between each signal. It should be given on a minute basis
👉 Default Value: 20
10. False Count : A system used to block signals, if necessary, on a 5-way signal
👉 Default Value : 1
11. Signal count : Option to set the number of signals to be displayed in 5 types of signals
👉 Default Value : 5
Trend
MACD Multiple AlertsThis script help traders to catch bullish and bearish momentum. It creates an alert for 40 altcoins based on the MACD cross over and cross under.
The MACD input are adjustable in the settings and you can choose your favorite assets.
Simply add this indicator to the chart wait that if finish to load and then create an alert on the time frame of your choice.
Enjoy your trading
F_rank_01

ATR with MAOVERVIEW
The Average True Range Moving Average (ATRMA) is a technical indicator that gauges the amount of volatility currently present in the market, relative to the historical average volatility that was present before. It adds a moving average to the Average True Range (ATR) indicator.
This indicator is extremely similar to the VOXI indicator, but instead of measuring volume, it measures volatility. Volume measures the amount of shares/lots/units/contracts exchanged per unit of time. Volatility, on the other hand, measures the range of price movement per unit of time.
The purpose of this indicator is to help traders filter between non-volatile periods in the market from volatile periods in the market without introducing subjectivity. It can also help long-term investors to determine market regime using volatility without introducing subjectivity.
CONCEPTS
This indicator assumes that trends are more likely to start during periods of high volatility, and consolidation is more likely to persist during periods of low volatility. The indicator also assumes that the average true range (ATR) of the last 14 candles is reflective of the current volatility in the market. ATR is the average height of all the candles, where height = |high - low|.
Suppose the ATR of the last 14 candles is greater than a moving average of the ATR(14) of the last 20 candles (this occurs whenever the indicator's filled region is colored BLUE). In that case, we can assume that the current volatility in the market is high.
Suppose the ATR of the last 14 candles is less than the moving average of the ATR(14) of the last 20 candles (this occurs whenever the indicator's filled region is colored RED). In that case, we can assume that the current volatility in the market is low.
HOW DO I READ THIS INDICATOR?
If the ATR line is above the ATR MA line (indicated by the blue color), the current volatility is greater than the historical average volatility.
If the ATR line is above the ATR MA line (indicated by the red color), the current volatility is less than the historical average volatility.

Infiten's Regressive Trend Channel An experiment using Pinescript's candle plotting feature. This indicator performs a linear regression on the lows, highs, and moving average, and plots them all in the form of a candlestick. If the close is below the prediction, the candlestick is red, if the close is above the regression, the candlestick is green. Effective and aesthetic way to analyze trends.

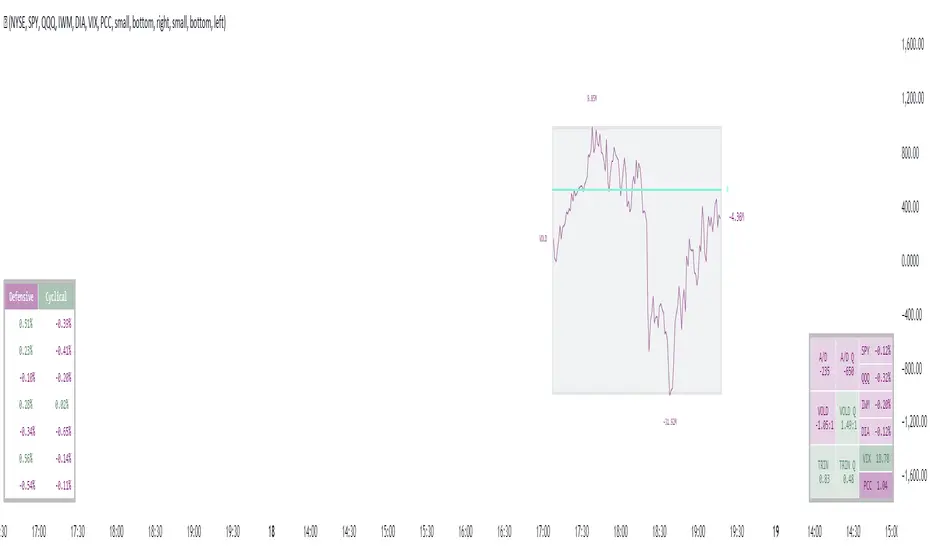
Tick PlusTick Plus
Tick+ is an all-in-one market internals dashboard.
Tick+ features a real-time NYSE or NASDAQ Tick chart, a dynamic Advancers/Decliners vs. VOLD chart, a market internals table readout including both NYSE and NASDAQ instruments, defensive and cyclical sector’s, and daily inflow/out analysis. Also included are customizable symbols readouts, so you can keep an eye on securities that are important to you!
The Tick chart displays a candlestick TICK chart for your chosen exchange and keeps track of the current day's high tick and low tick. Drawn behind these are our Key Reversal Zones.
The Advancers/Decliners vs. VOLD chart dynamically scales both instruments together to easily detect divergences that are known to cut the noise from the market and give an accurate indication of the day's trend.
Market Sync Indicator
This is a small but powerful indicator that analyzes the inflow and outflow of each exchange's underlying securities. When all the markets are in harmony, it will print a green or red symbol below the tick chart. We have also included this signal within the internals table labeled “trending,” which is simply the same signal presented in a more apparent area. Alerts can also be set with these signals to take advantage of the system across tickers.
Note: A gray readout indicates that every market is not moving in the same direction at that moment.
This indicator has been made to be customizable to fit your individual layout style! You are able to stack the Tick & Comparison Charts, as well as display the tables vertically or horizontally!
Note: We are measuring % change of symbols from the daily open to current price, this is so you can make an analysis based on today's info.
All of the default settings are our recommended settings.
Please check the Author Instructions Below for how to gain access to our indicators.
Cryptogrithm's Secret Momentum and Volatility IndicatorThis indicator is hard-coded for Bitcoin, but you may try it on other asset classes/coins. I have not updated this indicator in over 3 years, but it seems to still work very well for Bitcoin.
This indicator is NOT for beginners and is directed towards intermediate/advanced traders with a sensibility to agree/disagree with what this indicator is signalling (common sense).
This indicator was developed back in 2018 and I has not been maintained since, which is the reason why I am releasing it. (It still works great though! At the time of this writing of May 2022).
How to use:
Terms:
PA (Price Action): Literally the candlestick formations on your chart (and the trend formation). If you don't know how to read and understand price action, I will make a fast-track video/guide on this later (but in the meanwhile, you need to begin by learning Order-Flow Analysis, please google it first before asking).
CG Level (Cryptogrithm Level/Yellow Line): PA level above = bullish, PA level below = bearish
CG Bands (Cryptogrithm Bands): This is similar to how bollingers work, you can use this the same was as bollinger bands. The only difference is that the CG bands are more strict with the upper and lower levels as it uses different calculations to hug the price tighter allowing it to be more reactive to drastic price changes (earlier signals for oversold/overbought).
CG Upper Band (Red Upper Line): Above this upper bound line means overbought.
CG Middle Band (Light Blue Line): If PA trades above this line, the current PA trend is bullish continuing in the uptrend. If PA trades below this line, the current PA trend is bearish continuing in the downtrend. This band should only be used for short-term trends.
CG Lower Band (Green Lower Line): Below this lower bound line means oversold.
What the CG Level (yellow line) tells you:
PA is trading above CG Level = Bullish
PA is trading below CG Level = Bearish
Distance between CG Level and price = Momentum
What this means is that the further away the price is from the CG Level, the greater the momentum of the current PA trend. An increasing gap between the CG Level and PA indicates the price's strength (momentum) towards the current upward/downward trend. Basically when the PA and CG Level diverge, it means that the momentum is increasing in the current trend and when they converge, the current trend is losing momentum and the direction of the PA trend may flip towards the other direction (momentum flip).
PA+CG Level Momentum:
To use the CG Level as a momentum indicator, you need to pay attention to how the price and the CG level are moving away/closer from each other:
PA + CG Level Diverges = Momentum Increasing
PA + CG Level Converges = Momentum Decreasing
Examples (kind of common sense, but just for clarity):
Case 1: Bullish Divergence (Bullish): The PA is ABOVE and trending AWAY above from the CG Level = very bullish, this means that momentum is increasing towards the upside and larger moves will come (increasing gap between the price and CG Level)
Case 2: Bearish Convergence (Bearish): - The PA is ABOVE the CG Level and trending TOWARDS the CG Level = bearish, there is a possibility that the upward trend is ending. Look to start closing off long positions until case 1 (divergence) occurs again.
Case 3: Neutral - The PA is trading on the CG Level (no clear divergence or convergence between the PA and CG Level) = Indicates a back and forth (tug of war) between bears and bulls. Beware of choppy price patterns as the trend is undecisive until either supply/liquidity is dried out and a winner between bull/bear is chosen. This is a no trade zone, but do as you wish.
Case 4: Bearish Divergence (Bearish): The PA is BELOW and trending AWAY BELOW from the CG Level = very bearish, this means that momentum is increasing towards the downside and larger downward moves will come (increasing gap between the price and CG Level).
Case 5: Bullish Convergence (Bullish): - The PA is BELOW the CG Level and trending TOWARDS the CG Level = bullish, there is a possibility that the downward trend is ending and a trend flip is occuring. Look to start closing off short positions until case 4 (divergence) occurs again.
CG Bands + CG Level: You can use the CG bands instead of the PA candles to get a cleaner interpretation of reading the momentum. I won't go into detail as this is pretty self-explanatory. It is the same explanation as PA+CG Level Momentum, but you are replacing the PA candles with the CG Bands for interpretation. So instead of the PA converging/diverging from the CG Level, the Upper and Lower Bound levels are converging/diverging from the CG level instead.
Convergence: CG Level (yellow line) trades inside the CG bands
Divergence: CG Level (yellow line) trades outside the CG bands
Bullish/Bearish depends on whether the CG Band is trading below or above the CG level. If CG Band is above the CG Level, this is bullish. If CG Band is below the CG level, this is bearish.
Crosses (PA or CG Band crosses with CG level): This typically indicates volatility is incoming.
There are MANY MANY MANY other ways to use this indicator that is not explained here and even other undiscovered methods. Use some common sense as to how this indicator works (it is a momentum indicator and volatility predictor). You can get pretty creative and apply your own methods / knowledge to it and look for patterns that occur. Feel free to comment and share what you came up with!

ScalpiusTrendCrypto trader and trading system developer Scott Phillips recently introduced a crypto trading system that specifies a set of rules for determining whether the crypto is in a trend. While the rules are not overly complex, they are complex enough that manual trend determination is somewhat laborious and prone to error. The ScalpiusTrend script is designed to automate this process. It operates is briefly summarized as follows:
1. It looks for a bar that breaks the Bollinger Band. That starts a pending trend.
2. When we find another bar with a higher high and higher close (uptrend) or lower low and lower close (downtrend), then the trend is confirmed.
3. The trend ends when the price touches the opposite Bollinger Band, or goes 20 bars without making a new low and new close.
The indicator is shown as a histogram plot below the main chart window. By default, the short black pending trend bars are off, but you can enable the Pending Bars checkbox in the indicator Settings menu to turn them on.

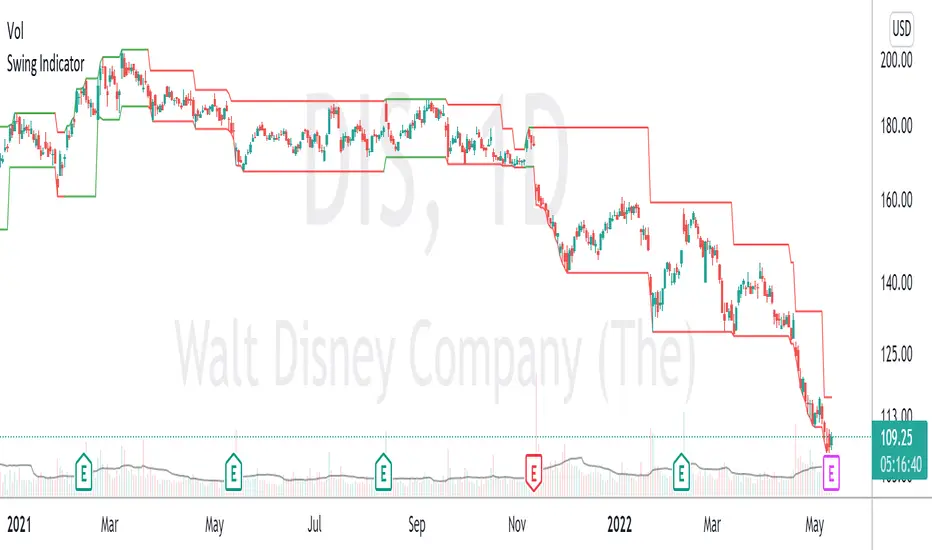
Swing High Swing Low This tool is the swing high swing low indicator. A swing high/low is a technical pattern that describes a local peak or trough on a chart. By connecting these peaks and troughs, we can determine the general direction the asset is trading. This indicator can be used on all time frames and in any market.
To use it, declare how many candles are needed to determine a swing level. By default, the indicator is set to two candles. This means that a candle must have two candles to the right AND left (totaling 5 consecutive candles) to be considered a swing level. If the middle candle has the highest high of the 5 consecutive candles, it will be classified as a Swing High. If the middle candle has the lowest low, it will be a Swing Low. Otherwise, it will be ignored.
Once a swing number is declared, the indicator will look for a starting swing high and swing low. The asset will trade inside the range established by the swing high/low lines. When the lines are parallel, it is considered a form of consolidation. You will likely see a lot of whipsaw action or chart patterns like bullflags or head-shoulders. Wait patiently for a break of this consolidation. The indicator will identify the new swing levels when the asset breaks out of this range.
Depending on the direction of the break, it will turn green for an uptrend or red for a downtrend. You should look to take long positions when the lines are green and short when the lines are red. You can use old swing levels as support or resistance in the future. The longer the line, the greater the likelihood that it will be support or resistance. This can help you identify potential entries.
The goal of this script is to make it easier to determine trends. Sometimes, we take the wrong trade because we don't understand which way the market is trending and what levels are important. This indicator is meant to take the guesswork out and make the trade easy and emotionless. This indicator works well on its own, but I suggest pairing it with another to add an extra confirmation before taking a trade. Happy Trading!
**Please note: Assets that have traded parabolically (steep inclines or declines) will have wide ranges that may not be broken. (see GME 2021)**
Market Bias (CEREBR)Hello Everyone. I hope you are all doing great. It's been a long time since I posted my first script here, and I got a lot of response from that.
So, I thought I should share this script also to everyone, and anyone that may find it useful. Personally, I use it to tell the general market conditions.
Here's how I works : The script tries to determine the overall direction of the market, using smoothed Heiken Ashi candles. The coloring system (using bright and dark colors) is an attempt to detect strong market and weak market conditions. There's also an oscillator within the script, but for now it isn't plotted. Credits to @jackvmk, I used part of his open-script code in this indicator.\
I have considered using the slope of the indicator plot as a filter for ranging market conditions. The plot goes relatively flat in 'flat' markets. However, I have not done anything about that yet. Maybe some other time.
I hope you find this useful. If you find a way to use this, please share it with the community in the comment section.
NOTE: THIS IS BY NO MEANS FINANCIAL ADVICE. You'll have to make your studies and come up with a way to apply this indicator to your trading style and strategy.
By the way, I would be going with the name 'CEREBR' for any subsequent scripts I release from now on.
Happy Trading, guys.

DiNapoli Candles TableThis indicator displays a matrix containing the color states of Dinapoli candles from Higher Timeframes.
Only Higher Timeframes states do appear in the table. Lower Timeframes are hidden due to inability to get reliable results for such behaviour in current Tradingview environment.
By default only 5 timeframes get activated: 1H, 4H, 1D, 1W and 1M. But many more are available to be displayed throught the Input Tab.
The position of the table can be customized through the input panel.
Note: The indicator is resource hungry, and sometimes it might need some seconds to fully populate the table.
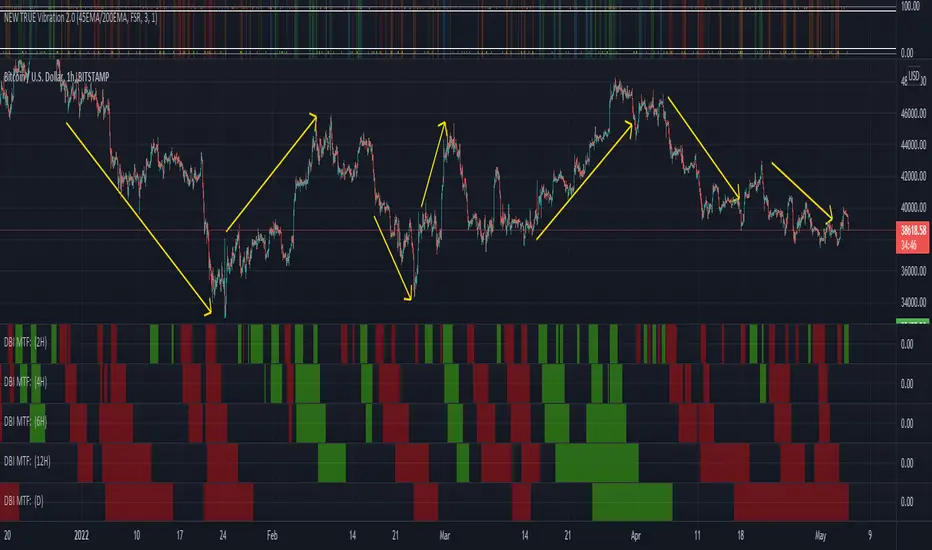
DBI MTFDBI is the Directional Bias Indicator
This is a Daily timeframe concept that we can take to MTF's. What DBI does it takes an advanced look at Trend to produce four results... Active Green (which simply gives EDGE to buying exhausted or weak pullbacks that hold Bull Market Structure), Last Green (which means the indicator turned active Green and lost some of the characteristics that allowed it to go Active Green (this is a natural part of any pullback process and during these times there is still EDGE to finding confluent reasons too look for Longs until the indicator again turns to Active Red)), Active Red (which simply gives EDGE to shorting exhausted or weak bounces that hold Bear Market Structure), and Last RED (which means the indicator turned active Red and lost some of the characteristics that allowed it to go Active Green (this is a natural part of any pullback process and during these times there is still EDGE to finding confluent reasons too short until the indicator again turns to Active Green)).
As mentioned, this is a Daily TF concept, but, this indicator allows you to look at the same formula from the 5-minute chart to the Weekly chart. The benefit here is that it can allow the trained eye to get a better view at times where Longs have the path of least resistance and time when shorts have the path of least resistance. If we can give ourselves some extra EDGE toward knowing the path of least resistance on time frames that are above our trigger TF (The TF we plan to take a trade on) then we can be better prepared to either keep a tighter stop or perhaps give a Long or a Short more room to run due to what seems to be a friendly environment.
This indicator takes some time to understand, but, it has also been a massive favorite for many True Vibration 2.0 users for quite some time as this was previously built into that indicator. Utilizing True Vibration 2.0 along with DBI will heighten your experience dramatically.
Future Grand Trend This my version of try to think about next movement of chart.
WARNING:
- For purpose educate only

Offbeat Trading Ultra Market StructureTools utilized at Offbeat Trading
This script combines ZigZag lines and ATR to indicate for the user which swing points are significant when reading market structure. What really makes this script unique is how well it defines key market structure points to help traders avoid getting caught in the "noise" of markets. The combination of ZZ and ATR works well to isolate the meaningful market structure breaks.
This tool defines key market structure points for you and is an alternative to discretionary read on market structure. At Offbeat Trading we utilize the script alongside different price action rules and concepts. The screenshot showcases one way of utilizing the script in order to get a strong and mechanical directional bias. Purple = key market structure points shown by the script. From there one should add an entry trigger the biased direction.
ATR can be tweaked with an input multiplier for different variations depending in trader preference. Default settings works optimally on H1 timeframe from personal testing.

ValiantTrader_Rsa Volume 3.0This indicator shows a trend for a day based on a current day candlestick especially for Scalpers and Intraday traders before they trade on lower timeframes.
Green And Red Arrows:
-Green arrows up below volume bars indicates a buy for a current day and Red arrows down above volume bars indicates a sell for a current day.
Orange and Black colors on volume bars are showing the volatility ;
-Orange indicates High Volatility for a current day then Black Indicates Low Volatility for a current day.

[Fedra Algotrading Super Duper Trend Filter]All-in-one trend filter
Trend-following strategies are relatively easy to achieve, especially in backtesting. If only we knew what trend we were in! Let me help you:
- MAs crossovers
- Selection of the type of MAs
- Selection of MAs periods
-Super trend (optional)
-Trend zones based on trend lines (optional)
- Secret sauce
How to use it?
Do not open Longs if it is red
Don't open Shorts if it's green.
Apply it to your strategies and check the impact of a reliable trend filter before opening your entries.

Multiple Indicator 50EMA Cross AlertsHere’s a screener including Symbol, Price, TSI, and 50 ema cross in a table output.
The 50 Exponential Moving Average is a trend indicator
You can find bullish momentum when the 50 ema crossed over or a bearish momentum when the 50 ema crossed under we are looking to take advantage by trading the reversion of these trends.
True strength index (TSI) is a trend momentum indicator
Readings are bullish when the True Strength Index shows positive values
Readings are bearish when the indicator displays negative values.
When a value is above 20, we look for selling overbought opportunity and when the value is under 20, we look for buying oversold opportunity.
You can select the pair of your choice in the settings.
Make sure to create an alert and choose any alerts then an alert will trigger when a price cross under or cross over the 50 ema for every pair separately.
This allow the user to verify if there is a trade set up or not.
Disclaimer
This post and the script don’t provide any financial advice.
