Smoothed Heikin Ashi Trend on Chart - TraderHalai BACKTESTSmoothed Heikin Ashi Trend on chart - Backtest
This is a backtest of the Smoothed Heikin Ashi Trend indicator, which computes the reverse candle close price required to flip a Heikin Ashi trend from red to green and vice versa. The original indicator can be found in the scripts section of my profile.
This particular back test uses this indicator with a Trend following paradigm with a percentage-based stop loss.
Note, that backtesting performance is not always indicative of future performance, but it does provide some basis for further development and walk-forward / live testing.
Testing was performed on Bitcoin , as this is a primary target market for me to use this kind of strategy.
Sample Backtesting results as of 10th June 2022:
Backtesting parameters:
Position size: 10% of equity
Long stop: 1% below entry
Short stop: 1% above entry
Repainting: Off
Smoothing: SMA
Period: 10
8 Hour:
Number of Trades: 1046
Gross Return: 249.27 %
CAGR Return: 14.04 %
Max Drawdown: 7.9 %
Win percentage: 28.01 %
Profit Factor (Expectancy): 2.019
Average Loss: 0.33 %
Average Win: 1.69 %
Average Time for Loss: 1 day
Average Time for Win: 5.33 days
1 Day:
Number of Trades: 429
Gross Return: 458.4 %
CAGR Return: 15.76 %
Max Drawdown: 6.37 %
Profit Factor (Expectancy): 2.804
Average Loss: 0.8 %
Average Win: 7.2 %
Average Time for Loss: 3 days
Average Time for Win: 16 days
5 Day:
Number of Trades: 69
Gross Return: 1614.9 %
CAGR Return: 26.7 %
Max Drawdown: 5.7 %
Profit Factor (Expectancy): 10.451
Average Loss: 3.64 %
Average Win: 81.17 %
Average Time for Loss: 15 days
Average Time for Win: 85 days
Analysis:
The strategy is typical amongst trend following strategies with a less regular win rate, but where profits are more significant than losses. Most of the losses are in sideways, low volatility markets. This strategy performs better on higher timeframes, where it shows a positive expectancy of the strategy.
The average win was positively impacted by Bitcoin’s earlier smaller market cap, as the percentage wins earlier were higher.
Overall the strategy shows potential for further development and may be suitable for walk-forward testing and out of sample analysis to be considered for a demo trading account.
Note in an actual trading setup, you may wish to use this with volatility filters, combined with support resistance zones for a better setup.
As always, this post/indicator/strategy is not financial advice, and please do your due diligence before trading this live.
Original indicator links:
On chart version -
Oscillator version -
Update - 27/06/2022
Unfortunately, It appears that the original script had been taken down due to auto-moderation because of concerns with no slippage / commission. I have since adjusted the backtest, and re-uploaded to include the following to address these concerns, and show that I am genuinely trying to give back to the community and not mislead anyone:
1) Include commission of 0.1% - to match Binance's maker fees prior to moving to a fee-less model.
2) Include slippage of 10 ticks (This is a realistic slippage figure from searching online for most crypto exchanges)
3) Adjust account balance to 10,000 - since most of us are not millionaires.
The rest of the backtesting parameters are comparable to previous results:
Backtesting parameters:
Initial capital: 10000 dollars
Position size: 10% of equity
Long stop: 2% below entry
Short stop: 2% above entry
Repainting: Off
Smoothing: SMA
Period: 10
Slippage: 10 ticks
Commission: 0.1%
This script still remains to shows viability / profitablity on higher term timeframes (with slightly higher drawdown), and I have included the backtest report below to document my findings:
8 Hour:
Number of Trades: 1082
Gross Return: 233.02%
CAGR Return: 14.04 %
Max Drawdown: 7.9 %
Win percentage: 25.6%
Profit Factor (Expectancy): 1.627
Average Loss: 0.46 %
Average Win: 2.18 %
Average Time for Loss: 1.33 day
Average Time for Win: 7.33 days
Once again, please do your own research and due dillegence before trading this live. This post is for education and information purposes only, and should not be taken as financial advice.
Trend

Rate Of Change Trend Strategy (ROC)This is very simple trend following or momentum strategy. If the price change over the past number of bars is positive, we buy. If the price change over the past number of bars is negative, we sell. This is surprisingly robust, simple, and effective especially on trendy markets such as cryptos.
Works for many markets such as:
INDEX:BTCUSD
INDEX:ETHUSD
SP:SPX
NASDAQ:NDX
NASDAQ:TSLA

Bozz Strategy
Booz Backtesting : Booz Backtesting is a method for analyzing the performance of your current trading strategy . Booz Backtesting aims to help you generate results and evaluate risk and return without risking real capital.
The Booz Backtesting is the Booz Super Swing Indicator equivalent but gives you the ability to backtest data on different charts.
This is an Indicator created for the purpose of identifying trends in Multiple Markets, it is based on Moving Average Crossover and extra features.
Swing Trading: This function allows you to navigate the entire trend until it is not strong enough, so you can compare it with fixed parameters such as Take Profit and Stop Loss.
Take Profit and Stop Loss function: With this function you will be able to choose the most optimal parameters and see in real time the results in order to choose the best combination of parameters.
Leverage : We have this function for the futures markets where you can check which is the most appropriate leverage for your operation.
Trend Filter: allows you to take multiple entries in the same direction of the market.
If the market crosses below the 200 moving average, it will take only short entries.
If the market crosses above the 200 moving average, it will take only long entries.
Timeframes
Charting from 1 Hour, 4 Hour, Daily, Weekly, Weekly
Markets :Booz Backtesting can be tested in Cryptocurrency, Stocks and Futures markets.
Background Color : at a glance, you can see what cycle the market is in.
Green background : Shows that the market is in a bullish cycle.
Red background: Shows that the market is in a bearish cycle.
Twitter
Website

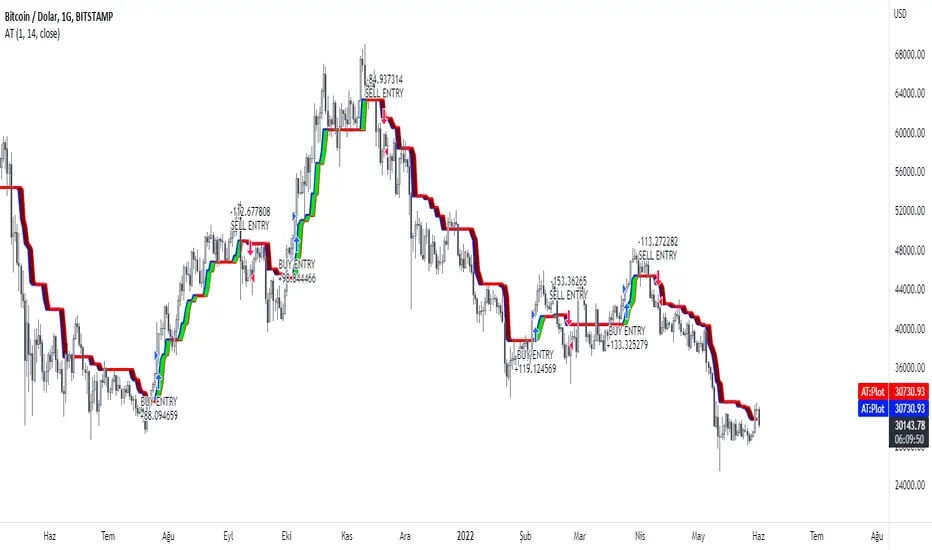
AlphaTrend StrategyI turned the Alpha Trend indicator coded by our teacher Kıvanç Özbilgiç into a strategy. You can find the original version of the indicator here.
It sends trading signals in the regions where AlphaTrend produces Buy and Sell signals. It is a two-way strategy.
Buy Entry Long opens trade, Sell Entry Short opens trade.
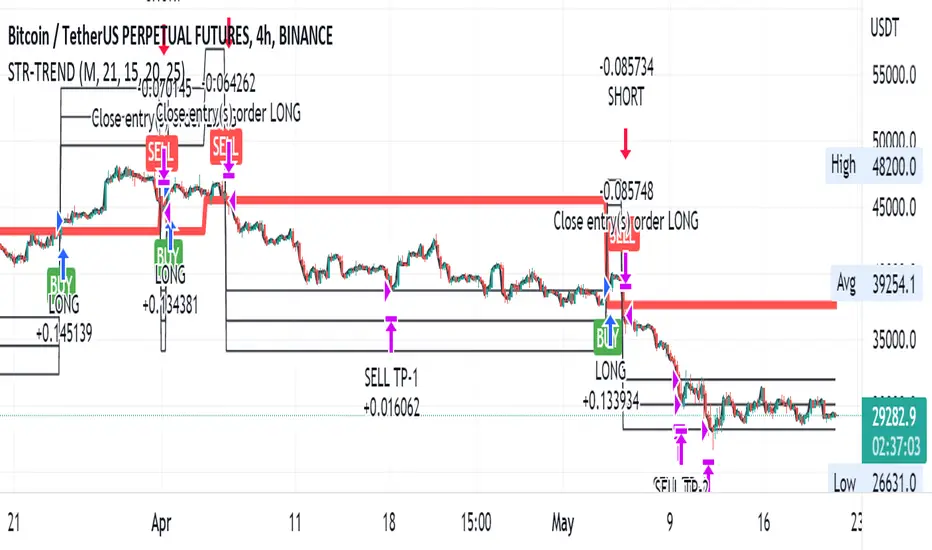
Straight Trend V1Hello everyone,
We are proud to present you our "Straight Trend" Strategy.
Strategy is use a specified timeline's opening price as reference and draw a line between the current price and trend line.
Trend line is smoothed with last X times of highest and lowest values ( Donchian Methodology) in order to create less noise and fake alerts , therefore creates a channel of current prices time based opening price.
The timeline can be adjusted according to your specifications in the settings.
------
Why opening price ?
We are traders ,no matter what we do ,we always make a benchmark at the end of a day , week or at the end of a specified time line.
Example :
X commodity's price increased %15 in last days or Y commodity's price dropped %30 in last 2 weeks etc. etc.
Thats why the opening price have a hidden and much more important role in our trading sessions.
------
After the channel is created we remove the unnecessary lines from our output by filtering the direction with closing price.
IF the closing price is higher than Chanel reference price and direction goes upward the script gives you a BUY signal.
The same methodology is applied for SELL operations.
When to Take Profit?
We put a setting for profit percentage in scripts setting you can adjust the ratio as your choices.
When to Stop Loss or change direction of the trade?
The Straight Trends previously mentioned channel's inverse line was set as STOP LOSS and direction changer in the strategy with "STR-X" Marker.
Note : Strategy is much more effective with heikin-ashi bars due methodology of heikin ashi and with this bars it creates less signals with more accuracy, use at your own discretion.
Please don't hesitate to write us if you need support or assistance, we also appreciate your feedbacks.
Please be advised that this strategy is published with Educational Purposes and it is not a investment advice.
Thank you in advance.
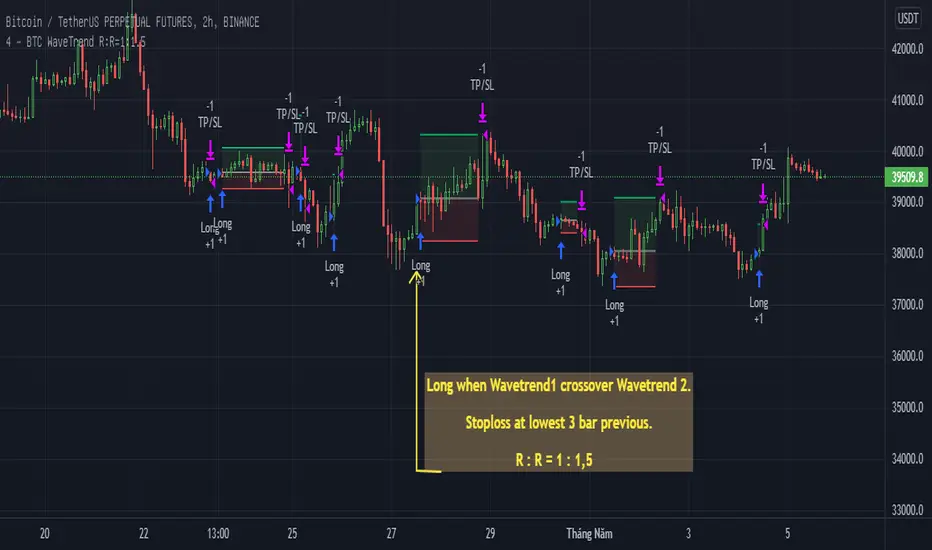
BTC WaveTrend R:R=1:1.5In this strategy, I used Wavetrend indicator (Lazy Bear).
It is very simple and easy to understanding: Long when Wavetrend1 crossover Wavetrend2 and they are less than a limit value (not buy when price overbought). Stoploss at lowest 3 bar previous. R:R = 1:1,5.
About other shortterm strategies for crypto market, you can view my published strategies.
EMA bands + leledc + bollinger bands trend following strategy v2The basics:
In its simplest form, this strategy is a positional trend following strategy which enters long when price breaks out above "middle" EMA bands and closes or flips short when price breaks down below "middle" EMA bands. The top and bottom of the middle EMA bands are calculated from the EMA of candle highs and lows, respectively.
The idea is that entering trades on breakouts of the high EMAs and low EMAs rather than the typical EMA based on candle closes gives a bit more confirmation of trend strength and minimizes getting chopped up. To further reduce getting chopped up, the strategy defaults to close on crossing the opposite EMA band (ie. long on break above high EMA middle band and close below low EMA middle band).
This strategy works on all markets on all timeframes, but as a trend following strategy it works best on markets prone to trending such as crypto and tech stocks. On lower timeframes, longer EMAs tend to work best (I've found good results on EMA lengths even has high up to 1000), while 4H charts and above tend to work better with EMA lengths 21 and below.
As an added filter to confirm the trend, a second EMA can be used. Inputting a slower EMA filter can ensure trades are entered in accordance with longer term trends, inputting a faster EMA filter can act as confirmation of breakout strength.
Bar coloring can be enabled to quickly visually identify a trend's direction for confluence with other indicators or strategies.
The goods:
Waiting for the trend to flip before closing a trade (especially when a longer base EMA is used) often leaves money on the table. This script combines a number of ways to identify when a trend is exhausted for backtesting the best early exits.
"Delayed bars inside middle bands" - When a number of candle's in a row open and close between the middle EMA bands, it could be a sign the trend is weak, or that the breakout was not the start of a new trend. Selecting this will close out positions after a number of bars has passed
"Leledc bars" - Originally introduced by glaz, this is a price action indicator that highlights a candle after a number of bars in a row close the same direction and result in greatest high/low over a period. It often triggers when a strong trend has paused before further continuation, or it marks the end of a trend. To mitigate closing on false Leledc signals, this strategy has two options: 1. Introducing requirement for increased volume on the Leledc bars can help filter out Leledc signals that happen mid trend. 2. Closing after a number of Leledc bars appear after position opens. These two options work great in isolation but don't perform well together in my testing.
"Bollinger Bands exhaustion bars" - These bars are highlighted when price closes back inside the Bollinger Bands and RSI is within specified overbought/sold zones. The idea is that a trend is overextended when price trades beyond the Bollinger Bands. When price closes back inside the bands it's likely due for mean reversion back to the base EMA in which this strategy will ideally re-enter a position. Since the added RSI requirements often make this indicator too strict to trigger a large enough sample size to backtest, I've found it best to use "non-standard" settings for both the bands and the RSI as seen in the default settings.
"Buy/Sell zones" - Similar to the idea behind using Bollinger Bands exhaustion bars as a closing signal. Instead of calculating off of standard deviations, the Buy/Sell zones are calculated off multiples of the middle EMA bands. When trading beyond these zones and subsequently failing back inside, price may be due for mean reversion back to the base EMA. No RSI filter is used for Buy/Sell zones.
If any early close conditions are selected, it's often worth enabling trade re-entry on "middle EMA band bounce". Instead of waiting for a candle to close back inside the middle EMA bands, this feature will re-enter position on only a wick back into the middle bands as will sometimes happen when the trend is strong.
Any and all of the early close conditions can be combined. Experimenting with these, I've found can result in less net profit but higher win-rates and sharpe ratios as less time is spent in trades.
The deadly:
The trend is your friend. But wouldn't it be nice to catch the trends early? In ranging markets (or when using slower base EMAs in this strategy), waiting for confirmation of a breakout of the EMA bands at best will cause you to miss half the move, at worst will result in getting consistently chopped up. Enabling "counter-trend" trades on this strategy will allow the strategy to enter positions on the opposite side of the EMA bands on either a Leledc bar or Bollinger Bands exhaustion bar. There is a filter requiring either a high/low (for Leledc) or open (for BB bars) outside the selected inner or outer Buy/Sell zone. There are also a number of different close conditions for the counter-trend trades to experiment with and backtest.
There are two ways I've found best to use counter-trend trades
1. Mean reverting scalp trades when a trend is clearly overextended. Selecting from the first 5 counter-trend closing conditions on the dropdown list will usually close the trades out quickly, with less profit but less risk.
2. Trying to catch trends early. Selecting any of the close conditions below the first 5 can cause the strategy to behave as if it's entering into a new trend (from the wrong side).
This feature can be deadly effective in profiting from every move price makes, or deadly to the strategy's PnL if not set correctly. Since counter-trend trades open opposite the middle bands, a stop-loss is recommended to reduce risk. If stop-losses for counter-trend trades are disabled, the strategy will hold a position open often until liquidation in a trending market if th trade is offsides. Note that using a slower base EMA makes counter-trend stop-losses even more necessary as it can reduce the effectiveness of the Buy/Sell zone filter for opening the trades as price can spend a long time trending outside the zones. If faster EMAs (34 and below) are used with "Inner" Buy/Zone filter selected, the first few closing conditions will often trigger almost immediately closing the trade at a loss.
The niche:
I've added a feature to default into longs or shorts. Enabling these with other features (aside from the basic long/short on EMA middle band breakout) tends to break the strategy one way or another. Enabling default long works to simulate trying to acquire more of the asset rather than the base currency. Enabling default short can have positive results for those high FDV, high inflation coins that go down-only for months at a time. Otherwise, I use default short as a hedge for coins that I hold and stake spot. I gain the utility and APR of staking while reducing the risk of holding the underlying asset by maintaining a net neutral position *most* of the time.
Disclaimer:
This script is intended for experimenting and backtesting different strategies around EMA bands. Use this script for your live trading at your own risk. I am a rookie coder, as such there may be errors in the code that cause the strategy to behave not as intended. As far as I can tell it doesn't repaint, but I cannot guarantee that it does not. That being said if there's any question, improvements, or errors you've found, drop a comment below!

Oversold RSI with Tight Stop-Loss Strategy (by Coinrule)KRAKEN:LINKUSD
This is one of the best strategies that can be used to get familiar with technical indicators and start to include them in your rules on Coinrule .
ENTRY
1. This trading system uses the RSI (Relative Strength Index) to anticipate good points to enter positions. RSI is a technical indicator frequently used in trading. It works by measuring the speed and change of price movements to determine whether a coin is oversold (indicating a good entry point) or overbought (indicating a point of exit/entry for a short position). The RSI oscillates between 0 and 100 and is traditionally considered overbought when over 70 and oversold when below 30.
2. To pick the right moment to buy, the strategy enters a trade when the RSI falls below 30 indicating the coin is oversold and primed for a trend reversal.
EXIT
The strategy then exits the position when the price appreciates 7% from the point of entry. The position also maintains a tight stop-loss and closes the position if the price depreciates 1% from the entry price. The idea behind this is to cut your losing trades fast and let your winners ride.
The best time frame for this strategy based on our back testing data is the daily. Shorter time frames can also work well on certain coins, however in our experience, the daily works best. Feel free to experiment with this script and test it on a variety of your coins! With our back testing data a trading fee of 0.1% is taken into account. The fee is aligned to the base fee applied on Binance, which is the largest cryptocurrency exchange by volume. In the example shown, this strategy made a handsome net profit of 52.6% on Chainlink with 66.67% of trades being profitable.
You can execute this strategy on your favorite exchanges with Coinrule .

Small short for CryptoThis is the third modification of VuMAnChu cipher B indicator designed only for short sales.
The trigger signal is called sommi bearish diamond (according to my due diligence it has the best performance)
You can either fix a stop loss value or close position after crossing sma line.
Take profit also can be tuned.
Keep in mind that short positions are very risky, so deposit your money to the market only after your research. I guess this indicator has potential for repainting, so track backtests/forward tests carefully. The script is for entertainment purposes only.
Good luck and have fun!

TICK Scalping strategy, SPY 1 min1 min chart scalping version of my other TICK strategy with adjusted parameters and additional entry and exit conditions better suited for 1 min SPY chart. Please refer to my original TICK strategy for explanation.
Important notes:
1. This strategy is designed for same day SPY option scalping on the 1 min chart . All profit shown in back testing report is based on Profit/Loss (P/L) estimates from trading options with approximately 6 weeks of data. By default, it is set to 10 option contracts. By default the initial capital is set to $5000. Pyramiding is set to 3.
2. This strategy works better with non-extended market data .
3. This strategy is mainly developed for SPY trading on 1 min chart, it probably will not be very profitable with other tickers or time frame without tweaking all the parameters first.
Cheers and enjoy~! Let's all make money~!!

TICK strategy for SPY optionsImportant notes:
1. This strategy is designed for same day SPY option scalping. All profit shown in back testing report is based on Profit/Loss (P/L) estimates from trading options with approximately 6 months of data. By default, it is set to 10 option contracts. By default the initial capital is set to $5000. Pyramiding is set to 3.
2. This strategy works better with non-extended market data.
3. This strategy is mainly developed for SPY trading on 5 min chart, it probably will not be very profitable with other tickers or time frame without tweaking all the parameters first.
4. This strategy will work with QQQ as well, but please adjust the profit multiplier to match the P/L of QQQ options.
How it works:
When trading the indices, many rely on the TICK for market directions. This strategy is a trend following strategy that uses a combination of conditions using the following indicators:
- TICK
- RSI
- VIX volatility index
- EMA
For entries, the conditions are:
1. TICK moving average crossover with a delayed signal line
2. Bullish or bearish RSI signal, RSI > 50 for bullish, < 50 for bearish
3. VIX must be above a certain threshold to take advantage of high market volatility
4. Price must be on top of EMA line for long, and below for short
For exits, there are 3 scenarios:
1. Stop loss set by a percentage of the daily ATR value
2. Trend changes on the TICK and the RSI
3. Bearish or bullish divergence on price with TICK
This strategy automatically signal to close all trades at 3:50 pm EST at the end of the day.
Extras:
- There is an option to show P/L for reinvesting profits
Enjoy~!!! Let's all make $$$

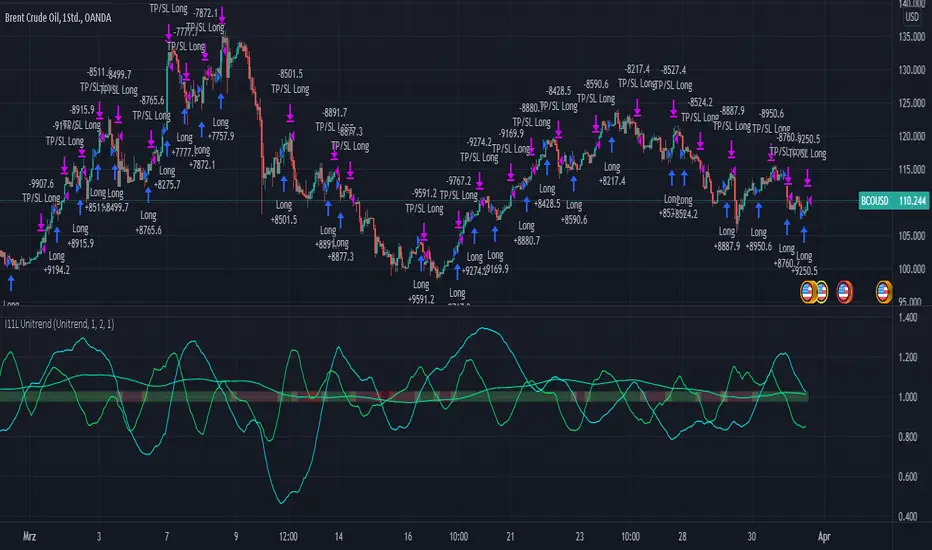
RSI, EMA, SMA Trendtrading - Oil Daytrading 1HThe Unitrend trading System produces trading recommendations on a pure Trend basis.
It is a Score based system.
--- How to use the System --
Simply adjust your capital you want to risk per trade and your TP Factor.
The TP Factor is the multiple of your risked Capital, also known as Risk/Reward ratio.
Furthermore you can toggle between a always Buy mode, to see if the System is better then market.
Compounding mode helps you to get a better understanding of your maximum drawdown with a total equity based approach.
--- How are Signals produced? ---
A score of 2 or 3 is a BUY signal.
You can count the score by looking at the lines above 1, or by reading the color.
Green is 3, yellow 2, orange 1 and red is 0.
The score is calculated by 3 conditions.
Each applying condition yields one point for the score.
The score resets each bar.
The rules are:
RSI > 45: Well known indicator, usually looks for reversal points but seems to produce above average results when above 45.
EMA(RSI) > SMA(RSI): My approach to momentum detection for the RSI movement, I consider a faster growing RSI as a good thing.
EMA(close) > SMA(close): My approach to trend detection for the market movement. Common Wisdom would be a fast SMA > slow SMA which I found to be too slow for the modern market.
Triple ThreatThis indicator provides buy and sell signals for Bitcoin based on confluence from well-known momentum, volatility, and trend indicators. It has successfully captured the major directional trends on Bitcoin's daily chart since 2018, and the settings are currently optimized for this chart in particular. This indicator implements RSI to gauge momentum, BBWP to gauge volatility, and an EMA to gauge trend. Maximum confluence signals are represented by horizontal bars in the indicator's pane, where the tallest green bar is a confirmed buy signal, and the tallest red bar is a confirmed sell signal. The shortest bar represents a momentum-only signal, and the second-shortest bar represents a volatility signal in confluence with the previously given momentum signal.
To track momentum, the RSI is plotted to the indicator plane against a moving average of the RSI. A momentum signal is generated when the RSI crosses over its moving average, retests/approaches the moving average, and then continues in the crossover direction (i.e., it fails to cross the moving average to the opposite side, creating a successful retest). The settings that affect this trigger are the "Crossover Threshold," which specifies how much the RSI should exceed the moving average to be considered a crossover, and the "Retest threshold," which specifies how closely the RSI should approach the moving average to be considered a retest. A momentum signal is ALSO generated if the RSI or its moving average exceed their counterpart by a certain threshold. For example, if the threshold was set at 10, a BUY signal would be generated when the RSI exceeds the moving average by 10, or a SELL signal would be generated when the moving average exceeds the RSI by 10. This threshold can be set using the "Instant Signal Threshold" setting. Either type of momentum signal will be plotted on the pane as the shortest horizontal bar, with its color indicating the signal's direction.
Volatility is primarily measured using the Bollinger Band Width Percentile (BBWP) indicator, which was created by The_Caretaker. BBWP plots the volatility of the asset's price, given by Bollinger Band width, relative to past volatility by assigning the volatility readings into percentiles. The indicator also includes a moving average of the BBWP itself, where a crossover to the upside represents expanding volatility and a crossover to the downside represents contracting volatility. This indicator is used to confirm a signal given by the momentum indicators - a momentum signal that is given during a period of expanding volatility has a greater likelihood of success. Therefore, when the BBWP crosses above its moving average by a given threshold, a previously triggered momentum signal is considered to be "confirmed." The threshold for this crossover can be set using the "BBWP Confirmation Threshold" setting. However, it is also relevant that periods of extreme volatility often accompany an extremity in price action (a "top" or "bottom"), in which case the BBWP is likely to contract after price reaches such an extremity. This phenomenon is captured by also using "extreme reads" on the momentum indicator to signal that there has already been enough volatility to confirm a momentum signal. If the RSI gives an "extreme read" before triggering a signal, the momentum signal is also considered to be confirmed. For example, if the RSI is above 80, breaks below 80, and then gives a SELL signal, this sell signal is considered to be confirmed without requiring the BBWP to crossover its moving average to the upside. The threshold that would confirm a SELL signal can be set with the "Overbought" setting, and the threshold that would confirm a BUY signal can be set with the "Oversold" setting. Whenever a volatility signal confirms a momentum signal, a medium-sized horizontal bar will be plotted on the pane in the same directional color as the momentum signal. Note that a momentum signal may trigger at the exact same time as the volatility signal which confirms it; in this case, only the medium-sized bar will be visible on the pane, but its direction can still be identified by its color.
Lastly, to reduce the likelihood of "false signals," a trend indicator is used to confirm the direction of the signal. This is typically an exponential moving average. If a confirmed volatility SELL signal is given, and the closing price is below the moving average, then the SELL signal is also confirmed by the trend. Likewise, if a confirmed volatility BUY signal is given, and the closing price is above the moving average, then the BUY signal is confirmed by the trend. The type and length of the moving average used to verify the trend can be set using the "Moving Average Type" and "Moving Average Length" settings found below the momentum/volatility settings. A trend signal is plotted on the pane as a tall horizontal bar, and is more deeply colored than the momentum and volatility signals.
For maximum confluence, it is recommended that the trend signal, given by the tallest bar, is the one that forms the basis of trades executed while using the Triple Threat indicator. It is possible to enter more aggressive trades with better entries by using only the volatility signal, given by the medium-sized bar, however this entails greater risk and should only be done in confluence with an additional trading strategy of your own discretion. Backtesting has shown that using the volatility signal alone underperforms using the volatility signal in confluence with the trend signal.
Please also be advised that the default setting are optimized for Bitcoin's daily chart only. The indicator is still applicable to other timeframes and asset classes, but the settings may need to be modified. I have a list of settings for other Bitcoin timeframes, and I would be happy to share them upon request.
I hope you can find this indicator to be of some use to your trading strategies. I'd be happy to hear any feedback from the community, so please don't hesitate to reach out. Stay safe, and happy trading.

Mix1 : Ema Cross + Trend Channel [Gu5] - BacktestBacktest of the indicator "Mix1: Ema Cross + Trend Channel "
Trend indicator, by the crossing of moving averages
SMA200 with a channel as a filter confirms the trend.
The crossing of two moving averages, give alert only in trend.

TFO + ATR Strategy with Trailing Stop LossThis strategy is an experiment to learn what happens when The Trend Flex Oscillator (by Dr. John Ehlers) is used in conjunction with a volatility indicator like ATR. It was designed with cryptocurrency trading in mind.
The way I coded this experiment makes it unsuitable for bear market conditions.
When applied to a bull market, this trend-following strategy will open long positions when oversold price action appear to be reversing. It will typically close a position within a few days unless it gets caught in a bear market, in which case it holds on for dear life. I have tried to make back-testing very simple, but you should never trust it. It's merely and interesting tool for adjusting the many parameters that I've made editable in the configuration window. Those values include the ATR and TFO parameters, as well as setting a trailing stop loss. When closing a position, the strategy can optionally be told to ignore the trend analysis and only obey the trailing stop loss value. I've made an attempt to allow the user to define the minimum profit necessary to allow the strategy to close all all positions. In my observations, the 2H candlestick charts seem to produce the best results, although the parameters of the strategy could theoretically be adjusted to suit other time periods.
In summary...
This strategy has a bias for HODL (Holds on to Losses) meaning that it provides NO STOP LOSS protection!
Also note that the default behavior is designed for up to 15 open long orders, and executes one order to close them all at once.
Opening a long position is predicated on The Trend Flex Oscillator (TFO) rising after being oversold, and ATR above a certain volatility threshold.
Closing a long is handled either by TFO showing overbought while above a certain ATR level, or the Trailing Stop Loss. Pick one or both.
If the strategy is allowed to sell before a Trailing Stop Loss is triggered, you can set a "must exceed %". Do not mistake this for a stop loss.
Short positions are not supported in this version. Back-testing should NEVER be considered an accurate representation of actual trading results.
// portions © allanster (date window code)
// portions © Dr. John Ehlers (Trend Flex Oscillator)
This code is provided for educational purposes only. The results of this strategy should not be considered investment advice.
The user of this script acknowledges that it can result in serious financial loss when used as a trading tool

[cache_that_pass] 1m 15m Function - Weighted Standard DeviationTradingview Community,
As I progress through my journey, I have come to the realization that it is time to give back. This script isn't a life changer, but it has the building blocks for a motivated individual to optimize the parameters and have a production script ready to go.
Credit for the indicator is due to @rumpypumpydumpy
I adapted this indicator to a strategy for crypto markets. 15 minute time frame has worked best for me.
It is a standard deviation script that has 3 important user configured parameters. These 3 things are what the end user should tweak for optimum returns. They are....
1) Lookback Length - I have had luck with it set to 20, but any value from 1-1000 it will accept.
2) stopPer - Stop Loss percentage of each trade
3) takePer - Take Profit percentage of each trade
2 and 3 above are where you will see significant changes in returns by altering them and trying different percentages. An experienced pinescript programmer can take this and build on it even more. If you do, I ask that you please share the script with the community in an open-source fashion.
It also already accounts for the commission percentage of 0.075% that Binance.US uses for people who pay fees with BNB.
How it works...
It calculates a weighted standard deviation of the price for the lookback period set (so 20 candles is default). It recalculates each time a new candle is printed. It trades when price lows crossunder the bottom of that deviation channel, and sells when price highs crossover the top of that deviation channel. It works best in mid to long term sideways channels / Wyckoff accumulation periods.

Daily HIGH/LOW strategyThis is a DAILY High/LOW strategy combined with a moving average and volume for more accuracy.
The rules are simple :
For long if we had a cross of the high with the previous high and close of the candle is above moving average and chaikin money flow volume is positive we have a long entry.
We exit when we cross down the moving average with the close of the candle.
For short if we had a crossdown of the low with the previous low and close of the candle is below moving average and chaikin money flow volume is negative we have a short entry.
We exit when we cross above the moving average with the close of the candle.
This strategy has no risk management inside so use it with caution.
If you have any questions, let me know

RSI Rising Crypto Trending StrategyThis is crypto and stock market trending strategy designed for long timeframes such as 4h+
From my tests it looks like it works better to trade crypto against crypto than trading against fiat.
Indicators used:
RSI for rising/falling of the trend
BB sidemarket
ROC sidemarket
Rules for entry
For long: RSI values are rising, and bb and roc tells us we are not in a sidemarket
For long: RSI values are falling, and bb and roc tells us we are not in a sidemarket
Rules for exit
We exit when we receive an opposite direction.
Cuation: Because this strategy uses no risk management, I recommend you takje care with it.
If you have any questions, let me know !

Swing VWAP Weekly Stock and Crypto StrategyThis is a simple yet very efficient swing strategy designed for crypto and stock market, using big timeframes.
Its main component is VWAP weekly, so for best scenarios its better to use big timeframes such as 8h+.
The rules for entry are simple:
If our close if above vwap weekly we enter long .
If our close is below vwap weekly we enter short.
We exit from the trade, when a reverse condition than the entry one is triggered.
Because this strategy has no risk management inside, I recommend to be careful with it.
If you have any questions, let me know

DMI + HMA - No Risk ManagementDMI (Directional Movement Index) and HMA (Hull Moving Average)
The DMI and HMA make a great combination, The DMI will gauge the market direction, while the HMA will add confirmation to the trend strength.
What is the DMI?
The DMI is an indicator that was developed by J. Welles Wilder in 1978. The Indicator was designed to identify in which direction the price is moving. This is done by comparing previous highs and lows and drawing 2 lines.
1. A Positive movement line
2. A Negative movement line
A third line can be added, which would be known as the ADX line or Average Directional Index. This can also be used to gauge the strength in which direction the market is moving.
When the Positive movement line (DI+) is above the Negative movement line (DI-) there is more upward pressure. Ofcourse visa versa, when the DI- is above the DI+ that would indicate more downwards pressure.
Want to know more about HMA? Check out one of our other published scripts
What is this strategy doing?
We are first waiting for the DMI to cross in our favoured direction, after that, we wait for the HMA to signal the entry. Without both conditions being true, no trade will be made.
Long Entries
1. DI+ crosses above DI-
2. HMA line 1 is above HMA line 2
Short Entries
1. DI- Crosses above DI+
2. HMA line 1 is below HMA lilne 2
Its as simple as that.
Conclusion
While this strategy does have its downsides, that can be reduced by adding some risk manegment into the script. In general the trade profitability is above average, And the max drawdown is at a minimum.
The settings have been optimised to suite BTCUSDT PERP markets. Though with small adjustments it can be used on many assets!

Av3Based on the ANNE EA v3 for MT4. For use on FOREX.
if ATR is greater than ATR average taken from last 5 candles, then market considered as trending, and so Open(0)>Close(1)=buy Open(0)Close(1)=sell Open(0)

High/Low Channel Multi averages Crypto Swing strategyThis is a swing strategy designed for trending markets such as crypto and stock, with big timeframes , like 8h.
For this strategy we take SMA, EMA, VWMA, ALMA, SMMA, LSMA and VWMA and make an apply them all to both HIGH and LOW separately and make 2 averages, 1 applied to high and the other applied to low.
With them we make a channel.
Rules for entry
For long: close of a candle is above avg applied to high.
For short: close of a candle is below avg applied to low.
Rules for exit
We exit when we either hit TP or SL or when we receive a different condition than the entry one.(long- > short and viceversa)
If you have any questions, let me know !

Swing/Scalper HULL + T3 avg Crypto StrategyThis is a both a swing and a scalper strategy(depends on the timeframe that you use), that works with all timeframes, however I noticed that with swing 3h works the best on most crypto pairs, such as ETH, BTC and so on.
Its main components are:
Hull moving average
T3 moving average
Risk management
With them I make an average and use it as the main moving average.
Rules for entry
For long: Average moving average is bigger than previous average moving average value.
For short:Average moving average is lower than previous average moving average value.
Rules for exit
We exit when either the TP/SL has been hit, or when we get a different condition than previous one(both for long and short).
If you have any questions, let me know !
