Yesterday’s High Breakout - Trend Following StrategyYesterday’s High Breakout it is a trading system based on the analysis of yesterday's highs, it works in trend-following mode therefore it opens a long position at the breakout of yesterday's highs even if they occur several times in one day.
There are several methods for exiting a trade, each with its own unique strategy. The first method involves setting Take-Profit and Stop-Loss percentages, while the second utilizes a trailing-stop with a specified offset value. The third method calls for a conditional exit when the candle closes below a reference EMA.
Additionally, operational filters can be applied based on the volatility of the currency pair, such as calculating the percentage change from the opening or incorporating a gap to the previous day's high levels. These filters help to anticipate or delay entry into the market, mitigating the risk of false breakouts.
In the specific case of NULS, a 9% Take-Profit and a 3% Stop-Loss were set, with an activated trailing-stop percentage. To postpone entry and avoid false breakouts, a 1% gap was added to the price of yesterday's highs.
Name : Yesterday's High Breakout - Trend Follower Strategy
Author : @tumiza999
Category : Trend Follower, Breakout of Yesterday's High.
Operating mode : Spot or Futures (only long).
Trade duration : Intraday.
Timeframe : 30M, 1H, 2H, 4H
Market : Crypto
Suggested usage : Short-term trading, when the market is in trend and it is showing high volatility.
Entry : When there is a breakout of Yesterday's High.
Exit : Profit target or Trailing stop, Stop loss or Crossunder EMA.
Configuration :
- Gap to anticipate or postpone the entry before or after the identified level
- Rate of Change for Entry Condition
- Take Profit, Stop Loss and Trailing Stop
- EMA length
Backtesting :
⁃ Exchange: BINANCE
⁃ Pair: NULSUSDT
⁃ Timeframe: 2H
⁃ Fee: 0.075%
⁃ Slippage: 1
- Initial Capital: 10000 USDT
- Position sizing: 10% of Equity
- Start : 2018-07-26 (Out Of Sample from 2022-12-23)
- Bar magnifier: on
Credits : LucF for Pine Coders (f_security function to avoid repainting using security)
Disclaimer : Risk Management is crucial, so adjust stop loss to your comfort level. A tight stop loss can help minimise potential losses. Use at your own risk.
How you or we can improve? Source code is open so share your ideas!
Leave a comment and smash the boost button!
Thanks for your attention, happy to support the TradingView community.
Trailingstop

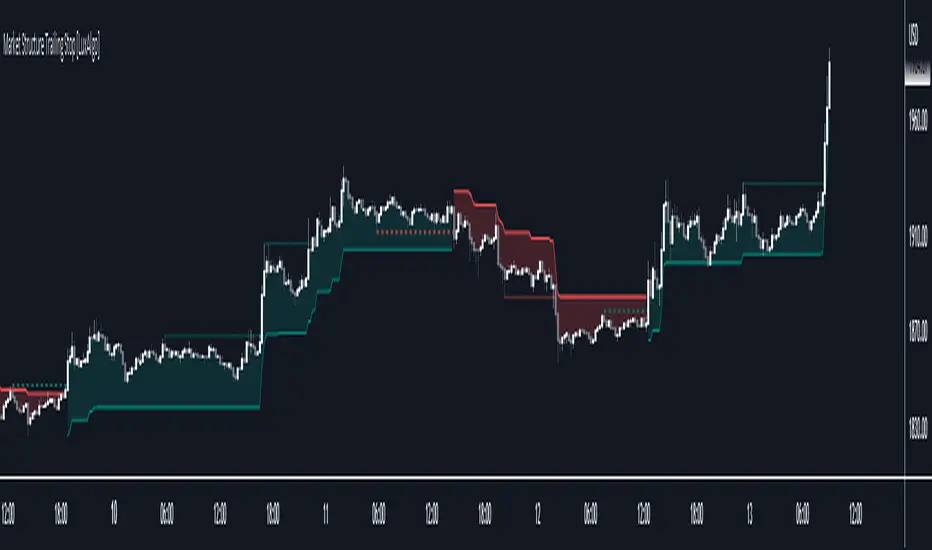
Market Structure Trailing Stop [LuxAlgo]This script returns trailing stops on the occurrence of market structure (CHoCH/BOS labeling). Trailing stops are adjusted based on trailing maximums/minimums with the option for users to be able to control how quickly a trailing stop can converge toward the price.
🔶 SETTINGS
Pivot Lookback: Pivot length used for the detection of swing points.
Increment Factor %: Controls how fast trailing stops converge toward the price, with lower values returning slower converging trailing stops.
Reset Stop On: Determines if trailing stops are reset on CHoCH structure or all (CHoCH + BOS).
Show Structure: Determines if market structure is displayed.
🔶 USAGE
Trailing stops allow traders to protect them against downside risk while also guaranteeing a potential profit in case the market goes in the expected direction of the trade.
Users making use of market structure as a primary entry condition can benefit from having trailing stops based on these to either provide an additional exit condition or to provide points of support/resistance with the price.
Trailing stops can avoid being hit more frequently by using a lower Increment Factor % setting.
Finally, users can reset the trailing stop when any market structure is detected (or only on CHoCHs). Allowing trailing stops to reset on the detection of any market structure allows the indicator to return trailing stops closer to the price. CHoCH labels are highlighted as dashed lines while BOS labels are highlighted as dotted lines.
🔶 DETAILS
When a new structure (or only CHoCH if specified by the user) is detected, trailing stops will initially be set based on the maximum/minimum made on the previous trend. This will also set the trailing maximum/minimum to the current price value.
If an uptrend is detected (most recent market structure is bullish) then the trailing stop will increase if the trailing maximum increase, the increment is calculated as:
trailing stop = trailing stop + Increment Factor % of (trailing maximum - previous trailing maximum)
If a downtrend is detected (most recent market structure is bearish) then the trailing stop will decrease if the trailing minimum decrease, the decrement is calculated as:
trailing stop = trailing stop + Increment Factor % of (trailing minimum - previous trailing minimum)
Three-Day Rolling PivotThe three-day rolling pivot is another pivot concept,
which may be used by intermediate positions, for several days or even weeks.
It can be utilized in many ways, such as to determine an entry point or trailing stop.
As the name suggests, this pivot is based on the last three days.
I learned this concept of the book "The logical Trader" by Mark Fisher.
Kudos go to him!
My version of the Three-Day Rolling Pivot uses actual data!
And all similar scripts I have found so far calculate future data and don't take into account the original data.
I hope this script will help some people to do some better decisions.
And I am pleased to get some advice to make this script even better!
Future data vs original data
Pine Script v5 Reference Manual:
Merge strategy for the requested data position... This merge strategy can lead to undesirable effect of getting data from "future" on calculation on history. This is unacceptable in backtesting strategies, but can be useful in indicators.
e2e4 on Stack Overflow said:
Pine v1-v2's security() function is using the lookahead parameter by default, which could be modified in v3-v5...
stackoverflow.com
I haven't found a script which put this into account jet.
I leave this option available for people that wanna more speculated data. But it's disabled by default.
Long/Short Example
You can enter Long when the market cross over the upper line (default color is green) and you should put your trailing stop 1-5 ticks below the lower line (default color is red).
The opposite when Shorting, then the market has to cross down the lower line and your trailing stop should be 1-5 ticks above the upper line.
How does this script work:
First it fetches the highest high of ...
yesterday,
the day before yesterday,
and the day before that.
After that the script looks for the highest high of all three.
Next it does the same for previous lowest low.
Last but not least, it fetches the closing price of the last day.
After that it adds all three prices together and divide them by three.
This result in a three day pivot price.
Then it adds the highest high and lowest low of the three last days and divide it by two.
This gives us the second number we need to calculate the differential.
The differential is the gap between the three day pivot price and the second number.
Sometimes the second number is bigger than the three day pivot price so I took that into account too. Other wise the colors plotted would be on the wrong site.
Finally, the script is rounding the numbers to the nearest minimum tick of that security.

Super 8 - 30M BTCWelcome to Super 8, the ultimate automatic trading script for Pine!
This bad boy is designed to go both long and short, and it's equipped with all the tools you need to maximize your profits. Whether you're looking to take profit, set a trailing stop, or protect yourself with a stop loss, Super 8 has you covered.
But that's not all! Super 8 is also loaded with 8 powerful indicators to help you make informed decisions. We've got the EMA, ADX, SAR, MACD, VOLUME, BOLLINGER BANDS, DONCHIAN, and ATR all working together to give you the best possible trading experience.
And if you want to take it to the next level, Super 8 also has a feature that lets you use stepped entries in normal mode or incremental 1,2,3,... to improve your average price. Plus, if you're using trailing stop, you can activate the Backtest precision to use lower timeframes.
But what's in a name? Super 8 is called that because it's just that... super! It's tailored specifically for the OKX:BTCUSDT.P pair, so you know you're getting the best possible results. it's highly adjustable and can be used with any other pair. So no matter what market you're trading in, Super 8 has got you covered.
So if you want to level up your trading game, give Super 8 a try. You won't be disappointed.
Certain Risks of Live Algorithmic Trading:
Backtesting Cannot Assure Actual Results.
The relevant market might fail or behave unexpectedly.
Your broker may experience failures in its infrastructure, fail to execute your orders in a correct or timely fashion or reject your orders.
The system you use for generating trading orders, communicating those orders to your broker, and receiving queries and trading results from your broker may fail.
Time lag at various point in live trading might cause unexpected behavior.
The systems of third parties in addition to those of the provider from which we obtain various services, your broker, and the applicable securities market may fail or malfunction.

ATR_RSI_Strategy v2 with no repaint [liwei666]🎲 Overview
🎯 this is a optimized version based on ATR_RSI_Strategy with no-repaint.
Sharpe ratio: 1.4, trade times: 116 ,
trade symbol: BINANCE:BTCUSDTPERP 15M
you can get same backtesting result with the correct settings.
🎲 Strategy Logic
🎯 the core logic is quite simple, use ATR and RSI and SMA
1. when price is in high volatility ( atr_value > atr_ma);
2. wait for a break signal (rsi_value > rsi_buy or rsi_value < rsi_sell);
3. entry Long or Short,use trailing stop-loss to max security and percent TP to keep profit.
🎲 Settings
🎯 there are 7 input properties in script, but I only finetune 4 of them ( bold field below ),
you may change other parameter to get better result by yourself.
atr_length: length to get atr value
atr_ma_length : length of smoothing atr value
atr_ma_norm_min : atr_ma normalized min value, filter high volatility ranges
atr_ma_norm_max : atr_ma normalized max value, filter high volatility ranges
rsi_length : length to get rsi value
rsi_entry: 50 +/- rsi_entry to get entry threshold
trailing_percent: trailing stop-loss percent
🎲 Usage
🎯 the commission set to 0.05% , part of exchange the commission is less than 0.05% in reality,
but I will still use 0.05% in my next script.
🎯 this script use 50% of equity to size positions follow general script position,
you can adjust the value to fix size or 100% of equity to compare result with other strategy,
but I still suggest you use 5-10% of equity for each strategy in reality.
🎯any questions please comment below. if there are any words violate House Rule, please tell me below and i will revise immediately
don't want be hiddened again 😂😂
Additionally, I plan to publish 20 profitable strategies in 2023;
let‘s witness it together!
Hope this strategy will be usefull for you :)
enjoy! 🚀🚀🚀

TrailingStopsLibrary "TrailingStops"
This library contains functions to output trailing stop lines.
f_marketStructureStop(_restartMode, _flipMode, _restartLowIn, _restartHighIn)
Parameters:
_restartMode - Defines how the stop lines persist. Allowed values are:
"Always On" - The stop lines are always present and they just reset when they're crossed.
"Flip" - The stop lines flip when they're crossed.
"Manual" - The stop lines turn off when they're crossed, and turn back on again when _restartLowIn or _restartHighIn are passed into the function as true.
_flipMode - Defines whether the stop lines are broken by wicks or closes. Allowed values are "Wick", and "Close".
_restartLowIn - If _restartMode is "Manual", passing this parameter as true restarts the Low stop line.
_restartHighIn - If _restartMode is "Manual", passing this parameter as true restarts the High stop line.
@returns - floats for the Low and High stop line.

Fast EMA above Slow EMA with MACD (by Coinrule)An exponential moving average ( EMA ) is a type of moving average (MA) that places a greater weight and significance on the most recent data points. The exponential moving average is also referred to as the exponentially weighted moving average . An exponentially weighted moving average reacts more significantly to recent price changes than a simple moving average simple moving average ( SMA ), which applies an equal weight to all observations in the period.
Moving average convergence divergence ( MACD ) is a trend-following momentum indicator that shows the relationship between two moving averages of a security’s price. The MACD is calculated by subtracting the 26-period exponential moving average ( EMA ) from the 12-period EMA .
The result of that calculation is the MACD line. A nine-day EMA of the MACD called the "signal line," is then plotted on top of the MACD line, which can function as a trigger for buy and sell signals. Traders may buy the coin when the MACD crosses above its signal line and sell—or short—the security when the MACD crosses below the signal line. Moving average convergence divergence ( MACD ) indicators can be interpreted in several ways, but the more common methods are crossovers, divergences, and rapid rises/falls.
The Strategy enters and closes the trade when the following conditions are met:
LONG
The MACD histogram turns bullish
EMA8 is greater than EMA26
EXIT
Price increases 3% trailing
Price decreases 1% trailing
This strategy is back-tested from 1 January 2022 to simulate how the strategy would work in a bear market and provides good returns.
Pairs that produce very strong results include AXSUSDT on the 5-minute timeframe. This short timeframe means that this strategy opens and closes trades regularly.
Additionally, the trailing stop loss and take profit conditions can also be changed to match your needs.
The strategy assumes each order is using 30% of the available coins to make the results more realistic and to simulate you only ran this strategy on 30% of your holdings. A trading fee of 0.1% is also taken into account and is aligned to the base fee applied on Binance.

Ichimoku Cloud with MACD and Trailing Stop Loss (by Coinrule)The Ichimoku Cloud is a collection of technical indicators that show support and resistance levels, as well as momentum and trend direction. It does this by taking multiple averages and plotting them on a chart. It also uses these figures to compute a “cloud” that attempts to forecast where the price may find support or resistance in the future.
The Ichimoku Cloud was developed by Goichi Hosoda, a Japanese journalist, and published in the late 1960s. It provides more data points than the standard candlestick chart. While it seems complicated at first glance, those familiar with how to read the charts often find it easy to understand with well-defined trading signals.
The Ichimoku Cloud is composed of five lines or calculations, two of which comprise a cloud where the difference between the two lines is shaded in.
The lines include a nine-period average, a 26-period average, an average of those two averages, a 52-period average, and a lagging closing price line.
The cloud is a key part of the indicator. When the price is below the cloud, the trend is down. When the price is above the cloud, the trend is up.
The above trend signals are strengthened if the cloud is moving in the same direction as the price. For example, during an uptrend, the top of the cloud is moving up, or during a downtrend, the bottom of the cloud is moving down.
The MACD is a trend following momentum indicator and provides identification of short-term trend direction. In this variation it utilises the 12-period as the fast and 26-period as the slow length EMAs, with signal smoothing set at 9.
This strategy combines the Ichimoku Cloud with the MACD indicator to better enter trades.
Long/Exit orders are placed when three basic signals are triggered.
Long Position:
Tenkan-Sen is above the Kijun-Sen
Chikou-Span is above the close of 26 bars ago
Close is above the Kumo Cloud
MACD line crosses over the signal line
Exit Position:
Price increases 3% trailing
Price decreases 3% trailing
The script is backtested from 1 June 2022 and provides good returns.
The strategy assumes each order is using 30% of the available coins to make the results more realistic and to simulate you only ran this strategy on 30% of your holdings. A trading fee of 0.1% is also taken into account and is aligned to the base fee applied on Binance.

Interactive SAR Stop-Loss [TANHEF]This indicator is "Interactive" which means some inputs can are manually added through the first click after adding the indicator to the chart (SAR Trailing Stop-loss start point).
Unlike the normal Parabolic SAR, this indicator allows for the modification of the start point of the Parabolic SAR’s first bar calculation. Normally, the Parabolic SAR automatically has a start point after the first bar of an asset’s historical price that will then switch between trailing above and below price respectively. It must be noted that due to how the first position of the Parabolic SAR is calculated, on occasion the Parabolic SAR will immediately flip on the next bar to the opposite side relative to price that it was just located. Modifying the setting “⭐Initial Interactive SAR Position Source”, then selecting either 'Clicked' or 'ATR' level as the vertical start position will prevent this. See images below for more explanation.
Why use a trailing stop-loss?
A trailing stop-loss provides an exit when price moves against you but also enables you to move the exit point further into profit when price is moving in the desired direction of a trade. The Parabolic SAR ( stop and reverse ) which is used to determine price direction as well as when price direction is changing, is very effective at functioning as a trailing stop loss.
Indicator Explanation
Initially when this indicator is added to the chart, you will be prompted to select where to begin the SAR Trailing Stop-loss.
For a long stop-loss, select below price.
For a short stop-loss, select above price.
After this indicator is placed, it can be modified via dragging or from within the settings by modifying the time and the price input. Or simply re-add the indicator to the chart. Another option is to have this Parabolic SAR begin directly on the price that was initially ‘Clicked’ or the ‘ATR’ level, which requires selecting the option in settings labeled “⭐Initial Interactive SAR Position Source”
The SAR Stop Loss plotted. Note that the calculation that occurs on this first bar of the ‘Interactive SAR’ is as if the prior bar was the oldest historical bar of the asset. Due to the SAR’s calculations, if the ‘Normal SAR’ were to also flip sides over to the position that has been manually set for the ‘Interactive SAR’, they won’t necessarily have the same result.
An optional fixed profit target can be added within the settings. This profit target will only actively be plotted when the SAR Trailing Stop-loss has not be hit yet or until the profit target has been hit.
Here shows that the profit target was hit, then later on the SAR Trailing Stop-loss was hit.
Note, trailing stop-loss will continue to be plotted until it has been hit regardless of the profit target being hit or not.
Here is an example of when the Parabolic SAR will immediately flip on the next bar to the opposite side relative to price that it was just first located. This is due to how the Parabolic SAR is calculated and will also occur with the traditional Parabolic SAR that is not interactively (manually) given a start location. To prevent this, either relocate this time in which this SAR beings or consider modifying the SAR’s (start, increment, max) settings specifically.
Here instead of using the SAR’s calculation for an initial bar, the ‘ATR’ was selected as the start point within the setting “⭐Initial Interactive SAR Position Source”.
Alerts
1. 'Check' alerts to use within indicator settings (trailing stop hit and/or profit target hit).
2. Select 'Create Alert'
3. Set the condition to 'Interactive SAR''
4. Select create.

FFT Strategy Bi-Directional Stop/Profit/Trailing + VMA + AroonThis strategy uses the Fast Fourier Transform inspired from the source code of @tbiktag for the Fast Fourier Transform & @lazybear for the VMA filter.
If you are not familiar with the Fast Fourier transform it is a variation of the Discrete Fourier Transform. Veritasium on youtube has a great video on it with a follow up recommendation from 3brown1blue. In short it will extract all the frequencies from a set of data. @tbiktag laid the groundwork for creating the indicator which will allow you to isolate only those signals which are the most relevant and remove the noise. I recommend having @tbiktag's FFT Transform indicator side by side with this to understand what my variation is doing by setting similar settings .
Using this idea, you can then optimize a strategy to the frequencies that are best. The main entry signal is when the FFT Signal crosses above or below the 0 line .
Included with this strategy is the ability to optionally bi-directionally set:
Stop Loss
Trailing Stop Loss
Take Profit
Trailing Take Profit
Entries are optionally further filtered by use of the VMA using the algorithm from LazyBear which allows you to adjust a variable moving average with 3 market trend detections. Green represents upwards momentum; Blue sideways trading and Red downwards momentum. The idea being to filter out buy or sell entries unless the market is moving in that direction, and this makes a big difference as you can see for yourself when you turn it off or on. Turning it off will change the color of the FFT signal to orange instead of the green, blue, red colors .
I have added 2 custom stop loss types as well for experimentation:
1. VMA Filter stop loss to exit the trade if the VMA detects a market trend direction change matching the rules you have set. I have set this to off by default, but it is there so you can see what affect it may have on other tickers. It can increase the profit factor but usually at a cost of net profit.
2. The Aroon Filter stop loss with different lengths for the short or long direction. For the Aroon strategy (which is a trend change detector) it is considered bullish if the upper line (green in my code) is above 70 and the lower line (red in my code) is below 30 and the opposite for the bearish case. With this in mind, I have set it to filter by default only the extreme ends (99 and 1) to increase profit factor and net profit but I encourage you to try different settings and see how it affects things. Turning this off yields much higher net profit but at the cost of the profit factor and drawdown . To disable this just uncheck the 'Use Aroon Filter Long' (or short) and it will also hide the aroon graphics and crosses on the plot.
I will be adding more features in an attempt to lower the drawdown on this strategy but I hope you enjoy what I have so far!

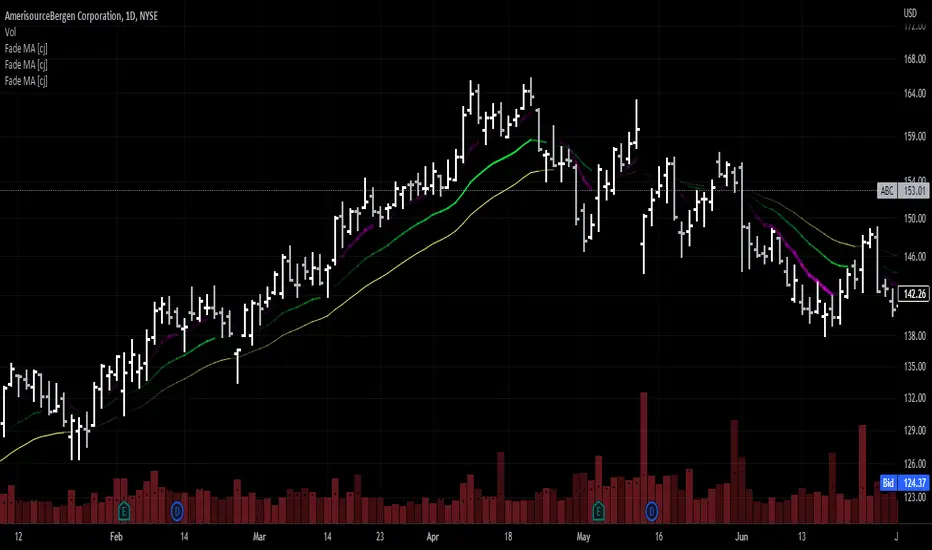
Moving Average - fade when crossed [cajole]This indicator simply provides a moving average (SMA, EMA, etc. can be selected) which hides itself when touched by the price.
Two potential uses:
Set the growth rate to be slow, to highlight only very rapid moves on a chart.
Use the default settings and change the averaging period until the MA line remains bright. This MA can then act as a good trailing stop for the specific security.
TradingView does not remember indicator settings for specific charts. Consider adding a text label to your chart after you identify the ideal trailing stop. Similar trailing-stop methods are recommended by Kristjan Qullamagie is identical to Jesse Stine's "magic line" concept .
Trailing Stop SnippetThis is an example snippet that should allow for adding a trailing stop and trailing stop activation to almost any script.
You can use it by setting a trailing stop alone. This will provide you standard trailing stop functionality allowing you to lock in profits and increase your stop-loss as the price moves in your direction.
You can also set the trailing stop activation to trigger the original trailing stop at a certain level. "Once price rises 5%, set a trailing stop at break even". This would be set as 5 and 5 in the settings.

[D] Dudu 95 Strategy Template ver.1.1.Hello Guys! Nice to meet you all!
This is my Second script after changing My Profile Name!
I updated my strategy template before - I added some filter conditions (EMA, ADX, DMI).
If there's something to update, I will update this script!
Thank you!
-----
I made this based on the open source strategies by jason5480, kevinmck100, myncrypto.
Thank you All!
### Filter
1. Can Choose whether to use filter.
2. Filters Based on ATR, EMA, ADX, and DMI are ready to use.
### StopLoss
1. Can Choose Stop Loss Type: Percent, ATR, Previous Low / High.
2. Can Chosse inputs of each Stop Loss Type.
### Take Profit
1. Can set Risk Reward Ratio for Take Profit.
- To simplify backtest, I erased all other options except RR Ratio.
- You can add Take Profit Logic by adding options in the code.
2. Can set Take Profit Quantity.
### Risk Manangement
1. Can choose whether to use Risk Manangement Logic.
- This controls the Quantity of the Entry.
- e.g. If you want to take 3% risk per trade and stop loss price is 6% below the long entry price,
then 50% of your equity will be used for trade.
2. Can choose How much risk you would take per trade.
### Plot
1. Added Labels to check the data of entry / exit positions.
2. Changed and Added color different from the original one. (green: #02732A, red: #D92332, yellow: #F2E313)

3 EMAs: Daily fixed and custom timeframe (cajole)Simply adds 3 exponential moving averages (EMAs) to the chart. Two are fixed to the daily scale (e.g., 200 and 50 days) and one adjusts to the chart's scale (e.g. 8 bars).
To use the 8-EMA as a trail stop, you can enable labels on the plot or on the price axis.
6 Multi-Timeframe Supertrend with Heikin Ashi as Source
This is a multiple multi-timeframe version of famous supertrernd only with Heikin Ashi as source. Atr which stands in the heart of supertrend is calculated based on heikin-ashi bars which omits a great deal of noises.
with 6 multiplication of the supertrend, its simply much easier to spot trend direction or use it as trailing stop with several levels available.
this is a great tool to assess and manage your risk and calculate your position volume if you use the heikin ashi supertrend as your stoploss.

AlphaTrend Strategy with Trailing SL %this is a modified version of AlphaTrend Strategy with added trailing Stop Loss
this is my first script that I have added to tradingview community
the trailing SL makes it very effective to lower the losses and can improve the overall return

R:R Trading System FrameworkFirst off, huge thanks to @fikira! He was able to adapt what I built to work much more efficiently, allowing for more strategies to be used simultaneously. Simply put, I could not have gotten to this point without you. Thanks for what you do for the TV community. Second, I am fairly new to pinescript writing, so I welcome criticism, thoughtful input and improvement suggestions. I would love to grow this concept into something even better, if possible. So please let me know if you have any ideas for improvement. However I do juggle a lot of different things outside of TV, so implementations may be delayed.
I have decided, at this time, not to add alerts. First, because I feel most people looking to adapt this framework can add their own pretty easily. Also, given how customized the framework is currently, while also attempting to account for all the possible ways in which people may want alerts to function after they customize it, it seems best to leave them out as it doesn't exactly fit the idea of a framework.
For best viewing, I recommend hovering over the script's name > ... > Visual order > Bring to front. Also I found hollow candles with mono-toned colors (like pictured) are more visually appealing for me personally. I HIGHLY RECOMMEND USING WITH BAR REPLAY TO BETTER UNDERSTAND THE FRAMEWORK'S FUNCTIONALITY.
▶️ WHAT THIS FRAMEWORK IS
- A huge collection of concepts and capabilities for those trying to better understand, learn, or teach pinescript.
- A system designed to showcase Risk:Reward concepts more holistically by providing all of the most popular components of retail trading to include backtesting, trade visual plotting, position tracking, market condition shifts, and useful info while positioned to help highlight changes in your risk:reward based decision-making processes.
- A system that can showcase individual strategies regardless of trade direction, allowing you to develop hedging strategies without having multiple indicators that do not correlate with each other.
- Designed around the idea that you trade less numbers of assets but manage your positions and risk based on multiple concurrently running strategies to manage your risk exposure and reward potential.
- An attempt to combine all the things you need to execute with an active trading management style.
- A framework that uses backtested results (in this case the number of averaged bars it takes to hit key levels) in real-time to inform your risk:reward decision-making while in-trade (in this case in your Trade Tracking Table using dynamic color to show how you might be early, on-time, or late compared to the average amount of backtested time it normally takes to hit that specific key level).
▶️ WHAT THIS FRAMEWORK IS NOT
- A complete trading product. DO NOT USE as-is. It is a FRAMEWORK for you to generate ideas of your own and fairly easily implement your own triggering conditions in the appropriate sections of the script.
▶️ USE CASES
- If you decide you like the Stop, Target, Trailing Stop, and Risk:Reward components as-is, then just understanding how to plug in your Entry and Bullish / Bearish conditions (Triangles) and adjust the input texts to match your custom naming will be all you need to make it your own!
- If you want to adapt certain components, then this system gives you a great starting point to adapt your different concepts and ideas from.
▶️ SYSTEM COMPONENTS
- Each of the system's components are described via tooltips both in the input menu and in the tables' cells.
- Each label on the chart displays the corresponding price at those triggered conditions on hover with tooltips.
- The Trailing Stop only becomes active once it is above the Entry Price for that trade, and brightens to show it is active. The STOP line (right of price) moves once it takes over for the Entry Stop representing the level of the Trailing Stop at that time for that trade.
- The Lines / Labels to the right of price will brighten once price is above for Longs or below for Shorts. The Trade Tracking Table cells will add ☑️ once price is above for Longs or below for Shorts.
- The brighter boxes on the chart show the trades that occurred based on your criteria and are color coded for all components of each trade type to ensure your references are consistent. (Defaults are TV built-in strategies)
- The lighter boxes on the chart show the highest and lowest price levels reached during those trades, to highlight areas where improvements can be made or additional considerations can be accounted for by either adjusting Entry triggers or Bullish / Bearish triggers.
- Default Green and Red Triangles (Bullish / Bearish) default to having the same triggering condition as the Entry it corresponds to. This is to highlight either a pyramiding concept, early exit, or you can change to account for other things occurring during your trades which could help you with Stop and Target management/considerations.
TradingView and many of its community members have done a lot for me, so this is my attempt to give back.

DEMA Supertrend Bands [Misu]█ Indicator based on DEMA (Double Exponential Moving Average) & Supertrend to show Bands .
DEMA attempts to remove the inherent lag associated with Moving Averages by placing more weight on recent values.
Supertrend aims to detect price trends, it's also used to set protective stops.
█ Usages:
Combining Dema to calculate Supertrend results in nice lower and upper bands.
This can be used to identify potential supports and resistances and set protective stops.
█ Parameters:
Length DEMA: Double Ema lenght used to calculate DEMA. Dema is used by Supertrend indicator.
Length Atr: Atr lenght used to calculate Atr. Atr is used by Supertrend indicator.
Band Mult: Used to calculate Supertrend Bands width.
█ Other Applications:
The mid band can be used to filter bad signals in the manner of a more classical Moving Average.
Parabolic SAR Oscillator [LuxAlgo]This indicator is a detrended price series using the Parabolic Stop and Reverse (SAR) trailing stop, resulting in a bounded oscillator in the range (-100, 100). The SAR output is also normalized to obtain a noiseless oscillator which can complement the detrended price.
Settings
Start: Initial value of the convergence factor used when a new trend is detected by the SAR
Increment: Increment value of the convergence factor
Maximum: Maximum value of the convergence factor
Usage
The price is detrended by subtracting the closing price to the SAR, this result is then normalized.
An up-trending market is indicated once the normalized SAR reaches -100, while a value of 100 indicates a down-trending market. One can anticipate trends when the normalized SAR crosses above/under 0.
The converging nature of the SAR trailing stop allows for the trader to obtain a very apparent leading oscillator.

Movable Stop + Trail + Alerthello everybody !
.....
this indicator helps you to get a better trading setting.
it's similar to the default draw tool from the trading view but the difference is you can add Trail stop and Alert .
.....
It also helps to free accounts to set more than 1 Alarm !!!
.....
Alert setting
just remember after you see set an alert if you change stop or entry, the alert will work with previous values/settings.
so you need to recreate an alert.
also don't change alert setting
.....
indicator setting
How is it works ?
...
settings
...
everything on :
you can see the information on the table
...
short sample :
everything on
...
simple short trade setting:
.....
my goal is to upgrade this indicator with your ideas.
not financial advice !
please , share your ideas with me to improve the indicator
I would like to see what you think about this indicator <3
also if you have any ideas to create an indicator or strategy you can make contact with me .
have a great day.

Pinbar trailing stop strategyThe strategy finds the nearest pinbar pattern and opens a position (long or short). You choose your take profit and stop loss multiplier.
Take Profit - X times the pinbar size from it's highest point.
Stop loss - X times the pinbar size from it's lowest point.
You can find more detailed screenshots and the source-code on my github page: samgozman/pinbar-strategy-tradingview

Rob Hoffman's 50/80/90/Price Trailing Stop LossA trailing stop loss method by Rob Hoffman.
Set your entry, TP, and SL.
Once price is 50% of its way to the TP, set your stop loss at the gray line.
Once price is 80% of its way to the TP, set your stop loss at the light gray line.
Once price is 90% of its way to the TP set your stop loss at the white line.

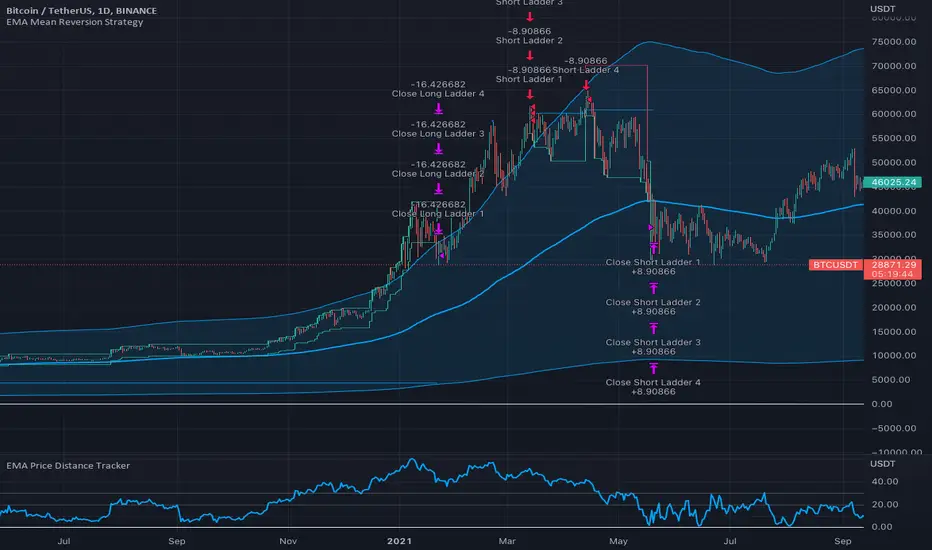
EMA Mean Reversion StrategyThis strategy is built on the simple idea that when the price gets far enough away from an EMA, it's bound to reverse. This strategy uses the percent distance the price is from the EMA to trigger ladder orders and sells when the price crosses a trailing stop. This strategy uses the EMA Price Distance Tracker indicator .