Lowess Channel + (RSI) [ChartPrime]The Lowess Channel + (RSI) indicator applies the LOWESS (Locally Weighted Scatterplot Smoothing) algorithm to filter price fluctuations and construct a dynamic channel. LOWESS is a non-parametric regression method that smooths noisy data by fitting weighted linear regressions at localized segments. This technique is widely used in statistical analysis to reveal trends while preserving data structure.
In this indicator, the LOWESS algorithm is used to create a central trend line and deviation-based bands. The midline changes color based on trend direction, and diamonds are plotted when a trend shift occurs. Additionally, an RSI gauge is positioned at the end of the channel to display the current RSI level in relation to the price bands.
lowess_smooth(src, length, bandwidth) =>
sum_weights = 0.0
sum_weighted_y = 0.0
sum_weighted_xy = 0.0
sum_weighted_x2 = 0.0
sum_weighted_x = 0.0
for i = 0 to length - 1
x = float(i)
weight = math.exp(-0.5 * (x / bandwidth) * (x / bandwidth))
y = nz(src , 0)
sum_weights := sum_weights + weight
sum_weighted_x := sum_weighted_x + weight * x
sum_weighted_y := sum_weighted_y + weight * y
sum_weighted_xy := sum_weighted_xy + weight * x * y
sum_weighted_x2 := sum_weighted_x2 + weight * x * x
mean_x = sum_weighted_x / sum_weights
mean_y = sum_weighted_y / sum_weights
beta = (sum_weighted_xy - mean_x * mean_y * sum_weights) / (sum_weighted_x2 - mean_x * mean_x * sum_weights)
alpha = mean_y - beta * mean_x
alpha + beta * float(length / 2) // Centered smoothing
⯁ KEY FEATURES
LOWESS Price Filtering – Smooths price fluctuations to reveal the underlying trend with minimal lag.
Dynamic Trend Coloring – The midline changes color based on trend direction (e.g., bullish or bearish).
Trend Shift Diamonds – Marks points where the midline color changes, indicating a possible trend shift.
Deviation-Based Bands – Expands above and below the midline using ATR-based multipliers for volatility tracking.
RSI Gauge Display – A vertical gauge at the right side of the chart shows the current RSI level relative to the price channel.
Fully Customizable – Users can adjust LOWESS length, band width, colors, and enable or disable the RSI gauge and adjust RSIlength.
⯁ HOW TO USE
Use the LOWESS midline as a trend filter —bullish when green, bearish when purple.
Watch for trend shift diamonds as potential entry or exit signals.
Utilize the price bands to gauge overbought and oversold zones based on volatility.
Monitor the RSI gauge to confirm trend strength—high RSI near upper bands suggests overbought conditions, while low RSI near lower bands indicates oversold conditions.
⯁ CONCLUSION
The Lowess Channel + (RSI) indicator offers a powerful way to analyze market trends by applying a statistically robust smoothing algorithm. Unlike traditional moving averages, LOWESS filtering provides a flexible, responsive trendline that adapts to price movements. The integrated RSI gauge enhances decision-making by displaying momentum conditions alongside trend dynamics. Whether used for trend-following or mean reversion strategies, this indicator provides traders with a well-rounded perspective on market behavior.
Trading!

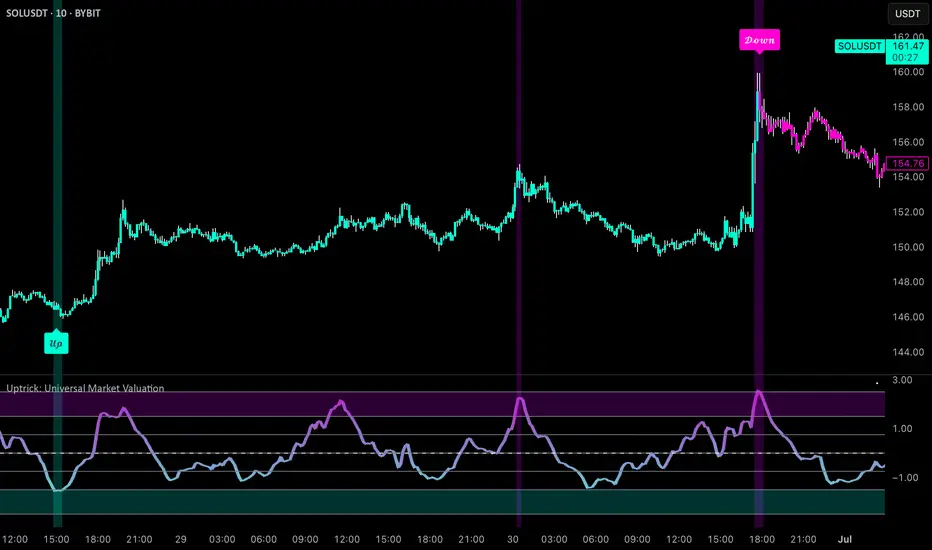
Uptrick: Universal Market ValuationIntroduction
Uptrick: Universal Market Valuation is created for traders who seek an analytical tool that brings together multiple signals in one place. Whether you focus on intraday scalping or long-term portfolio management, the indicator merges various well-known technical indicators to help gauge potential overvaluation, undervaluation, and trend direction. It is engineered to highlight different market dimensions, from immediate price momentum to extended cyclical trends.
Overview
The indicator categorizes market conditions into short-term, long-term, or a classic Z-Score style reading. Additionally, it draws on a unified trend line for directional bias. By fusing elements from traditionally separate indicators, the indicator aims to reduce “false positives” while giving a multidimensional view of price behavior. The indicator works best on cryptocurrency markets while remaining a universal valuation indicator that performs well across all timeframes. However, on lower timeframes, the Long-Term Combo input may be too long-term, so it's recommended to select the Short-Term Combo in the inputs for better adaptability.
Originality and Value
The Uptrick: Universal Market Valuation indicator is not just a simple combination of existing technical indicators—it introduces a multi-layered, adaptive valuation model that enhances signal clarity, reduces false positives, and provides traders with a more refined assessment of market conditions.
Rather than treating each included indicator as an independent signal, this script normalizes and synthesizes multiple indicators into a unified composite score, ensuring that short-term and long-term momentum, mean reversion, and trend strength are all dynamically weighted based on market behavior. It employs a proprietary weighting system that adjusts how each component contributes to the final valuation output. Instead of static threshold-based signals, the indicator integrates adaptive filtering mechanisms that account for volatility fluctuations, drawdowns, and momentum shifts, ensuring more reliable overbought/oversold readings.
Additionally, the script applies Z-Score-based deviation modeling, which refines price valuation by filtering out extreme readings that are statistically insignificant. This enhances the detection of true overvaluation and undervaluation points by comparing price behavior against a dynamically calculated standard deviation threshold rather than relying solely on traditional fixed oscillator bands. The MVRV-inspired ratio provides a unique valuation layer by incorporating historical fair-value estimations, offering deeper insight into market overextension.
The Universal Trend Line within the indicator is designed to smooth trend direction while maintaining responsiveness to market shifts. Unlike conventional trend indicators that may lag significantly or produce excessive false signals, this trend-following mechanism dynamically adjusts to changing price structures, helping traders confirm directional bias with reduced noise. This approach enables clearer trend recognition and assists in distinguishing between short-lived pullbacks and sustained market movements.
By merging momentum oscillators, trend strength indicators, volume-driven metrics, statistical deviation models, and long-term valuation principles into a single framework, this indicator eliminates the need for juggling multiple individual indicators, helping traders achieve a holistic market perspective while maintaining customization flexibility. The combination of real-time alerts, dynamic color-based valuation visualization, and customizable trend-following modes further enhances usability, making it a comprehensive tool for traders across different timeframes and asset classes.
Inputs and Features
• Calculation Window (Short-Term and Long-Term)
Defines how much historical data the indicator uses to evaluate the market. A smaller window makes the indicator more reactive, benefiting high-frequency traders. A larger window provides a steadier perspective for longer-term holders.
• Smoothing Period (Short-Term and Long-Term)
Controls how much the raw indicator outputs are “smoothed out.” Lower values reveal subtle intraday fluctuations, while higher values aim to present more robust, stable signals.
• Valuation Mechanism (Short Term Combo, Long Term Combo, Classic Z-Score)
Allows you to pick how the indicator evaluates overvaluation or undervaluation. Short Term Combo focuses on rapid oscillations, Long Term Combo assesses market health over more extended periods, and the Classic Z-Score approach highlights statistically unusual price levels.
Short-Term
• Determination Mechanism (Strict or Loose)
Governs the tolerance for labeling a market as overvalued or undervalued. Strict requires stronger confirmation; Loose begins labeling sooner, potentially catching moves earlier but risking more false signals.
Strict
Loose
• Select Color Scheme
Lets you choose the aesthetic style for your charts. Visual clarity can significantly improve reaction time, especially when multiple indicators are combined.
• Z-Score Coloring Mode (Heat or Slope)
Determines how the Classic Z-Score line and bars are colored. In Heat mode, the indicator intensifies color as readings move further from a baseline average. Slope mode changes color based on the direction of movement, making turning points more evident.
Classic Z-Score - Heat
Classic Z-Score - Slope
• Trend Following Mode (Short, Long, Extra Long, Filtered Long)
Offers various ways to compute and smooth the universal trend line. Short is more sensitive, Long and Extra Long are meant for extended time horizons, and Filtered Long applies an extra smoothing layer to help you see overarching trends rather than smaller fluctuations.
Short Term
Long Term
Extra Long Term
Filtered Long Term
• Table Display
An optional feature that places a concise summary table on the chart. It shows valuation states, trend direction, volatility condition, and other metrics, letting you observe multi-angle readings at a glance.
• Alerts
Multiple alert triggers can be set up—for crossing into overvaluation zones, for abrupt changes in trend, or for high volatility detection. Traders can stay informed without needing to watch charts continuously.
Why These Indicators Were Merged
• RSI (Relative Strength Index)
RSI is a cornerstone momentum oscillator that interprets speed and change of price movements. It has widespread recognition among traders for detecting potential overbought or oversold conditions. Including RSI provides a tried-and-tested layer of momentum insight.
• Stochastic Oscillator
This oscillator evaluates the closing price relative to its recent price range. Its responsiveness makes it valuable for pinpointing near-term price fluctuations. Where RSI offers a broader momentum picture, Stochastic adds fine-tuned detection of short-lived rallies or pullbacks.
• MFI (Money Flow Index)
MFI assesses buying and selling pressure by incorporating volume data. Many technical tools are purely price-based, but MFI’s volume component helps address questions of liquidity and actual money flow, offering a glimpse of how robust or weak a current move might be.
• CCI (Commodity Channel Index)
CCI shows how far price lies from its statistically “typical” trend. It can spot emerging trends or warn of overextension. Using CCI alongside RSI and Stochastic further refines the valuation layer by capturing price deviation from its underlying trajectory.
• ADX (Average Directional Index)
ADX reveals the strength of a trend but does not specify its direction. This is especially useful in combination with other oscillators that focus on bullish or bearish momentum. ADX can clarify whether a market is truly trending or just moving sideways, lending deeper context to the indicator's broader signals.
• MACD (Moving Average Convergence Divergence)
MACD is known for detecting momentum shifts via the interaction of two moving averages. Its inclusion ensures the indicator can capture transitional phases in market momentum. Where RSI and Stochastic concentrate on shorter-term changes, MACD has a slightly longer horizon for identifying robust directional changes.
• Momentum and ROC (Rate of Change)
Momentum and ROC specifically measure the velocity of price moves. By indicating how quickly (or slowly) price is changing compared to previous bars, they help confirm whether a trend is gathering steam, losing it, or is in a transitional stage.
• MVRV-Inspired Ratio
Drawn loosely from the concept of comparing market value to some underlying historical or fair-value metric, an MVRV-style ratio can help identify if an asset is trading above or below a considered norm. This additional viewpoint on valuation goes beyond simple price-based oscillations.
• Z-Score
Z-Score interprets how many standard deviations current prices deviate from a central mean. This statistical measure is often used to identify extreme conditions—either overly high or abnormally low. Z-Score helps highlight potential mean reversion setups by showing when price strays far from typical levels.
By merging these distinct viewpoints—momentum oscillators, trend strength gauges, volume flow, standard deviation extremes, and fundamental-style valuation measures—the indicator aims to create a well-rounded, carefully balanced final readout. Each component serves a specialized function, and together they can mitigate the weaknesses of a single metric acting alone.
Summary
This indicator simplifies multi-indicator analysis by fusing numerous popular technical signals into one tool. You can switch between short-term and long-term valuation perspectives or adopt a classic Z-Score approach for spotting price extremes. The universal trend line clarifies direction, while user-friendly color schemes, optional tabular summaries, and customizable alerts empower traders to maintain awareness without constantly monitoring every market tick.
Disclaimer
The indicator is made for educational and informational use only, with no claims of guaranteed profitability. Past data patterns, regardless of the indicators used, never ensure future results. Always maintain diligent risk management and consider the broader market context when making trading decisions. This indicator is not personal financial advice, and Uptrick disclaims responsibility for any trading outcomes arising from its use.
MTF Fractals [RunRox]🔽 MTF Fractals is a powerful indicator designed to visualize fractals from multiple timeframes directly on your chart, highlight liquidity sweeps at these fractal levels, and provide several additional features we’ll cover in detail below.
We created this indicator because we couldn’t find a suitable tool that met our specific needs on TradingView. Therefore, we decided to develop a valuable indicator for the entire TradingView community, combining simplicity and versatility.
⁉️ WHAT IS A FRACTALS?
In trading, a fractal is a technical analysis pattern composed of five consecutive candles, typically highlighting local market turning points. Specifically, a fractal high is formed when a candle’s high is higher than the highs of the two candles on either side, whereas a fractal low occurs when a candle’s low is lower than the lows of the two adjacent candles on both sides.
Traders use fractals as reference points for identifying significant support and resistance levels, potential reversal areas, and liquidity zones within price action analysis. Below is a screenshot illustrating clearly formed fractals on the chart.
📙 FRACTAL FORMATION
Here’s how fractals form depending on your chosen setting (3, 5, 7, or 9):
▶️ 3-bar fractal – forms when the central candle is higher (for highs) or lower (for lows) than one candle on each side.
▶️ 5-bar fractal – forms when the central candle is higher or lower than two candles on both sides.
▶️ 7-bar fractal – forms when the central candle is higher or lower compared to the three candles on each side.
▶️ 9-bar fractal – forms similarly but requires four candles on each side, making the fractal significantly more reliable and robust.
A higher number of bars ensures stronger fractal levels, highlighting more significant potential reversal points on the chart.
Now that we’ve covered the theory behind fractal formation, let’s explore the indicator’s functionality in more detail.
Below, I’ll explain each feature clearly and illustrate how you can effectively utilize this indicator in your trading.
🕐 MULTI-TIMEFRAME FRACTALS
We realized that displaying fractals only from the current timeframe isn’t always convenient, so we’ve introduced Multi-Timeframe Fractals into this indicator.
Now you can easily display fractals from higher timeframes directly on your current chart, providing you with broader market context and clearer trading signals.
Fractals from Current Timeframe – Fractals identified directly on the chart’s current timeframe.
Fractals from Higher Timeframes – Fractals sourced from higher timeframes and displayed clearly on your current chart for enhanced market perspective.
📈 FRACTAL LINES
Since fractals represent areas of high liquidity, we’ve added an option to extend fractal levels horizontally as Fractal Lines across your chart.
This feature allows you to clearly visualize critical liquidity areas from higher timeframes, directly on your current timeframe chart, as demonstrated in the screenshot below.
With this approach, you can clearly visualize significant fractal levels from higher timeframes directly on your current chart - for example, projecting fractals from the 1-hour (1H) timeframe onto a 3-minute (3m) chart. ✅ This helps you easily identify critical liquidity areas and potential reversal zones without the need to switch between multiple timeframes.
💰 LIQUDITY SWEEP (LIQUDITY GRAB)
To enhance your trading experience, we’ve introduced a feature that clearly identifies liquidity sweeps of fractal levels.
A Liquidity Sweep occurs when a candle closes beyond a fractal line, leaving a wick that pierces through it, signaling that liquidity has been collected at this level.
Below, you’ll find two examples illustrating this functionality:
▶️ Fractal lines from the current timeframe
▶️ Fractal lines projected from higher timeframes
The first example illustrates liquidity being swept from fractals on the current timeframe .
Here, the candle clearly closes beyond the fractal line, leaving a wick through it. This indicates a liquidity sweep at the fractal level, visually highlighting a potential reversal or continuation opportunity directly on your chart.
In the second example, fractals from the higher timeframe are projected onto your current chart.
When a candle on your current timeframe closes beyond an HTF fractal line - leaving a wick through this level - the indicator highlights it clearly. This signals to traders a potential reversal zone, indicating that liquidity has been swept, and price may reverse or significantly react from this area.
You can also enable the display of additional labels on the chart. These labels clearly mark liquidity sweeps at fractal levels, making it easier to visually identify potential reversal points directly on your chart.
⚙️ SETTINGS
Below are the indicator settings with detailed explanations for each parameter.
🔷 Bars in Fractal – Number of candles to the right and left required to form a fractal.
🔷 Fractal Timeframe – Select the timeframe from which you want to display fractals on the current chart.
🔷 Max Age, bars – Number of bars during which the fractal will remain active.
🔷 Show Fractal Line – Display or hide fractal lines.
🔷 Line Style – Choose the style of the line displayed on the chart.
🔷 Line Width – Thickness of the fractal line.
🔷 High Fractal – Style and color of bearish fractals.
🔷 Low Fractal – Style and color of bullish fractals.
🔷 Fractal Label Size – Select the size of fractal labels.
🔷 Show Sweep Labels – Option to display labels when a liquidity sweep occurs.
🔷 Label Color – Color and transparency of the area marked on the chart during a sweep.
🔷 Shade Sweep Area – Show or hide the sweep area shading.
🔷 Area Color – Color and transparency settings for the sweep area.
🔶 We’d love to hear your feedback and any suggestions for additional features you’d like to see in this indicator. We’ll be happy to consider your ideas and continue improving the indicator!

1H/3m Concept [RunRox]🕘 1H/3m Concept is a versatile trading methodology based on liquidity sweeps from fractal points identified on higher timeframes, followed by price reversals at these key moments.
Below, I will explain this concept in detail and provide clear examples demonstrating its practical application.
⁉️ WHAT IS A FRACTALS?
In trading, a fractal is a technical analysis pattern composed of five consecutive candles, typically highlighting local market turning points. Specifically, a fractal high is formed when a candle’s high is higher than the highs of the two candles on either side, whereas a fractal low occurs when a candle’s low is lower than the lows of the two adjacent candles on both sides.
Traders use fractals as reference points for identifying significant support and resistance levels, potential reversal areas, and liquidity zones within price action analysis. Below is a screenshot illustrating clearly formed fractals on the chart.
📌 ABOUT THE CONCEPT
The 1H/3m Concept involves marking Higher Timeframe (HTF) fractals directly onto a Lower Timeframe (LTF) chart. When a liquidity sweep occurs at an HTF fractal level, we remain on the same LTF chart (since all HTF fractals are already plotted on this lower timeframe) and wait for a clear Market Structure Shift (MSS) to identify our potential entry point.
Below is a schematic illustration clearly demonstrating how this concept works in practice.
Below is another 💡 real-chart example , showing liquidity in the form of a 1H fractal, swept by a rapid impulse move. Immediately afterward, a clear Market Structure Shift (MSS) occurs, signaling a potential entry point into the trade.
Another example is shown below, where we see our hourly fractal, from which price clearly reacts, providing an opportunity to search for an entry point.
As illustrated on the chart, the fractal levels from the higher timeframe are clearly displayed, but we’re working directly on the 5-minute chart. This allows us to remain on one timeframe without needing to switch back and forth between charts to spot such trading setups.
🔍 MTF FRACTALS
This concept can be applied across various HTF-LTF timeframe combinations. Although our examples illustrate 1H fractals used on a 5-minute chart, you can effectively utilize many other timeframe combinations, such as:
30m HTF fractals on 1m chart
1H HTF fractals on 3m chart
4H HTF fractals on 15m chart
1D HTF fractals on 1H chart
The key idea behind this concept is always the same: identify liquidity at fractal levels on the higher timeframe (HTF), then wait for a clear Market Structure Shift (MSS) on the lower timeframe (LTF) to enter trades.
⚙️ SETTINGS
🔷 Trade Direction – Select the preferred trading direction (Long, Short, or Both).
🔷 HTF – Choose the higher timeframe from which fractals will be displayed on the current chart.
🔷 HTF Period – Number of candles required on both sides of a fractal candle (before and after) to confirm fractal formation on the HTF.
🔷 Current TF Period – Sensitivity to the impulse that sweeps liquidity, used for identifying and forming the MSS line.
🔷 Show HTF – Enable or disable displaying HTF fractal lines on your chart. You can also customize line style and color.
🔷 Max Age (Bars) – Number of recent bars within which fractals from the selected HTF will be displayed.
🔷 Show Entry – Enable or disable displaying the MSS line on the chart.
🔷 Enable Alert – Activates TradingView alerts whenever the MSS line is crossed.
You can also enable 🔔 alerts, which notify you whenever price crosses the MSS line. This significantly simplifies the process of identifying these setups on your charts. Simply configure your preferred timeframes and wait for notifications when the MSS line is crossed.
🔶 We greatly appreciate your feedback and suggestions for improving the indicator!

Order Blocks-[B.Balaei]Order Blocks -
**Description:**
The Order Blocks - indicator is a powerful tool designed to identify and visualize Order Blocks on your chart. Order Blocks are key levels where significant buying or selling activity has occurred, often acting as support or resistance zones. This indicator supports multiple timeframes (MTF), allowing you to analyze Order Blocks from higher timeframes directly on your current chart.
**Key Features:**
1. **Multi-Timeframe Support**: Choose any timeframe (e.g., Daily, Weekly) to display Order Blocks from higher timeframes.
2. **Customizable Sensitivity**: Adjust the sensitivity to detect more or fewer Order Blocks based on market conditions.
3. **Bullish & Bearish Order Blocks**: Clearly distinguishes between bullish (green) and bearish (red) Order Blocks.
4. **Alerts**: Get notified when price enters a Bullish or Bearish Order Block zone.
5. **Customizable Colors**: Personalize the appearance of Order Blocks to match your chart style.
**How to Use:**
1. Add the indicator to your chart.
2. Select your desired timeframe from the "Multi-Timeframe" settings.
3. Adjust the sensitivity and colors as needed.
4. Watch for Order Blocks to form and use them as potential support/resistance levels.
**Ideal For:**
- Swing traders and position traders looking for key levels.
- Traders who use multi-timeframe analysis.
- Anyone interested in understanding market structure through Order Blocks.
**Note:**
This indicator is for educational and informational purposes only. Always conduct your own analysis before making trading decisions.
**Enjoy trading with Order Blocks - !**

Ivan Gomes StrategyIG Signals+ - Ivan Gomes Strategy
This script is designed for scalping and binary options trading, generating buy and sell signals at the beginning of each candle. Although it is mainly optimized for short-term operations, it can also be used for medium and long-term strategies with appropriate adjustments.
How It Works
• The indicator provides buy or sell signals at the start of the candle, based on a statistical probability of candle patterns, depending on the timeframe.
• It is essential to enter the trade immediately after the signal appears and exit at the end of the same candle.
• If the first operation results in a loss (Loss), the script will send another trade signal at the start of the next candle. However, if the first trade results in a win (Gain), no new signal will be generated.
• The signals follow cycles of 3 candles, regardless of the timeframe. However, if a Doji candle appears, the cycle is interrupted, and no signals will be generated until the next valid cycle starts.
• The strategy consists of up to two trades per cycle: if the first trade is not successful, the second trade serves as an additional attempt to recover.
Key Points to Consider
1. Avoid trading in sideways markets – If price levels do not fluctuate significantly, the accuracy of the signals may decrease.
2. Trade in the direction of the trend – Using Ichimoku clouds or other trend indicators can help confirm trend direction and improve signal reliability. If the market is in an uptrend (bullish trend) and the indicator generates a sell signal, the most prudent decision would be to wait for a buy signal that aligns with the main trend. The same applies to downtrends, where buy signals may be riskier.
These decisions should be based on chart reading and supported by other technical analysis tools, such as support and resistance levels, which indicate zones where price might face obstacles or reverse direction. Additionally, Fibonacci retracement levels can help identify possible pullback points within a trend. Moving averages are also useful for visualizing the general market direction and confirming whether an indicator signal aligns with the overall price structure. Combining these tools can increase trade accuracy and prevent unnecessary trades against the main trend, reducing risks.
3. Works based on probability statistics – The algorithm analyzes candle formations and their statistical probabilities depending on the timeframe to optimize trade entries.
4. Best suited for scalping and binary options – This strategy performs best in 1-minute and 5-minute timeframes, allowing for multiple trades throughout the day.
Technical Details
• The script detects the candle cycle and assigns an index to each candle to identify patterns and possible reversals.
• It recognizes reference candles, stores their colors, and compares them with subsequent candles to determine if a signal should be triggered.
• Doji candle rules are implemented to avoid false signals in indecisive market conditions. When a Doji appears, the script does not generate signals for that cycle.
• The indicator displays visual alerts and notifications, ensuring fast execution of trades.
Disclaimer
The IG Signals+ indicator was created to assist traders who struggle to analyze the market by providing objective trade signals. However, no strategy is foolproof, and this script does not guarantee profits.
Trading involves significant financial risk, and users should test it in a demo account before trading with real money. Proper risk management is crucial for long-term success.

Volume Delta & Order Block Suite [QuantAlgo]Upgrade your volume analysis and order flow trading with Volume Delta & Order Block Suite by QuantAlgo, a sophisticated technical indicator that leverages advanced volume delta calculations, along with dynamic order block detection to provide deep insights into market participant behavior. By calculating the distribution of volume between buyers and sellers and tracking pivotal volume zones, the indicator helps traders understand the underlying forces driving price movements. It is particularly valuable for those looking to identify high-probability trading opportunities based on volume imbalances and key price levels where significant activity has occurred.
🟢 Technical Foundation
The Volume Delta & Order Block Suite utilizes sophisticated volume analysis techniques to estimate buying and selling pressure within each price candle. The core volume delta calculation employs a formula that estimates buy volume as: Volume × (Close - Low) ÷ (High - Low) , with sell volume calculated as the remainder of total volume. This approach assumes that when price closes near the high of a candle, most volume represents buying pressure, and when price closes near the low, most volume represents selling pressure.
For order block detection, the indicator implements a multi-step process involving volume pivot identification and price state tracking. It first detects significant volume pivot points using the ta.pivothigh function with a user-defined pivot period. It then tracks the market's order state based on whether the high exceeds the highest high or the low falls below the lowest low. When a volume pivot occurs, the indicator creates order blocks based on price levels at that pivot point. These blocks are continuously monitored for invalidation based on subsequent price action.
🟢 Key Features & Signals
1. Volume Delta Representation on Candles
The Volume Delta visualization on candles shows the buy/sell distribution directly on price bars, creating an immediate visual representation of volume pressure.
When buyers are dominant, candles are colored with the bullish theme color (default: green/teal).
Similarly, when sellers are dominant, candles are colored with the bearish theme color (default: red).
This visualization provides immediate insights into underlying volume pressure without requiring separate indicators, helping traders quickly identify which side of the market is in control.
2. Buy/Sell Pressure Information Table
The Volume Analysis Table provides a comprehensive breakdown of volume metrics across multiple timeframes, helping traders identify shifts in market behavior.
The table is organized into four timeframe columns:
Current Volume
1 Bar Before
1 Day Before
1 Week Before
For each timeframe, the table displays:
Buy volume: The estimated buying volume based on price action
Sell volume: The estimated selling volume based on price action
Total volume: The sum of buy and sell volume
Delta: The difference between buy and sell volume (positive when buyers are dominant, negative when sellers are dominant)
Additionally, the table shows both absolute values and percentage distributions, with trend indicators (Up, Down, or Neutral) at the bottom row of each timeframe column.
This multi-timeframe approach helps traders:
→ Identify volume imbalances between buyers and sellers
→ Track changes in volume delta across different periods
→ Compare current conditions with historical patterns
→ Detect potential reversals by watching for shifts in delta direction
The delta values are particularly useful as they provide a clear indication of market dominance – positive delta (Up) when buyers are dominant, and negative delta (Down) when sellers are dominant.
3. Order Blocks and Their Confluence
Order blocks represent significant price zones where volume pivots occur, potentially indicating areas of significant market participant activity.
The indicator identifies two types of order blocks:
Bullish Order Blocks (support): Highlighted with a green/teal color, these represent potential support areas where price might bounce when revisited
Bearish Order Blocks (resistance): Highlighted with a red color, these represent potential resistance areas where price might reverse when revisited
Each order block is visualized as a colored rectangle with a dashed line showing the average price within the block. The blocks are extended to the right until they are invalidated.
Order blocks can serve as key reference points for trading decisions, for example:
Support/resistance identification
Stop loss placement (beyond the opposite edge of the block)
Potential reversal zones
Target areas for profit-taking
When price approaches an order block, traders should look for confluence with the volume delta on candles and the information in the volume analysis table. Strong setups occur when all three components align – for example, when price approaches a bearish order block with increasing sell volume shown on the candles and in the volume table.
🟢 Practical Usage Tips
→ Volume Analysis and Interpretation: The indicator visualizes the buy/sell volume ratio directly on price candles using color intensity, allowing traders to immediately identify which side (buyers or sellers) is dominant. This information helps in assessing the strength behind price movements and potential continuation or reversal signals.
→ Order Block Trading Strategies: The indicator highlights significant price zones where volume pivots occur, marking these as potential support (bullish order blocks) or resistance (bearish order blocks). Traders can use these levels to identify potential reversal points, stop placement, and profit targets.
→ Multi-timeframe Volume Comparison: Through its comprehensive volume analysis table, the indicator enables traders to compare volume patterns across current, recent, daily, and weekly timeframes. This helps in identifying shifts in market behavior and confirming the strength of ongoing trends.
🟢 Pro Tips
Adjust Pivot Period based on your timeframe:
→ Lower values (3-5) for more frequent order blocks
→ Higher values (7-10) for stronger, less frequent order blocks
Fine-tune Mitigation Method based on your trading style:
→ "Wick" for more conservative invalidation
→ "Close" for more lenient order block survival
Look for confluence between components:
→ Strong volume delta in the expected direction when price touches an order block
→ Corresponding patterns in the volume analysis table
→ Overall market context aligning with the expected direction
Use for multiple trading approaches:
→ Support/resistance trading at order blocks
→ Trend confirmation with volume delta
→ Reversal detection when volume delta changes direction
→ Stop loss placement using order block boundaries
Combine with:
→ Trend analysis using trend-following indicators for trade confirmation
→ Multiple timeframe analysis for strategic context

Multi-Timeframe VWAP Master ProThe Multi-Timeframe VWAP Suite is a comprehensive and highly customizable indicator designed for traders who rely on Volume-Weighted Average Price (VWAP) across multiple timeframes and periods. This tool provides a complete suite of VWAP calculations, including daily, weekly, monthly, quarterly, yearly, and custom VWAPs, allowing traders to analyze price action and volume trends with precision. Whether you're a day trader, swing trader, or long-term investor, this indicator offers unparalleled flexibility and depth for your trading strategy.
Multi-Timeframe VWAPs:
Daily, Weekly, Monthly, Quarterly, and Yearly VWAPs: Track VWAP across various timeframes to identify key support and resistance levels.
Customizable Timeframes: Use the SMA timeframe input to adjust the period for moving averages and other calculations.
Previous Period VWAPs:
Previous Daily, Weekly, Monthly, and Quarterly VWAPs: Analyze historical VWAP levels to understand past price behavior and identify potential reversal zones.
Previous Year Quarterly VWAPs: Compare current price action to VWAP levels from specific quarters of the previous year.
Custom VWAPs:
Custom Start Date and Timeframe: Define your own VWAP periods by specifying a start date and timeframe, allowing for tailored analysis.
Dynamic Custom VWAP Calculation: Automatically calculates VWAP based on your custom inputs, ensuring flexibility for unique trading strategies.
Seasonal and Yearly VWAPs:
April, July, and October VWAPs: Analyze seasonal trends by tracking VWAP levels for specific months.
Yearly VWAP: Get a broader perspective on long-term price trends with the yearly VWAP.
SMA Integration:
SMA Overlay: Combine VWAP analysis with a Simple Moving Average (SMA) for additional confirmation of trends and reversals.
Customizable SMA Length and Timeframe: Adjust the SMA settings to match your trading style and preferences.
User-Friendly Customization:
Toggle Visibility and Labels: Easily enable or disable the display of specific VWAPs and their labels to keep your chart clean and focused.
Color Customization: Each VWAP line and label is color-coded for easy identification and can be customized to suit your preferences.
Dynamic Labeling:
Automatic Labels: Labels are dynamically placed on the last bar, providing clear and concise information about each VWAP level.
Customizable Label Text: Labels include detailed information, such as the timeframe or custom period, for quick reference.
Flexible Timeframe Detection:
Automatic Timeframe Detection: The indicator automatically detects new days, weeks, months, and quarters, ensuring accurate VWAP calculations.
Support for Intraday and Higher Timeframes: Works seamlessly on all chart timeframes, from 1-minute to monthly charts.
Previous Year Quarterly VWAPs:
Q1, Q2, Q3, Q4 VWAPs: Compare current price action to VWAP levels from specific quarters of the previous year.
User-Selectable Year: Choose the year for which you want to calculate previous quarterly VWAPs.
Persistent Monthly VWAPs:
Option to Persist Monthly VWAPs Year-Round: Keep monthly VWAP levels visible even after the month ends for ongoing analysis.
Comprehensive Analysis: Combines multiple VWAP timeframes and periods into a single tool, eliminating the need for multiple indicators.
Customizable and Flexible: Tailor the indicator to your specific trading strategy with customizable timeframes, periods, and settings.
Enhanced Decision-Making: Gain deeper insights into price action and volume trends across different timeframes, helping you make more informed trading decisions.
Clean and Organized Charts: Toggle visibility and labels to keep your chart clutter-free while still accessing all the information you need.
Ideal For:
Day Traders: Use daily and intraday VWAPs to identify intraday support and resistance levels.
Swing Traders: Analyze weekly and monthly VWAPs to spot medium-term trends and reversals.
Long-Term Investors: Leverage quarterly and yearly VWAPs to understand long-term price behavior and key levels.
Seasonal Traders: Track April, July, and October VWAPs to capitalize on seasonal trends.
The Multi-Timeframe VWAP Suite is a powerful and versatile tool for traders of all styles and timeframes. With its comprehensive suite of VWAP calculations, customizable settings, and user-friendly design, it provides everything you need to analyze price action and volume trends with precision and confidence. Whether you're looking to fine-tune your intraday strategy or gain a broader perspective on long-term trends, this indicator has you covered.

Window Seasonality IndicatorThis is a time window seasonal returns indicator. That is, it will provide the mean returns for a given time window based on a given number of lookbacks set by the user. The script finds matching time windows, e.g., 1st week of March going back 5 years or 9:00-10:00 window of every day going 50 days, and then calculates an average return for that window close price with respect to the close price in the immediately preceding time window, e.g. last week of February or 8:00-9:00 close price, respectively.
There are 4 input options:
1) Historical Periods to Average: Set the number of matching historical windows with which to calculate an average price. The max is 730 lookback windows. Note: for monthly or weekly windows, setting too large a number will cause the script to error out.
2) Use Open Price: calculates the seasonal returns using the open price rather than close price.
3) Show Bands: select from 1 Gaussian standard deviation or a nonparamateric ranked confidence interval. As a rough heuristic, the Gaussian band requires at least 30 lookback periods, and the ranked confidence interval requires 50 or more.
4) Upper Percentile: set the upper cutoff for ranked confidence interval.
5) Lower Percentile: set the lower cutoff for ranked confidence interval.
Please be aware, this indicator does not use rigorous statistical methodology and does not imply predictive power. You'll notice the range bands are very wide. Do not trade solely based on this indicator! Certain time windows, such as weekly and monthly, will make more sense applied to commodities, where annual cycles play a role in its supply and demand dynamics. Hourly windows are more useful in looking at equities markets. I like to look at equities with 1-hr windows to see if there is some pattern to overnight behavior or for market open and close.

Trading ChecklistTrading Checklist Indicator - Your Trading Plan Companion
A clean and efficient visual checklist to maintain trading discipline and consistency. This indicator helps traders follow their trading plan systematically by providing an easy-to-use checklist of key confirmation points.
Features:
- Visual checklist with clear green/red status indicators
- Clean, non-intrusive interface
- Real-time status updates
- Easy toggle controls for each item
Key Checkpoints:
1. HTF Structure Analysis
2. Order Flow Confirmation
3. SD/OB/FVG (HTF POI) Identification
4. Liquidity Grab Verification
5. Reversal Alignment Check
Final Confirmations:
- Trade Validity Check
- POI & Stop Loss Safety
- Set and Forget Status
How to Use:
1. Add the indicator to your chart
2. Use the Settings panel to toggle each condition
3. Green dots indicate confirmed conditions
4. Red dots show pending confirmations
5. Verify all conditions before executing trades
Note: This indicator helps maintain trading discipline but should be used alongside proper technical and fundamental analysis.
Tags: #TradingChecklist #RiskManagement #TradingPlan #Trading #Technical #Strategy #Discipline

Ultimate Volatility Scanner by NHBprod - Requested by Client!Hey Everyone!
I created another script to add to my growing library of strategies and indicators that I use for automated crypto and stock trading! This strategy is for BITCOIN but can be used on any stock or crypto. This was requested by a client so I thought I should create it and hopefully build off of it and build variants!
This script gets and compares the 14-day volatility using the ATR percentage for a list of cryptocurrencies and stocks. Cryptocurrencies are preloaded into the script, and the script will show you the TOP 5 coins in terms of volatility, and then compares it to the Bitcoin volatility as a reference. It updates these values once per day using daily timeframe data from TradingView. The coins are then sorted in descending order by their volatility.
If you don't want to use the preloaded set of coins, you have the option of inputting your own coins AND/OR stocks!
Let me know your thoughts.

RVMM IndicatorRVMM Indicator
RVMM Indicator combines four indicators: RSI, VWAP, MFI, and Momentum to provide comprehensive technical analysis. This indicator helps traders identify potential market conditions based on the interaction of these indicators.
Components of the RVMM Indicator
1. RSI (Relative Strength Index)
RSI is a momentum indicator that measures the speed and change of price movements. RSI oscillates between 0 and 100 and is used to identify overbought and oversold conditions in the market.
Buy Level: Set at 30. When RSI falls below 30, the market is considered oversold, which may suggest a potential upward trend reversal.
Sell Level: Set at 70. When RSI rises above 70, the market is considered overbought, which may suggest a potential downward trend reversal.
2. VWAP (Volume Weighted Average Price)
VWAP is an indicator that combines price and volume to calculate the average price weighted by volume. VWAP is used to identify support and resistance areas and assess the strength of price movements.
Interpretation: If the price is above the VWAP line, the market is likely in an uptrend. If the price is below the VWAP line, the market is in a downtrend.
3. MFI (Money Flow Index)
MFI is a momentum indicator that considers both price and volume. MFI oscillates between 0 and 100 and is used to identify overbought and oversold conditions in the market.
Oversold Level: Set at 20. When MFI falls below 20, the market is considered oversold.
Overbought Level: Set at 80. When MFI rises above 80, the market is considered overbought.
4. Momentum
Momentum is an indicator that measures the speed of price changes. This indicator is used to identify the strength of a trend.
Interpretation: High momentum values indicate a strong uptrend, while low momentum values indicate a strong downtrend.
How to Use the RVMM Indicator
Interpreting Market Conditions:
RSI : Check RSI values below 30 to identify oversold conditions, and above 70 to identify overbought conditions.
VWAP : Observe whether the price is above or below the VWAP line to determine if the market is in an uptrend or downtrend.
MFI : Check if MFI is below 20 to identify oversold conditions, and above 80 to identify overbought conditions.
Momentum : Analyze momentum values to gauge the strength of the current trend.
Confirming Market Conditions:
Use VWAP, MFI, and Momentum to confirm market conditions identified by RSI.
If the price is above the VWAP line, and MFI and Momentum indicate the strength of the uptrend, the market may be in a bullish phase.
If the price is below the VWAP line, and MFI and Momentum indicate the strength of the downtrend, the market may be in a bearish phase.
Risk Management:
Set stop-loss and take-profit levels based on technical analysis and your trading preferences.
Monitor the market and adjust stop-loss and take-profit levels as market conditions change.
Example of Application
Here is an example of how to use the RVMM Indicator in practice:
Bullish Phase: When the price is above the VWAP line, RSI is below 30, and MFI and Momentum indicate the strength of the uptrend, the market is likely in a bullish phase.
Bearish Phase: When the price is below the VWAP line, RSI is above 70, and MFI and Momentum indicate the strength of the downtrend, the market is likely in a bearish phase.

Dynamic Weighted Price Flow [QuantAlgo]Experience a brand new way of analyzing price movement with Dynamic Weighted Price Flow , an advanced technical tool that utilizes the uniqueness of weighted price and dynamic momentum analysis to evaluate trends and deliver high-probability signals. Whether you're a long-term investor seeking major trend confirmation or an active trader looking for precise entries and exits, this indicator's sophisticated and innovative approach to price flow analysis offers invaluable market insights you can only find at QuantAlgo !
🟢 Core Architecture
The Dynamic Weighted Price Flow's foundation rests on its innovative weighted price calculation and momentum-based trend scoring system. By implementing a unique price weighting algorithm alongside Hull Moving Average smoothing, each market move is evaluated within a dynamic context while maintaining exceptional responsiveness to price action. This refined approach helps identify genuine trend transitions while filtering out market noise across multiple timeframes and instruments.
🟢 Technical Foundation
Three key components of this indicator are:
Weighted Price Analysis: Utilizes a sophisticated weighting system that prioritizes recent price action
Momentum Range Processing: A comprehensive scoring system that evaluates price momentum across multiple periods
Dynamic Trend State Management: A normalized system that tracks and validates trend transitions
🟢 Practical Usage Tips
Here's how to maximize your use of the Dynamic Weighted Price Flow :
1/ Setup:
Add the indicator to your favorites ⭐️
Start with the default baseline period for balanced analysis
Use the recommended momentum range for optimal signal generation
Keep signal markers enabled for clear trend transitions
Customize accent colors to match your preferences
Enable dynamic price bars for complete visual feedback
2/ Reading Signals:
Monitor for triangle markers indicating trend transitions
Watch the main trend line color for direction confirmation
Observe the gradient fills for trend strength visualization
Use the built-in alert system to catch potential setups
🟢 Pro Tips
Adjust Baseline Period based on your trading style:
→ Lower values (1-5) for more responsive signals
→ Higher values (5-10) for more stable trend identification
Fine-tune Momentum Range based on market conditions:
→ Lower values (20-35) for shorter-term signals
→ Higher values (35-50) for longer-term trend following
Optimize Visual Settings for your strategy:
→ Enable signal markers for clear entry/exit points
→ Use dynamic price bars for enhanced trend visualization
Combine with:
→ Volume indicators for trade confirmation
→ Support/resistance levels for entry refinement
→ Multiple timeframe analysis for strategic context

Altcoins Screener [SwissAlgo]Introduction: The Altcoins Screener at a Glance
The Altcoins Screener is a cryptocurrency analysis tool designed to provide an overview of potential trading opportunities across multiple crypto coins/tokens and categories. By combining technical analysis, price action assessment, and social metrics (via LunarCrush data), it presents market information and trading signals for a broad range of altcoins (approx. 300 USDT.P pairs of 9 crypto categories).
The screener is designed to consolidate market information onto a single chart , aiming to streamline the analysis of market conditions. It provides a consolidated market overview, which can simplify the assessment of market conditions, compared to monitoring individual charts with several layered indicators.
Key Features:
🔹 Multi-category analysis covering 300 crypto pairs of 9 categories on a single chart (Layer 1 & Top Coins, Layer2 & Scaling, Defi & Landing, Gaming & Metaverse, AI & Data, Exchanges & Trading, NFT & Social, Memes & Community, Other, User's Custom Portfolio).
🔹 Technical analysis with trade signals (Long/Short) based on an aggregated view of technical and social data points
🔹 Social sentiment integration through LunarCrush metrics (GalaxyScore, AltRank, Social Sentiment)
🔹 Real-time market scanning provides automated alerts when market conditions for specified coins/tokens potentially change.
🔹 Custom watchlist support for personalized monitoring (users can define a custom category containing a set of specific cryptocurrencies, i.e. own portfolio).
The screener presents data in a table format, using color-coded indicators to aid visual analysis. Detailed technical information is also provided. The assessments/trade signals provided by this indicator should be considered as one input among many when forming your trading strategy.
--------------------------------------
What It Does
The Altcoins Screener is a cryptocurrency analysis tool that offers:
Data Display and Analysis (Technical/Social):
🔹 Technical Metrics
* Technical Raw Data : Displays raw values for a range of technical indicators, including RSI, Stochastic RSI, DMI/ADX, RVI, ATR, OBV, and Hull Moving Averages (including their recent trends and potential significance).
Detailed view of key technical indicators, for further analysis and evaluation:
* Technical Analysis (Summary) : Provides a summarized interpretation of technical conditions based on aggregated parameters:
* Price Action
* Trend
* Momentum
* Volatility
* Volume
Summarized view of confluences for potential long/short bias:
🔹 Social Metrics (LunarCrush) : Presents data from LunarCrush®, including Galaxy Score®, AltRank®, and Social Sentiment® (including their recent trends and potential significance).
Lunarcrush data for the top 10 coins for each crypto category:
🔹 PVSRA (Price Volume & Market Makers Activity) Candles : Shows special candles highlighting potential market maker activity and volume anomalies, helping identify possible manipulation zones (including imbalance zones, i.e. price areas that market makers may revisit)
--------------------------------------
Key Features:
Automated trade signals (Long/Short) are generated based on algorithmic calculations and signal confidence levels across technical and social data points. These signals are intended to be used as one component of a broader trading strategy.
Custom sensitivity settings allow users to adjust the analysis timeframe (options: 1D, 2D, or 1W). Higher timeframes may provide a broader perspective, while the 2D setting is the default configuration.
Multi-category analysis covering a selection of approximately 300 crypto pairs across 9 predefined crypto categories.
Custom symbol selection: Users can define a custom list of up to 10 symbols for focused monitoring.
Automated Alerts to track potential trend changes across crypto categories (Long to Short to Neutral, or vice versa)
Visual Interface:
Organized table display with color-coded indicators to aid interpretation.
Clear and efficient format for scanning market information.
--------------------------------------
Target Audience
🔹 The screener is designed for cryptocurrency traders who:
Need to efficiently monitor multiple USDT perpetual futures markets
Use technical analysis in their trading decisions
Want to track sector-wide movements across crypto categories
🔹 Suitable for different trading styles:
Scalpers requiring quick market assessment
Swing traders analyzing multi-day trends
Position traders monitoring longer-term setups
The color-coded interface makes it accessible for intermediate traders while providing detailed metrics for advanced users. A basic understanding of technical analysis and crypto trading is recommended.
--------------------------------------
How It Works
The Altcoins Screener evaluates cryptocurrencies through a multi-layered analysis:
🔹 Core Analysis Components
Each parameter combines multiple indicators for comprehensive evaluation:
Price Action
EMA crossovers and momentum
Support/resistance zones
Candlestick patterns
Trend
Hull Moving Average system
DMI/ADX trend strength
Multi-timeframe confirmation
Momentum
RSI/Stochastic RSI readings
MACD convergence/divergence
Oscillator confirmations
Volatility
RVI/ATR measurements
Bollinger Bands behavior
Historical volatility trends
Volume
OBV trend analysis
Volume/price correlations
Volume profile assessment
🔹 Signal Generation Process
1. Real-time data collection across timeframes
2. Weighted indicator calculations
3. Parameter aggregation and analysis
4. Signal strength determination
5. Color-coding and alert generation
--------------------------------------
How to Use
🔹 Initial Setup:
Add the indicator to a chart (use the 1D timeframe)
Select your preferred crypto category or create a custom list
Choose between Technical Analysis or Technical Metrics view
Set data sensitivity based on your trading style
🔹 Using the Technical Analysis View:
Monitor color-coded dots for quick market assessment
Green: bullish conditions
Red: bearish conditions
Gray: neutral conditions
Check the "Trade Signal" column for potential Long/Short entries signaled by confluences among technical and/or social data points
🔹 Using the Technical Metrics View:
Review detailed numerical values
Monitor slopes (↑↓ arrows) for the most recent trend direction of each data point
Watch for pivotal points (highlighted cells): these are data points that suggest potential trend reversals
Focus on the confluence of multiple indicators
The technical metrics view corroborates the conclusions shown in the Technical Analysis View, providing more details about some critical data points.
🔹 Alert Configuration:
Enable Technical Alerts for signal notifications (which coin/token seems most suited for Long or Short trades, and which coin/token is in a neutral/uncertain state for trading = "No Trade")
Configure alert conditions based on trading style
Set timeframe-appropriate sensitivity
Monitor alert messages for trade signals
Instructions on how to set alerts are provided in the script (enable "Signals Setup Instructions" in User Interface to get a step-by-step guide about setting up alerts)
Best Practices:
Confirm signals across multiple timeframes
Use appropriate sensitivity for your trading style
Monitor multiple categories for sector rotation
Combine signals with your trading strategy
Verify signals with price action confirmation and deep dive into the charts of your potential targets
--------------------------------------
About the Settings
🔹 Crypto Category Selection
Layer 1 & Major: Top market cap coins (BTC, ETH, XRP,...), established protocols
Layer 2 & Scaling: ETH L2s, scaling solutions
DeFi & Lending: Decentralized finance protocols
Gaming & Metaverse: Gaming and virtual world tokens
AI & Data: Artificial intelligence and data projects
Exchange & Trading: Exchange tokens, trading protocols
NFT & Social: NFT platforms, social tokens
Memes & Community: Community-driven tokens
Others & Misc: Other categories
Custom Category: User-defined list (up to 10 symbols)
Data Type Options
Technical Analysis: Color-coded summary view
Technical Metrics: Detailed numerical values of some key technical data points
Sensitivity Settings
Higher: Shorter timeframe, more frequent signals
Default: Balanced timeframe, standard signals
Lower: Longer timeframe, stronger signals
Alert Settings
Technical Alerts: Trade signal notifications
Data Timeframe: Minimum 1D required
Theme: Dark/Light mode options
Note: All analysis is performed on USDT Perpetual Futures pairs from Binance
--------------------------------------
FAQ
Q: Does the screener work on other exchanges besides Binance?
A: No, it's designed specifically for Binance USDT Perpetual Futures pairs. Binance offers the highest liquidity and trading volume in the crypto derivatives market, making it ideal for technical analysis. The extensive range of trading pairs and reliable data streams help ensure more accurate signals and analysis. Using a single high-liquidity exchange also helps avoid inconsistencies that could arise from aggregating data across multiple platforms with varying liquidity levels.
Q: What's the minimum timeframe required?
A: The screener requires a minimum 1D (daily) timeframe. This requirement ensures that the technical analysis has sufficient data points for reliable signal generation. Lower timeframes can produce more noise and false signals, while daily timeframes help filter out market noise and identify stronger trends.
Q: Why are some social metrics showing "NaN"?
A: "NaN" (Not a Number) appears when cryptocurrencies don't have associated LunarCrush data. This typically occurs with newer tokens or those with lower market caps. The technical analysis remains fully functional regardless of social metric availability, as these are complementary data points.
Q: How often are signals updated?
A: Signals update with each new candle on the selected timeframe (1D, 2D, or 1W). For example, on the default 2D setting, signals are recalculated every two days as new candles form. This helps reduce noise while maintaining timely analysis of market conditions.
Q: Can I add spot trading pairs?
A: No, the screener is optimized for Binance USDT perpetual futures pairs for data consistency and analysis purposes. While spot and perpetual prices typically align closely due to arbitrage, using a single data source (Binance) and contract type (USDT perpetual) ensures uniform data quality and analysis across all pairs. This standardization helps maintain reliable technical analysis and signal generation.
Q: How many coins can I add to my custom list?
A: Users can add up to 10 custom symbols to their watchlist. This limit is designed to maintain optimal performance while allowing focused monitoring of specific assets. The custom list complements the predefined categories that cover over 300 pairs.
Q: What determines signal confidence levels?
A: Signal confidence is calculated through a weighted algorithm that considers multiple factors: trend strength (Hull MA, DMI/ADX), momentum indicators (RSI, SRSI), volatility measurements (RVI, ATR, BB), volume analysis (OBV, volume trends), and price action patterns. Higher confidence levels indicate stronger alignment across these factors.
Q: Are signals guaranteed to work?
A: No. Signals are analytical tools based on historical and current market data, not guaranteed predictions. They should be used as one component of a comprehensive trading strategy that includes proper risk management, position sizing, and additional confirmation factors. Past performance does not guarantee future results.
Q: Why does the screener need higher timeframes?
A: Higher timeframes (1D minimum) provide several benefits: reduced market noise, more reliable technical signals, better trend identification, and lower likelihood of false signals. They also align better with institutional trading patterns and allow for a more thorough analysis of market conditions across multiple indicators.
--------------------------------------
Conclusion
The Altcoins Screener is a comprehensive crypto market analysis tool that:
Scans 300+ cryptocurrencies across 9 sectors on a single chart
Combines technical indicators and social metrics for signal generation
Identifies potential trading opportunities through color-coded visuals
Saves time by eliminating the need to monitor multiple charts
The tool is suited for:
Market overview and sector rotation analysis
Quick assessment of market conditions
Technical and social sentiment tracking
Systematic trading approach with alerts
Use this screener with caution and as a complement to any other tool you use to define your trading strategy.
--------------------------------------
Disclaimer
This indicator is for informational and educational purposes only:
Not financial advice: This indicator should not be considered investment advice.
No guarantee of accuracy: The indicator's calculations and signals are based on specific algorithms and data sources, but accuracy cannot be guaranteed. Market conditions can change rapidly.
Past performance is not predictive: Past performance of the indicator's signals or any specific asset is not indicative of future results.
Substantial risk of loss: Trading cryptocurrencies involves a substantial risk of loss. You can lose money trading these assets.
User responsibility: Users are solely responsible for their own trading decisions and should exercise caution.
Independent research required: Always conduct thorough independent research (DYOR) before making any trading decisions.
Technical analysis is one of many tools: Technical analysis, including the output of this indicator, is just one tool among many and should not be relied upon exclusively.
Risk management is essential: Use proper risk management techniques, including position sizing and stop-loss orders.
Comprehensive strategy: Use this tool as part of a comprehensive trading strategy, not as a standalone solution.
No liability for trading results: The Author assumes no responsibility or liability for any trading results or losses incurred as a result of using this indicator.
No TradingView affiliation: SwissAlgo is an independent entity and is not affiliated with or endorsed by TradingView.
LunarCrush data: The indicator utilizes publicly available data from LunarCrush. LunarCrush data and trademarks are the property of LunarCrush.
Consult a financial advisor: Consult with a qualified financial advisor before making any investment decisions.
By using this indicator, you acknowledge and agree to these terms. If you do not agree with these terms, please refrain from using this indicator.

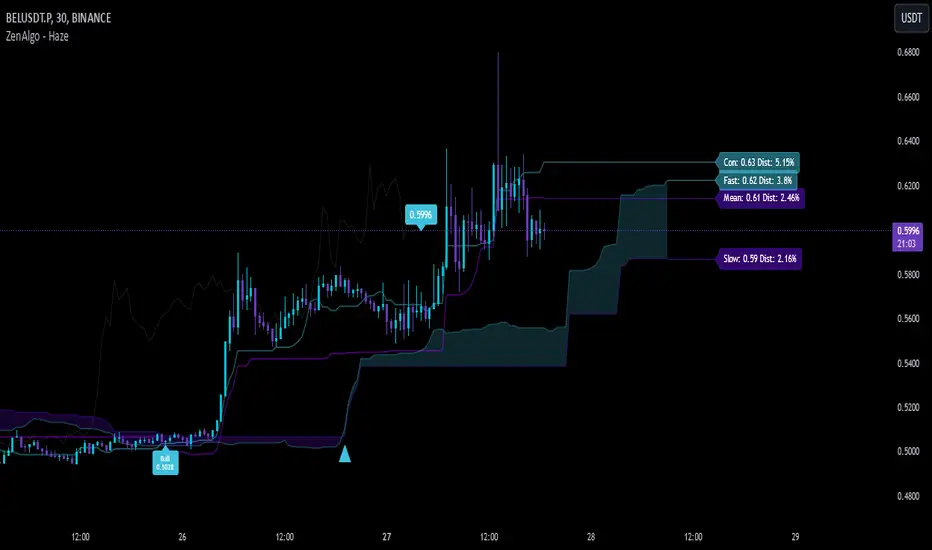
ZenAlgo - HazeThe ZenAlgo - Haze indicator offers an advanced framework for analyzing market trends, momentum shifts, and potential reversals. By integrating dynamic crossovers, predictive zones, and historical validation into a single tool, it provides traders with actionable insights for better decision-making. Its configurable settings for Crypto and Traditional adapt seamlessly to the unique characteristics of each market.
Features
Dynamic Trend Labels: Identifies "Bull," "Bear," "Super Bull," and "Super Bear" states based on crossover logic, price levels, and historical trends.
Market-Specific Adaptability: Switch between Crypto and Traditional settings for optimized analysis tailored to each market’s behavior.
Predictive Kumo Cloud: Forward-projected support and resistance zones help traders anticipate potential price movements.
Lagging Span Validation: Validates trends using historical price context for improved reliability.
Integrated Signals and Alerts: Combines crossovers and momentum shifts with real-time alerts for trend confirmation.
Added Value: Why Is This Indicator Original/Why Shall You Pay for This Indicator?
The Haze indicator differentiates itself through a carefully designed synergy of components, providing a depth of analysis that extends beyond traditional Ichimoku or Donchian-based indicators. Here’s what makes it valuable to traders:
1. Dynamic and Contextual Market Labels
Labels like Bull , Bear , Super Bull , and Super Bear do not merely indicate crossovers but also account for the relative position of price to predictive cloud zones and historical trends. This layered approach ensures signals are contextual and provide a clear understanding of the market's underlying strength or weakness.
These states are especially powerful because they simplify decision-making by summarizing complex market dynamics into actionable insights.
2. Market-Specific Optimization
The ability to switch between Crypto and Traditional configurations adapts the indicator to specific market conditions. For instance, Crypto's volatility requires wider periods for trend calculations, while Forex's tighter price movements benefit from shorter, more reactive settings. This adaptability ensures precision without needing multiple separate tools.
3. Predictive Insights
The forward-shifted Kumo cloud is designed to anticipate future support and resistance zones. Unlike reactive indicators that only analyze past data, this predictive feature gives traders an edge by offering a glimpse into potential price movements.
4. Integrated Synergy
The integration of components—Donchian channels for trend calculation, Kumo cloud for projections, and Lagging Span for historical validation—creates a holistic system. These components are not merely combined but interact to validate and reinforce each other's signals, reducing noise and increasing reliability.
5. Simplification Without Sacrificing Depth
By consolidating multiple elements into a single interface, Haze reduces chart clutter. It eliminates the need for traders to interpret separate indicators manually, saving time and improving clarity. This streamlined approach is particularly useful for traders working in fast-paced markets like Crypto.
How It Works
1. Dynamic Trend Detection
The indicator evaluates crossovers between the conversion and baseline lines. However, these are not simple crossovers—Haze analyzes the relative position of the price to the forward-displaced cloud and validates signals based on historical context (Lagging Span). For example:
A Super Bull signal is generated only when the conversion line crosses above the baseline, remains above the cloud, and is supported by rising price trends. This ensures that the signal reflects sustained bullish momentum rather than temporary spikes.
Similarly, a Super Bear signal requires the price and conversion line to be below the cloud, validated by a consistent downward trend.
2. Forward-Projected Kumo Cloud
The Kumo cloud is calculated by projecting key levels derived from Donchian channels into the future. This feature helps traders identify upcoming areas of support and resistance, enabling them to anticipate market behavior rather than reacting to it.
Cloud thickness indicates the strength of these zones; a wide cloud reflects robust support or resistance, while a narrow cloud suggests potential indecision or consolidation.
3. Lagging Span Validation
By plotting the current price backward, the Lagging Span provides historical validation of trends. For example:
If the Lagging Span remains above the cloud and price, it reinforces the bullish trend.
Conversely, if it falls below the cloud and price, it confirms bearish conditions. This backward-looking validation ensures that current signals are consistent with past market behavior.
4. Real-Time Alerts
Alerts are triggered when the Fast and Slow lines (calculated from Donchian channels) cross. These alerts are offset by the cloud’s displacement period to align with forward projections. This ensures t
5. Multi-Layered Label System
The indicator dynamically adjusts the visibility of labels based on the detected market state, providing traders with concise yet comprehensive feedback. For example:
Bull and Bear labels appear for preliminary signals, while Super Bull and Super Bear labels are reserved for high-confidence trends that meet stricter conditions.
6. Market-Specific Configurations
For Crypto, the indicator uses longer periods to capture broader trends and account for high volatility.
For Traditional, shorter periods provide quicker signals, tailored to the relatively stable nature of currency pairs.
Usage Examples
The Haze indicator is designed to be intuitive yet comprehensive, offering multiple layers of analysis to guide traders. Here's how to interpret its outputs effectively:
1. Interpreting Labels
Bull and Bear : Indicate the start of potential upward or downward momentum. These labels appear when the conversion line crosses the baseline but remain within or near the cloud, signaling a trend shift with moderate confidence.
Super Bull and Super Bear : Represent strong, confirmed trends. These labels require the conversion line and price to remain firmly above (Super Bull) or below (Super Bear) the cloud, validated by consistent price movements in the same direction.
Use the Super labels as confirmation of robust trends with high reliability, ideal for entering longer-term positions or scaling into existing trades.
2. Using the Kumo Cloud
The cloud serves as a visual representation of projected support and resistance levels.
Wide Cloud Zones: Indicate strong barriers, suggesting significant price consolidation or resistance at those levels.
Narrow Cloud Zones: Suggest weaker areas of support or resistance, often seen during periods of low volatility or indecision.
Above the Cloud: Signals a bullish market condition, where price is more likely to find support near the upper cloud boundary.
Below the Cloud: Indicates bearish conditions, with resistance likely near the lower cloud boundary.
3. Incorporating Alerts
Alerts for Fast/Slow Crossover provide a timely signal of potential momentum shifts.
A Cross Up occurring near or above the cloud strengthens bullish momentum.
A Cross Down near or below the cloud reinforces bearish momentum.
Use these alerts to refine entry and exit points, particularly in trending markets.
4. Validating Trends with the Lagging Span
The Lagging Span acts as a confirmation tool, validating current trends against historical price levels:
If the Lagging Span is above both the cloud and the current price, it confirms a strong bullish trend.
If it is below both the cloud and the price, it reinforces a bearish trend.
5. Multi-Timeframe Analysis
Analyze the indicator across multiple timeframes to gain a broader perspective on the market.
Use higher timeframes (e.g., daily or 4-hour charts) to identify dominant trends.
Use lower timeframes (e.g., 1-hour or 15-minute charts) for precise entry and exit points within the context of the larger trend.
6. Combining Labels and Cloud Zones
A Bull label within the cloud indicates a nascent uptrend but warrants caution until price moves above the cloud.
A Super Bull label above the cloud confirms strong bullish momentum, making it a high-confidence signal for taking long positions.
Conversely, a Super Bear label below the cloud signals strong downward momentum and potential shorting opportunities.
By interpreting these elements together, traders can gain a clearer understanding of market conditions and make more informed decisions without relying on multiple separate tools.
Limitations
Low-Volume Markets: In illiquid markets, such as some altcoins or exotic forex pairs, signals may be less reliable. Pair the indicator with additional tools like RSI or Bollinger Bands to filter out noise.
Sideways Markets: During periods of consolidation, frequent crossovers may produce false signals. Use complementary tools to confirm breakout conditions.
Short Timeframes: On very short timeframes (e.g., 1-minute charts), market noise may lead to unreliable signals. Applying the indicator to higher timeframes can improve reliability.
Volatile Events: In markets with extreme volatility, signals may lag behind rapid price movements. For better results, combine the indicator with a volatility filter, such as the Average True Range (ATR).
Important Notes
The indicator is a technical tool designed to support market analysis and should be used alongside other strategies, including fundamental analysis and sound risk management.
Always use stop-loss orders and proper position sizing to mitigate risks, particularly in volatile or uncertain market conditions.
This indicator does not guarantee trading success or profit and should be used as part of a comprehensive strategy.
TVMC - Composite Indicator with Technical RatingsDescription:
The TVMC (Trend, Volume, Momentum, Composite) indicator is a powerful multi-component tool designed to provide traders with a comprehensive understanding of market conditions. By combining four essential technical analysis components—trend, momentum, volume, and volatility—this indicator offers clear and actionable insights to assist in decision-making.
Key Features:
1. Trend Component (TC):
* Based on MACD (Moving Average Convergence Divergence), this component analyzes the relationship between two exponential moving averages (fast and slow) to determine the prevailing market trend.
* The MACD signal is normalized to a range of -1 to +1 for consistency and clarity.
2. Momentum Component (MC):
* Utilizes RSI (Relative Strength Index) to measure the strength and speed of price movements.
* This component highlights overbought or oversold conditions, which may indicate potential market reversals.
3. Volume Confirmation (VC):
* Compares the current trading volume to its moving average over a specified period.
* High volume relative to the average confirms the validity of the current trend.
4. Volatility Filter (VF):
* Uses ATR (Average True Range) to gauge market volatility.
* Adjusts and smooths signals to reduce noise during periods of high volatility.
5. Technical Ratings Integration:
* Incorporates TradingView’s Technical Ratings, allowing users to validate signals using moving averages, oscillators, or a combination of both.
* Users can choose their preferred source of ratings for enhanced signal confirmation.
How It Works:
The TVMC indicator combines the weighted contributions of the Trend, Momentum, and Volume components, further refined by the Volatility Filter. Each component plays a specific role:
* Trend: Identifies whether the market is bullish, bearish, or neutral.
* Momentum: Highlights the strength of price action.
* Volume: Confirms whether the current price action is supported by sufficient trading activity.
* Volatility: Filters out excessive noise in volatile market conditions, providing a smoother and more reliable output.
Visualization:
1. Bullish Signals:
* The indicator line turns green and remains above the zero line, indicating upward momentum.
2. Bearish Signals:
* The indicator line turns red and falls below the zero line, signaling downward momentum.
3. Neutral Signals:
* The line is orange and stays near zero, indicating a lack of strong trend or momentum.
4. Zones:
* Horizontal lines at +30 and -30 mark strong bullish and bearish zones, respectively.
* A zero line is included for clear separation between bullish and bearish signals.
Recommended Usage:
* Best Timeframes: The indicator is optimized for higher timeframes such as 4-hour (H4) and daily (D1) charts.
* Trading Style: Suitable for swing and positional trading.
* Customization: The indicator allows users to adjust all major parameters (e.g., MACD, RSI, volume, and ATR settings) to fit their trading preferences.
Customization Options:
* Adjustable weights for Trend, Momentum, and Volume components.
* Fully configurable settings for MACD, RSI, Volume SMA, and ATR periods.
* Timeframe selection for multi-timeframe analysis.
Important Notes:
1. Originality: The TVMC indicator combines multiple analysis methods into a unique framework. It does not replicate or minimally modify existing indicators.
2. Transparency: The description is detailed enough for users to understand the methodology without requiring access to the code.
3. Clarity: The indicator is explained in a way that is accessible even to users unfamiliar with complex technical analysis tools.
Compliance with TradingView Rules:
* The indicator is written in Pine Script version 5, adhering to TradingView’s language standards.
* The description is written in English to ensure accessibility to the global community, with a clear explanation of all components and functionality.
* No promotional content, links, or unrelated references are included.
* The chart accompanying the indicator is clean and demonstrates its intended use clearly, with no additional indicators unless explicitly explained.

Enhanced Cumulative Volume Delta + MAThe Enhanced Cumulative Volume Delta (CVD) indicator is designed to help traders analyze the cumulative buying and selling pressure in the market by examining the delta between the up and down volume. By tracking this metric, traders can gain insights into the strength of a trend and potential reversals. This indicator uses advanced volume analysis combined with customizable moving averages to provide a more detailed view of market dynamics.
How to Use This Indicator:
Volume Delta Visualization:
The indicator plots the cumulative volume delta (CVD) using color-coded candles, where teal represents positive delta (buying pressure) and soft red represents negative delta (selling pressure).
Moving Averages:
Use the moving averages to smooth the CVD data and identify long-term trends. You can choose between SMA and EMA for each of the three available moving averages. The first and third moving averages are typically used for short-term and long-term trend analysis, respectively, while the second moving average can serve as a medium-term filter.
Arrow Markers:
The indicator will display arrows (green triangle up for crossing above, red triangle down for crossing below) when the CVD volume crosses the 3rd moving average. You can control the visibility of these arrows through the input parameters.
Volume Data:
The indicator provides error handling in case no volume data is available for the selected symbol, ensuring that you're not misled by incomplete data.
Practical Applications:
Trend Confirmation: Use the CVD and moving averages to confirm the overall trend direction and strength. Positive delta and a rising CVD can confirm an uptrend, while negative delta and a falling CVD indicate a downtrend.
Volume Breakouts: The arrows marking when the CVD crosses the 3rd moving average can help you spot potential volume breakouts or reversals, making them useful for entry or exit signals.
Volume Divergence: Pay attention to divergences between price and CVD, as these can often signal potential trend reversals or weakening momentum.

RShar Seasonal RSISeasonal RSI
This indicator, Seasonal RSI, is designed to enhance trading decisions by combining the **Relative Strength Index (RSI)** with insights derived from historical **seasonality patterns**. It not only calculates RSI but also overlays seasonality data for the current week of the year, providing traders with a more contextualized view of market conditions.
---
### **Key Features**
#### 1. **Relative Strength Index (RSI) Calculation**
- The script calculates the RSI for a user-defined period (`RSI Length`), which is an oscillator used to measure the speed and magnitude of price changes.
- RSI values are plotted on the chart, helping traders identify **overbought** and **oversold** conditions.
- Thresholds for **Overbought** and **Oversold** levels are customizable, with default values of 70 and 30, respectively.
---
#### 2. **Dynamic RSI Coloring Based on Seasonality**
- The color of the RSI line dynamically adjusts based on historical **win rates** for the current week of the year:
- **Bright Green** for win rates > 65%.
- **Green** for win rates between 50-65%.
- **Red** for win rates between 35-50%.
- **Dark Red** for win rates < 35%.
- This feature gives traders a quick visual cue about whether the historical performance of the current week tends to be bullish, neutral, or bearish.
---
#### 3. **Overbought and Oversold Level Visualization**
- Overbought and oversold levels are displayed as dotted horizontal lines on the RSI chart.
- These levels act as visual guides for potential price reversals:
- **Overbought (default 70)**: Indicates potential selling pressure.
- **Oversold (default 30)**: Indicates potential buying pressure.
---
#### 4. **Seasonality Data Integration**
- Historical **seasonality data** is used to analyze price performance patterns for each week of the year:
- **Win Rate**: The percentage of years in which prices closed higher during the current week.
- **Average Weekly Change**: The average price percentage change during the current week over historical data.
- This data provides additional context to RSI readings, helping traders align their strategies with seasonal tendencies.
---
#### 5. **Information Table Overlay**
- A table is displayed in the **top-right corner** of the chart, summarizing seasonality data for the current week:
- **Week Win Rate**: Displays the percentage of historical years where prices rose during this week.
- **Avg Weekly Change**: Shows the average percentage price change for the current week. Positive values are displayed in green, and negative values are shown in red.
- This overlay provides actionable insights without cluttering the chart.
---
### **How It Works**
1. **Seasonality Data**:
- A function (`getSeasonalityForWeek`) fetches or uses predefined mock seasonality data for each week of the year.
- For each week, it calculates:
- The **Win Rate** (percentage of years with positive performance).
- The **Mean Change** (average price percentage change).
2. **RSI Plot**:
- The RSI line is plotted on the chart.
- The line's color is determined by the win rate for the current week, providing a visual representation of historical performance trends.
3. **Threshold Visualization**:
- Horizontal lines for overbought and oversold levels are drawn to assist in identifying potential reversal points.
4. **Information Table**:
- The table summarizes the current week's seasonality data for quick reference, helping traders make data-driven decisions.
---
### **Use Cases**
- **Short-Term Traders**:
Use the dynamic RSI colors and seasonality table to align short-term trades with historical patterns of weekly performance.
- **Swing Traders**:
Identify whether a stock or market is in an overbought/oversold condition while considering the seasonal tendency for the week.
- **Contextual Decision-Making**:
Combine traditional RSI signals with historical data to reduce false signals and improve timing.
---
### **Limitations**
- The script uses **mock seasonality data** in its default state. To make it fully functional, replace the mock data with actual historical performance metrics for your specific ticker or market.
- The indicator does not fetch real-time external data due to Pine Script’s limitations, so all seasonality data must be manually updated or hardcoded.
---
This indicator provides a powerful way to combine technical analysis with historical trends, offering a unique edge to traders by adding seasonal context to RSI signals.

Adaptive Fourier Transform Supertrend [QuantAlgo]Discover a brand new way to analyze trend with Adaptive Fourier Transform Supertrend by QuantAlgo , an innovative technical indicator that combines the power of Fourier analysis with dynamic Supertrend methodology. In essence, it utilizes the frequency domain mathematics and the adaptive volatility control technique to transform complex wave patterns into clear and high probability signals—ideal for both sophisticated traders seeking mathematical precision and investors who appreciate robust trend confirmation!
🟢 Core Architecture
At its core, this indicator employs an adaptive Fourier Transform framework with dynamic volatility-controlled Supertrend bands. It utilizes multiple harmonic components that let you fine-tune how market frequencies influence trend detection. By combining wave analysis with adaptive volatility bands, the indicator creates a sophisticated yet clear framework for trend identification that dynamically adjusts to changing market conditions.
🟢 Technical Foundation
The indicator builds on three innovative components:
Fourier Wave Analysis: Decomposes price action into primary and harmonic components for precise trend detection
Adaptive Volatility Control: Dynamically adjusts Supertrend bands using combined ATR and standard deviation
Harmonic Integration: Merges multiple frequency components with decreasing weights for comprehensive trend analysis
🟢 Key Features & Signals
The Adaptive Fourier Transform Supertrend transforms complex wave calculations into clear visual signals with:
Dynamic trend bands that adapt to market volatility
Sophisticated cloud-fill visualization system
Strategic L/S markers at key trend reversals
Customizable bar coloring based on trend direction
Comprehensive alert system for trend shifts
🟢 Practical Usage Tips
Here's how you can get the most out of the Adaptive Fourier Transform Supertrend :
1/ Setup:
Add the indicator to your favorites, then apply it to your chart ⭐️
Start with close price as your base source
Use standard Fourier period (14) for balanced wave detection
Begin with default harmonic weight (0.5) for balanced sensitivity
Start with standard Supertrend multiplier (2.0) for reliable band width
2/ Signal Interpretation:
Monitor trend band crossovers for potential signals
Watch for convergence of price with Fourier trend
Use L/S markers for trade entry points
Monitor bar colors for trend confirmation
Configure alerts for significant trend reversals
🟢 Pro Tips
Fine-tune Fourier parameters for optimal sensitivity:
→ Lower Base Period (8-12) for more reactive analysis
→ Higher Base Period (15-30) to filter out noise
→ Adjust Harmonic Weight (0.3-0.7) to control shorter trend influence
Customize Supertrend settings:
→ Lower multiplier (1.5-2.0) for tighter bands
→ Higher multiplier (2.0-3.0) for wider bands
→ Adjust ATR length based on market volatility
Strategy Enhancement:
→ Compare signals across multiple timeframes
→ Combine with volume analysis
→ Use with support/resistance levels
→ Integrate with other momentum indicators

Normalized Jurik Moving Average [QuantAlgo]Upgrade your investing and trading strategy with the Normalized Jurik Moving Average (JMA) , a sophisticated oscillator that combines adaptive smoothing with statistical normalization to deliver high-quality signals! Whether you're a swing trader looking for momentum shifts or a medium- to long-term investor focusing on trend validation, this indicator's statistical approach offers valuable analytical advantages that can enhance your trading and investing decisions!
🟢 Core Architecture
The foundation of this indicator lies in its unique dual-layer calculation system. The first layer implements the Jurik Moving Average, known for its superior noise reduction and responsiveness, while the second layer applies statistical normalization (Z-Score) to create standardized readings. This sophisticated approach helps identify significant price movements while filtering out market noise across various timeframes and instruments.
🟢 Technical Foundation
Three key components power this indicator are:
Jurik Moving Average (JMA): An advanced moving average calculation that provides superior smoothing with minimal lag
Statistical Normalization: Z-Score based scaling that creates consistent, comparable readings across different market conditions
Dynamic Zone Detection: Automatically identifies overbought and oversold conditions based on statistical deviations
🟢 Key Features & Signals
The Normalized JMA delivers market insights through:
Color-adaptive oscillator line that reflects momentum strength and direction
Statistically significant overbought/oversold zones for trade validation
Smart gradient fills between signal line and zero level for enhanced visualization
Clear long (L) and short (S) markers for validated momentum shifts
Intelligent bar coloring that highlights the current market state
Customizable alert system for both bullish and bearish setups
🟢 Practical Usage Tips
Here's how to maximize your use of the Normalized JMA:
1/ Setup:
Add the indicator to your favorites, then apply it to your chart ⭐️
Begin with the default smoothing period for balanced analysis
Use the default normalization period for optimal signal generation
Start with standard visualization settings
Customize colors to match your chart preferences
Enable both bar coloring and signal markers for complete visual feedback
2/ Reading Signals:
Watch for L/S markers - they indicate validated momentum shifts
Monitor oscillator line color changes for direction confirmation
Use the built-in alert system to stay informed of potential trend changes
🟢 Pro Tips
Adjust Smoothing Period based on your trading style:
→ Lower values (8-12) for more responsive signals
→ Higher values (20-30) for more stable trend identification
Fine-tune Normalization Period based on market conditions:
→ Shorter periods (20-25) for more dynamic markets
→ Longer periods (40-50) for more stable markets
Optimize your analysis by:
→ Using +2/-2 zones for primary trade signals
→ Using +3/-3 zones for extreme market conditions
→ Combining with volume analysis for trade confirmation
→ Using multiple timeframe analysis for strategic context
Combine with:
→ Volume indicators for trade validation
→ Price action for entry timing
→ Support/resistance levels for profit targets
→ Trend-following indicators for directional bias
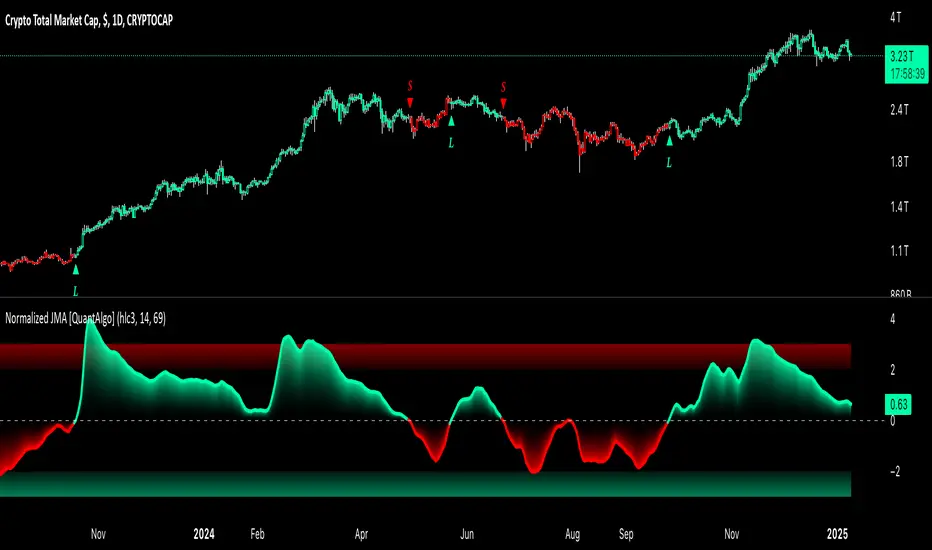
Relative Performance Indicator by ComLucro - 2025_V01The "Relative Performance Indicator by ComLucro - 2025_V01" is a powerful tool designed to analyze an asset's performance relative to a benchmark index over multiple timeframes. This indicator provides traders with a clear view of how their chosen asset compares to a market index in short, medium, and long-term periods.
Key Features:
Customizable Lookback Periods: Analyze performance across three adjustable periods (default: 20, 50, and 200 bars).
Relative Performance Analysis: Calculate and visualize the difference in percentage performance between the asset and the benchmark index.
Dynamic Summary Label: Displays a detailed breakdown of the asset's and index's performance for the latest bar.
User-Friendly Interface: Includes customizable colors and display options for clear visualization.
How It Works:
The script fetches closing prices of both the asset and a benchmark index.
It calculates percentage changes over the selected lookback periods.
The indicator then computes the relative performance difference between the asset and the index, plotting it on the chart for easy trend analysis.
Who Is This For?:
Traders and investors who want to compare an asset’s performance against a benchmark index.
Those looking to identify trends and deviations between an asset and the broader market.
Disclaimer:
This tool is for educational purposes only and does not constitute financial or trading advice. Always use it alongside proper risk management strategies and backtest thoroughly before applying it to live trading.
Chart Recommendation:
Use this script on clean charts for better clarity. Combine it with other technical indicators like moving averages or trendlines to enhance your analysis. Ensure you adjust the lookback periods to match your trading style and the timeframe of your analysis.
Additional Notes:
For optimal performance, ensure the benchmark index's data is available on your TradingView subscription. The script uses fallback mechanisms to avoid interruptions when index data is unavailable. Always validate the settings and test them to suit your trading strategy.

Relative Trend Navigator Pro [QuantAlgo]Upgrade your trend-following investing and trading strategy with Relative Trend Navigator Pro by QuantAlgo , a sophisticated technical indicator that combines adaptive trend recognition with dynamic momentum analysis to deliver high quality market insights. Whether you're a medium- to long-term investor focusing on sustained moves or an active trader seeking high-probability entries, this indicator's multi-layered approach offers valuable strategic advantages that you don't want to miss out on!
🟢 Core Architecture
The foundation of this indicator lies in its innovative Relative Trend Index (RTI) calculation and dynamic state management system. By implementing a unique array-based analysis alongside statistical volatility measures, each price movement is evaluated against its historical context while maintaining responsiveness to current market conditions. This sophisticated approach helps distinguish genuine trend developments from market noise across various timeframes and instruments.
🟢 Technical Foundation
Three key components power this indicator are:
Dynamic Trend Boundaries: Utilizes standard deviation-based channels to establish adaptive price ranges
Array-Based Historical Analysis: A comprehensive dynamic momentum system that processes and sorts historical data for trend context
Relative Trend Index (RTI): A normalized calculation that measures current price position relative to historical boundaries
🟢 Key Features & Signals
The Relative Trend Navigator Pro delivers market insights through:
Color-adaptive RTI line that reflects trend strength and direction
Dynamic threshold levels for bull and bear signal generation
Smart fill coloring between RTI and zero line for enhanced visualization
Clear entry and exit markers for validated trend changes
Intelligent bar coloring that highlights current trend state
Customizable alert system for both bullish and bearish setups
🟢 Practical Usage Tips
Here's how to maximize your use of the Relative Trend Navigator Pro :
1/ Setup:
Add the indicator to your favorites ⭐️
Begin with the default historical lookback for balanced analysis
Use the default sensitivity setting for optimal signal generation
Start with standard threshold levels
Customize visualization colors to match your chart preferences
Enable both bar coloring and signal markers for complete visual feedback
2/ Reading Signals:
Watch for signal markers - they indicate validated trend transitions
Monitor RTI line color changes for trend direction confirmation
Observe the fill color between RTI and zero line for trend strength
Use the built-in alert system to stay informed of potential trend changes
🟢 Pro Tips
Adjust Historical Lookback Period based on your preferred timeframe:
→ Lower values (20-50) for more responsive signals
→ Higher values (100-200) for more stable trend identification
Fine-tune Sensitivity based on market conditions:
→ Higher values (95-100) for choppy markets
→ Lower values (85-95) for trending markets
Optimize Threshold Levels for your strategy:
→ Increase thresholds for stronger trend confirmation
→ Decrease thresholds for earlier entries
Combine with:
→ Volume analysis for trade confirmation
→ Multiple timeframe analysis for strategic context
→ Support/resistance levels for entry/exit refinement
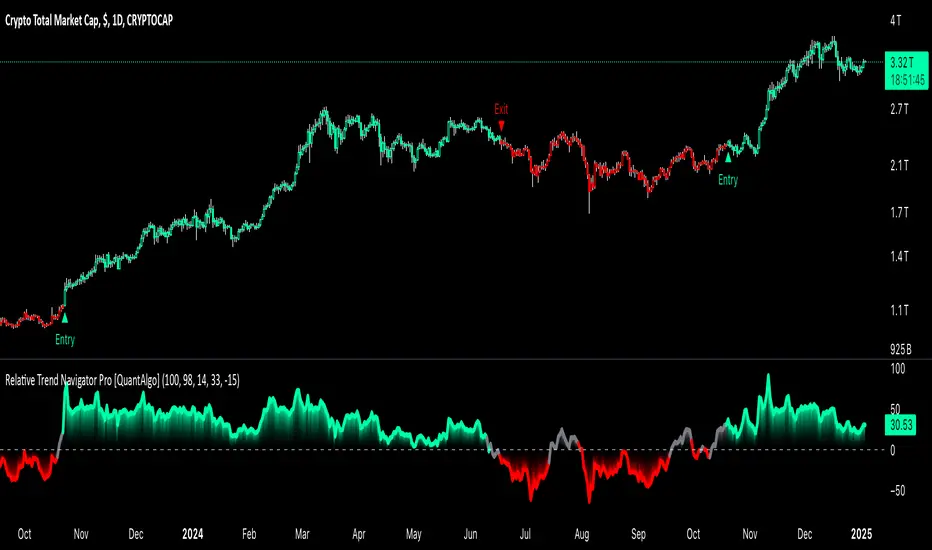
Market Cycles
The Market Cycles indicator transforms market price data into a stochastic wave, offering a unique perspective on market cycles. The wave is bounded between positive and negative values, providing clear visual cues for potential bullish and bearish trends. When the wave turns green, it signals a bullish cycle, while red indicates a bearish cycle.
Designed to show clarity and precision, this tool helps identify market momentum and cyclical behavior in an intuitive way. Ideal for fine-tuning entries or analyzing broader trends, this indicator aims to enhance the decision-making process with simplicity and elegance.