RSI Timeframes + Shadow
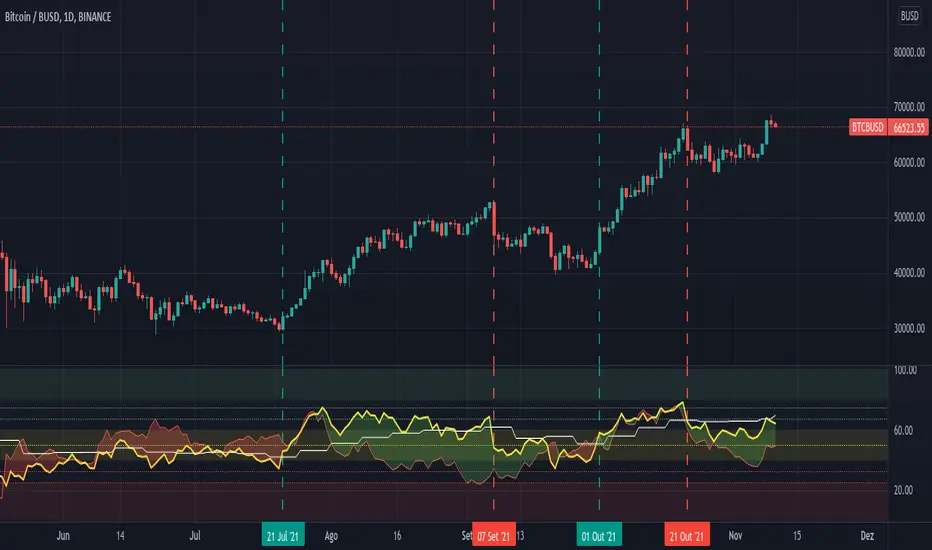
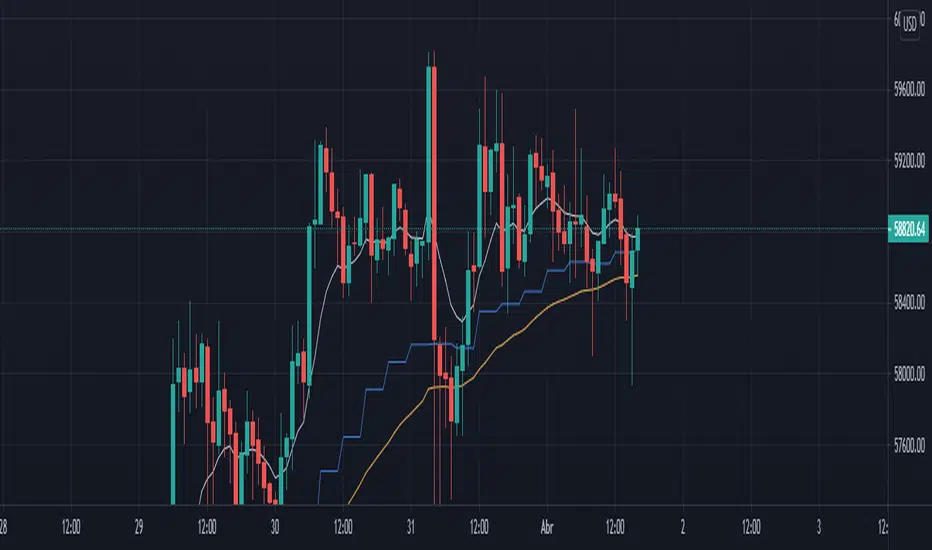
The RSI Timeframes + Shadow can be used to view RSI in different graphic times and at the same time analyze the RSI of another asset correlated with the current example: altcoins and BTC dominance, equities and SP500 , Brazilian equities and IBOV or FIIs and IFIX .
Fast RSI - yellow line
Slow RSI - white line
Correlational RSI - red line
It allows you to set an additional time frame different to the one on your chart. With this you could for example use a slower RSI than your other Strategy's candle period.
In the example the vertical lines in the graph show when the fast RSI crosses above the slow RSI represented by the cyan line and when the fast RSI crosses below the slow RSI represented by the red line.
You can also change the settings to view the RSI of other assets correlated with the current one to track them in the same graph time.
This indicator works with any available symbol.
#brazilian portuguese
O RSI Shadow pode ser utilizado para ver o RSI em tempos gráficos diferentes e ao mesmo tempo analisar o RSI de outro ativo correlacionado com o atual exemplo: Altcoins e dominância do BTC , acoes e SP500 , acoes brasileiras e IBOV ou FIIs e IFIX .
RSI rápido - linha amarela
RSI lento - linha branca
RSI correlacional - linha vermelha
Ele permite que você defina um período de tempo adicional diferente daquele em seu gráfico. Com isso, você pode, por exemplo, usar um RSI mais lento do que o período de vela da sua outra estratégia.
No exemplo as linhas verticais no gráfico mostra quando o RSI rápido cruza acima do RSI lento representado pela linha ciano e quando RSI rápido cruza abaixo do RSI lento representado pela linha vermelha.
Voce também pode alterar as configurações para visualizar o RSI de outro ativo correlacionado com o atual para acompanha eles no mesmo tempo gráfico.
Esse indicador funciona com qualquer simbolo disponível.
Timeframes
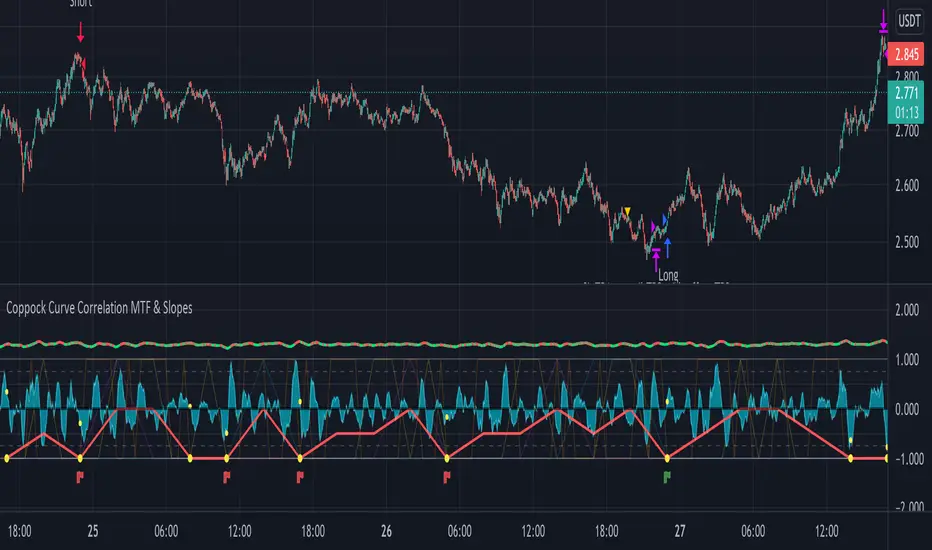
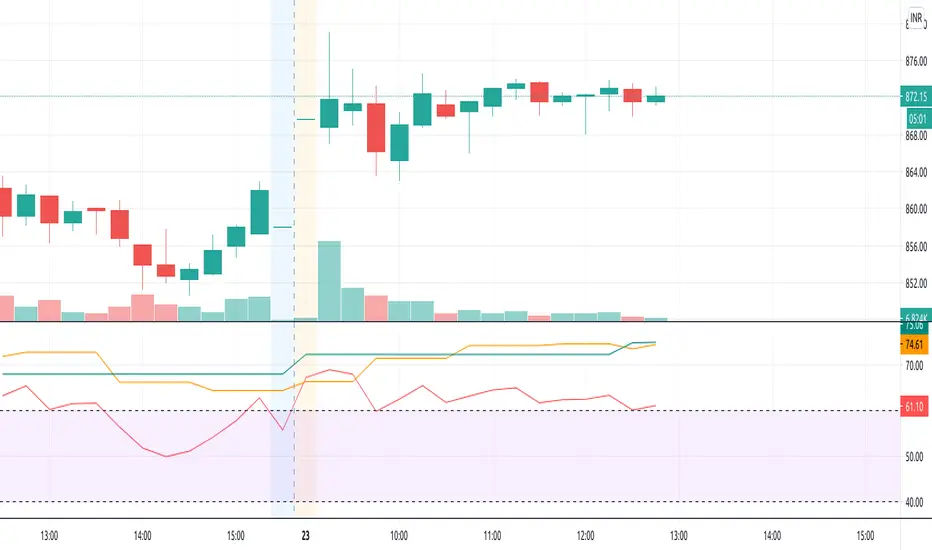
Coppock Curve Correlation MTF & Slopes - Long Strategy- This strategy is based on the Coppock Curve Correlation MTF & Slopes tool
- Condition for entry is very simple :
-> If the correlation of 8 timeframes expressed by 4 curves reaches 1 or -1
-> and the Coppock curve and the Coppock Slope (on 3 periodes back) are rising => then entry.
(You can also visually look at : orange/yellow dot on the slope wave and green flag).
- There's the possibility to trail stop loss and multiple take profit levels.
- Back testing period setting.
- I've added the possibility to extend the lookback period of the correlation for the curves.
- Results could be interesting with a well managed trailing stop loss / take profit and trading on higher time frames.
Market spot - ADA/USDT
Timeframe = 3min
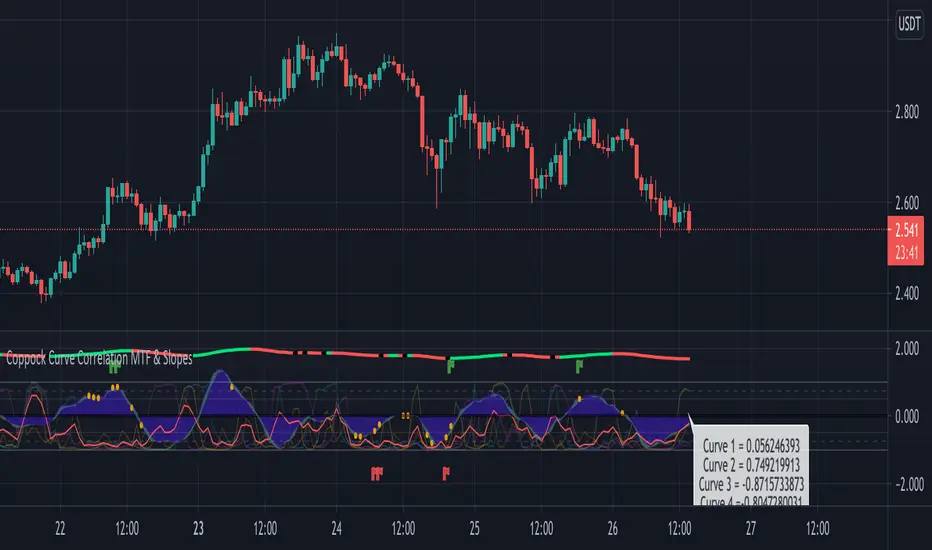
Coppock Curve Correlation between MTF & SlopesMy first tool !
1. The waves shows the slope of the curve. The front one = 3 periods, back one = 2 periods, difference = white area.
2. The moving lines shows the curve correlation between 2x 2 time frames (adjustable on the settings) on 2 periods lookback.
2.1 Theres few regions of high correlation, lines are at (absolute values) 0.5, 0.75, 1
3. On the top there's the Coppock curve -> if falling since 1 period = red, else green.
4. Diamonds shows : if correlation is in the strong correlation area and slope is falling or rising : red or green diamond.
This tool could be interesting to have an idea if there's strong correlation between timeframes instead of watching 4-5 different timeframes !
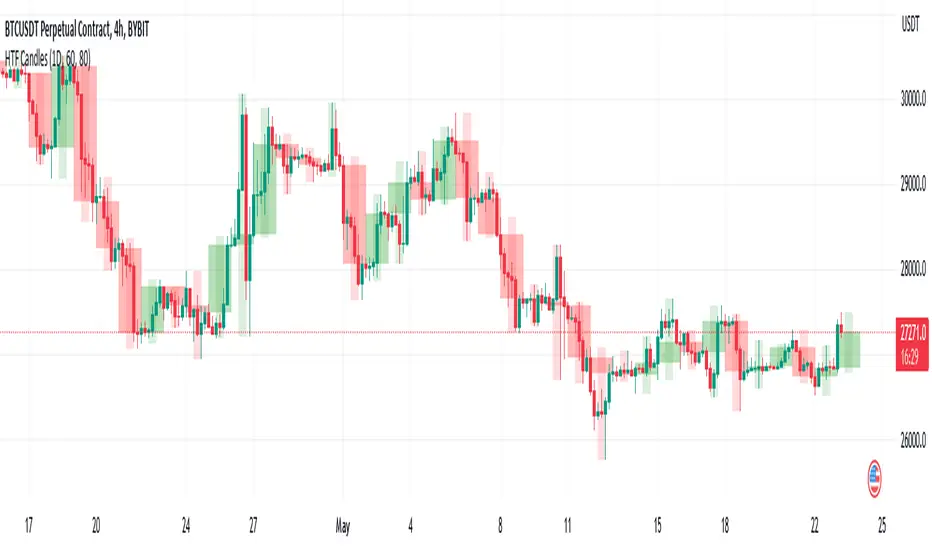
HTF CandlesThis draws candlesticks from higher time frames on the current chart. I tried to keep the script simple using some newly introduced Pine capabilities.
To change the options like the higher time frame and candle colors, check the indicator settings.
Looking forward to your opinions!
Multi_TF_EMAMultiple TimeFrame EMA
In a single indicator, up to 6 EMAs can be displayed in 6 different time frames.
En un solo indicador se puede visualizar hasta 6 EMAs en diferentes TImeFrames.
Multi RSI based on Timeframe
This code has been inherited from " 3 RSI Multi Timeframe Inception" by pranjalchaubey and enhanced/modified to include 2 more RSI indicators. The RSIs considered are 15 minutes, 1 Hour, Daily, Weekly and Monthly displayed based on chart time frame.
The number of RSI indicators displayed is context dependant or time frame based, as below,
15min, hourly and daily RSIs are displayed on 15 mins or hourly charts, often used for Intraday trading,
Daily, Weekly and Monthly RSIs are displayed for Daily charts / Swing trading and
Weekly and Monthly RSIs for Weekly time frame / Positional trades.
Multi timeframes 4 SMA'sThis script gives you the possibility to fastly plot 4 SMA's (défault 20, 50, 100 and 200 periods) in the actual TimeFrame and for 4 others timeframes.
In fact, when you're in lower timeframes, you may want to see where highers TF SMA's are without always changing the TF of the chart. This script was created for that.
It's really simply to use, by default only 4 SMA's of the present timeframe are ploted. If you want to check the higher TF SMA's, just tick the lines in the script parameters.
No strategy here, only trying to faster the use of indicators by changing parameters on multiple MA in the same time.
Don't hesitate to leave a comment if you have ideas to improve the script.
Enjoy !

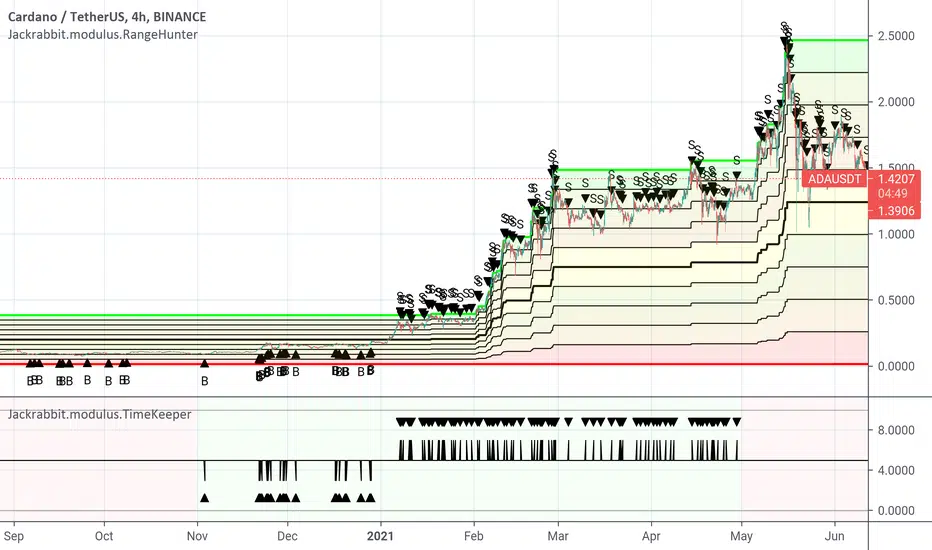
Jackrabbit.modulus.TimeKeeperThis is the Time Keeper for the Jackrabbit suite and modulus framework.
The entire modulus framework has been built upon taking historical data and working with the "flow" of that data, no matter what state the market is in. This has often lead to missed opportunities and an asset may be serverely channel locked from the historical data. Many coins still suffer this from the Black Thursday market drop.
This module interrupts the "flow" of historical data and allow the ability to trade is if the past didn't exist. This can be a very important step for the DCA module in avoiding long term channeled situations. There are many other benefits to this module as well with respect to time trading limitations.
The downside is that historical data is completely disregarded. Care must be used in the placement of this module within your IoI chain.
Only the signal line is displayed.
Times are based upons TradingView, not your local timezone.
Red backgrounds are when the trading action is outside the time limits of the module. Green is when trading action is in the limits of the module.
Start and end times are user configurable.
The Jackrabbit modulus framework is a plug in play paradigm built to operate through TradingView's indicator on indicatior (IoI) functionality. As such, this script receives a signal line from the previous script in the IoI chain, and evaluates the buy/sell signals appropriate to the current analysis.
This script is by invitation only. To learn more about accessing this script, please see my signature or send me a PM. Thank you.
[CP]3 RSI Multi Timeframe InceptionTriple RSI indicator where you can set the timeframe for each RSI.
Take confirmation from different timeframes to make high probability trades!
Typical settings would be,
1 Day, 1 Week, 1 Month or
1 hr, 4hr, 1 Day or
3 min, 15 min, 1 hr or.........your imagination is the only limit here!

True Strong Classical Support/Resistance LevelsThis script is based on the approach of filtering signals by checking higher timeframes.
So basically setting higher numbers in "Strength Of Levels" option, will make the indicator check for support and/or resistance levels in timeframes higher than the current.
Unfortunately, I was forced to still use inefficient built-in functions pivothigh() and pivotlow(). I hope they fix them up soon!
I'm looking for any opinion about the idea and if you like any of my scripts, anything you send means a lot to me.
This script is published for the third time because of some moderators absurd behavior.
But thank heavens, the code is now more clean and of course the option "Strength Of Levels" accepts float numbers.

DC Time KeeperBefore anything, take notes of the script limitations :
1) This script doesn't give trading information on itself.
It is intended has additional value to my other script named : Time Dilated Donchian Channel
Blue line = Normal time of the day
Orange line = Observed time of the day
Red line = What if time travel was allowed... Which time would I observe?
More information about this script :
2) The script has the setting : "Max_bars_back" set to 390. This is required to use dynamic length and an "internal clock"
*390 is the normal number of bars in a typical stock trading day.
3) The script requires volume data to work correctly
* I use a way to represent volatility that requires ( volume + price movement + time, no sma , no stdev)
Why ? Because:
HIGH-LOW = Fail to get gap information, fail to get volume information
TR /ATR = Fail to get volume information
STDEV = Not very good with dynamic length as it use SMA and fails when length <2
SMA = SMA give very strange results when using non-integer numbers.
So a good idea is to use the 1 minute timeframe for this indicator.
Conclusion: this script is basically limited to stock trading.
If I could set Max_bars_back to 23 400 this would even work better with a 1 second time frame as more data would be entered in the system.
The idea behind the script is that volatility exists in two different formats depending on how you observe the situation.
Remember your physics class? Light can be a wave or a particle depending of the situation.
Volatility seems to share a strange similar property.
If volatility share similarities with light, then time dilation effect could be applied to stock movement.
Time Dilation formula
Time observed = (Last time - First time) / sqrt(1-(pow(v,2)/pow(c,2))
I've tried a lot of ways to use this formula as is.
Problem is : C.
C is the speed of light and I haven't found the equivalent stock market constant yet.
In order to keep the law of physics like they actually work, when a new time is set, I had to "Protect its value".
protected_new_time = highest_(observed time , normal time)
No time travel is allowed. *yet.
For more information about time dilation:
en.wikipedia.org

3MAs & BB, Time-Res, Low-VolTriple MAs with EMA/SMA option, and specific timeframe options.
Very customizable.
Bollinger Bands
If BollingerBand Width is lowest in 100 bars it fills background.

ALLinBull&Bear v9.0 STRATEGYEach of my Allin Custom Indicators combined, ads to your understanding where the Market could go next. Each of them have their own purpose and set of rules.
You will weight gathered information to get a better understanding of when to ENTER or EXIT a position (SHORT or LONG).
First you need to find the right Indicator Settings and the best preforming TimeFrame for chosen crypto or fiat pair. You will do that with a "STRATEGY" Indicator. I chose either 3min TF for highly liquid assets or 15min TF for assets of low liquidity but you can choose whatever you want to up to 30min TF.
Do not stop until you find 80% or more Precent Profitable result (test different setting on different TF for best results) in Strategy Tester. You can backtest your Strategy with different settings and in different TimeFames to find the very best results for that pair.
BACKTESTING past results does not guarantee your future results. BACKTESTING is used to fine-tune your indicator.
Example: with a guitar tuner (Strategy Tester in our case) you fine-tune your guitar (our Indicators in our case) so you know what tone the guitar will produce when you hit a certain note ("in-tuned" visual interpretation of the Market in our case). It is normal to get a 100% Precent Profitable result from backtesting with very little Drawdown. More than 80% and low drawdown usually means Indicators is "in-tune".
CUSTOM INDICATOR TYPE: STRATEGY
SETUP
There are five different settings. To use them efficiently you need to understand what is their purpose and meaning.
"2nd", "3rd" and "4th" FIELD
All of my custom indicators use data from 4 different TimeFrames. First TimeFrame is the one you picked in TradingView. Now you need to set up the other three TimeFrames. To do that you need to click on the "Settings" icon on this indicator and change the "2nd", "3rd" and "4th" field. The preferred setting I use to start searching for the best performing set of Settings is 2-8-32 OR 3-9-27 OR 4-16-64 OR 5-20-80. Those numbers are multiplication of chosen TimeFrame.
Example: setting 2-8-32 on a 5-minute TimeFrame means it will gather data from 5min TF, 10min TF (5minX2), 40min TF (5minX8) and 160min TF (5minX32).
Smoother FIELD
This Field is used to average down all that data indicator it is gathering from the price chart. I use integers like for example 9, 18, 27, and any number in between. It is connected to volatility. High Volatility needs Low Number and vice versa.
Threshold FIELD
This Field is used to cancel down all the mini signal confirmations that are false due to an insignificant influence on future price movements. This number is usually best at 21. When you set all other Fields and get satisfying results you can still try and fine-tune it even more and get even better results.
HOW TO USE IT
First, you have to choose your TimeFrame. I choose either 3min TF for highly liquid assets and 15min TF for assets of low liquidity but you can choose whatever you want to up to 30min TF. Example: if you chose 30min TimeFrame and you fill the "4th" Field with the number "80", one of observed TF by the indicator will be "30minX80" or "2400min" or "40h" TimeFrame, so it is HUGE.
It always depends based on the nature of the actual pair you are looking at. If it is very volatile with a lot of volume, the market beat for this pair settings is very different from another pair with for example very little volume and low volatility. So you need to find the right Indicator Settings at the right TimeFrame for each pair you are following. You are basically tuning your Indicator like you would tune your guitar so you know what to expect before hitting those "strings" of yours.
Find the best performing setting and TimeFrame with help from a TradingView feature called "Strategy Tester". Get familiar with this feature. But rule of thumb is: everything more than 80% Precent Profitable result with Max Drawdown (negative yield from the worst closed position) lower or similar to AvgTrade is considered good enough tuning of my Indicators.
You need to reevaluate your best setting whenever your last trade gets a negative result or something big (whale manipulation) happens on the market. You need to re-tune your Indicator so it will be in tune with the Market again. Check and try to find better performing (better Precent Profitable result, lower Drawdown) settings periodically every few days to find your best yielding results.
CUSTOM INDICATOR: BULL&BEAR
HOW TO READ IT
WHITE WAVY LINE AND TWO HORIZONTAL WHITE LINES
With this one just follow the existing rules when exiting an oversold or overbought area as in RSI,CCI or SRSI indicator. When combining with the signal colored lines in the background it then makes better sense if it is a false signal and it will turn back or it is the right signal and it will exit the oversold or overbought area and advance in that direction.
IN THE BACKGROUND: NINE COLORED LINES
Rule of thumb here is the more GREEN LINES you see the more LONG/BUY the Signal is and vice versa. It helps to look at those lines a few hours back to get the "feel" where the market is pushing the price. First (1), second (2) and seventh (7) line are the most important lines and they have to be aligned and prevailed in the same color to get a viable signal but it still needs to be confirmed with other Signals.
Before making any decisions based on visualisation you should refresh the page. Indicator is very data sensitive and needs that very last data for the most accurate visual representation of the Market.

ALLinOscillator v3.0 STRATEGYEach of my Allin Custom Indicators combined, ads to your understanding where the Market could go next. Each of them have their own purpose and set of rules.
You will weight gathered information to get a better understanding of when to ENTER or EXIT a position (SHORT or LONG).
First you need to find the right Indicator Settings and the best preforming TimeFrame for chosen crypto or fiat pair. You will do that with a "STRATEGY" Indicator. I chose either 3min TF for highly liquid assets or 15min TF for assets of low liquidity but you can choose whatever you want to up to 30min TF.
Do not stop until you find 80% or more Precent Profitable result (test different setting on different TF for best results) in Strategy Tester. You can backtest your Strategy with different settings and in different TimeFames to find the very best results for that pair.
BACKTESTING past results does not guarantee your future results. BACKTESTING is used to fine-tune your indicator.
Example: with a guitar tuner (Strategy Tester in our case) you fine-tune your guitar (our Indicators in our case) so you know what tone the guitar will produce when you hit a certain note ("in-tuned" visual interpretation of the Market in our case). It is normal to get a 100% Precent Profitable result from backtesting with very little Drawdown. More than 80% and low drawdown usually means Indicators is "in-tune".
CUSTOM INDICATOR TYPE: STRATEGY
SETUP
There are five different settings. To use them efficiently you need to understand what is their purpose and meaning.
"2nd", "3rd" and "4th" FIELD
All of my custom indicators use data from 4 different TimeFrames. First TimeFrame is the one you picked in TradingView. Now you need to set up the other three TimeFrames. To do that you need to click on the "Settings" icon on this indicator and change the "2nd", "3rd" and "4th" field. The preferred setting I use to start searching for the best performing set of Settings is 2-8-32 OR 3-9-27 OR 4-16-64 OR 5-20-80. Those numbers are multiplication of chosen TimeFrame.
Example: setting 2-8-32 on a 5-minute TimeFrame means it will gather data from 5min TF, 10min TF (5minX2), 40min TF (5minX8) and 160min TF (5minX32).
Smoother FIELD
This Field is used to average down all that data indicator it is gathering from the price chart. I use integers like for example 9, 18, 27, and any number in between. It is connected to volatility. High Volatility needs Low Number and vice versa.
Threshold FIELD
This Field is used to cancel down all the mini signal confirmations that are false due to an insignificant influence on future price movements. This number is usually best at 21. When you set all other Fields and get satisfying results you can still try and fine-tune it even more and get even better results.
HOW TO USE IT
First, you have to choose your TimeFrame. I choose either 3min TF for highly liquid assets and 15min TF for assets of low liquidity but you can choose whatever you want to up to 30min TF. Example: if you chose 30min TimeFrame and you fill the "4th" Field with the number "80", one of observed TF by the indicator will be "30minX80" or "2400min" or "40h" TimeFrame, so it is HUGE.
It always depends based on the nature of the actual pair you are looking at. If it is very volatile with a lot of volume, the market beat for this pair settings is very different from another pair with for example very little volume and low volatility. So you need to find the right Indicator Settings at the right TimeFrame for each pair you are following. You are basically tuning your Indicator like you would tune your guitar so you know what to expect before hitting those "strings" of yours.
Find the best performing setting and TimeFrame with help from a TradingView feature called "Strategy Tester". Get familiar with this feature. But rule of thumb is: everything more than 80% Precent Profitable result with Max Drawdown (negative yield from the worst closed position) lower or similar to AvgTrade is considered good enough tuning of my Indicators.
You need to reevaluate your best setting whenever your last trade gets a negative result or something big (whale manipulation) happens on the market. You need to re-tune your Indicator so it will be in tune with the Market again. Check and try to find better performing (better Precent Profitable result, lower Drawdown) settings periodically every few days to find your best yielding results.
CUSTOM INDICATOR: OSCILLATOR
HOW TO READ IT
GREEN AREA on the bottom and RED AREA on top are just like the oversold or overbought areas in RSI, CCI or SRSI and uses the same principle.
Example: when a WHITE wave line crosses-UP WHITE horizontal line in GREEN area it means that it is a LONG/BUY signal/confirmation. It needs to be confirmed with other confirmation signals in that same Indicator on in a "BULL&BEAR" Indicator to get better understanding that the price would not turn back down due to a false price move in UPWARDS direction.
GREEN or RED OSCILLATOR WAVE AREAS indicates the direction price is going and how strong the "force" behind the price move is.
Example: if WHITE LINE is over the RED/GREEN LINE the area turns GREEN and it is a LONG/BUY signal. When a shadow color is on the OTHER SIDE that means it is an added confirmation for a LONG/BUY position. When a SHADOW AREA is over the GREEN AREA and turns RED it usually means there are still forces pulling the price down.
Before making any decisions based on visualisation you should refresh the page. Indicator is very data sensitive and needs that very last data for the most accurate visual representation of the Market.

Takashi Trend | 2nd Gen |Discover trends instantly thanks to our new indicator.
A popular trading expression says: "the trend is your friend until it ends." This indicator makes it easier for any trader to see the market's major trend and trade accordingly.
Calculations are based on Average True Range.
This indicator does not provide signals or alerts. It is best used as a confirmation tool.
To get access to this and other scripts check links below.

Multiple Timeframe Five Moving AveragesThis allows you to plot up to 5 moving averages on your chart at once. You can either use the chart's current timeframe or select a custom timeframe for your 5 moving averages (for example, you can see the 200DMA on your 4h chart without having to adjust the moving average length). You can also choose amongst SMA , EMA , and HULLMA for each MA.

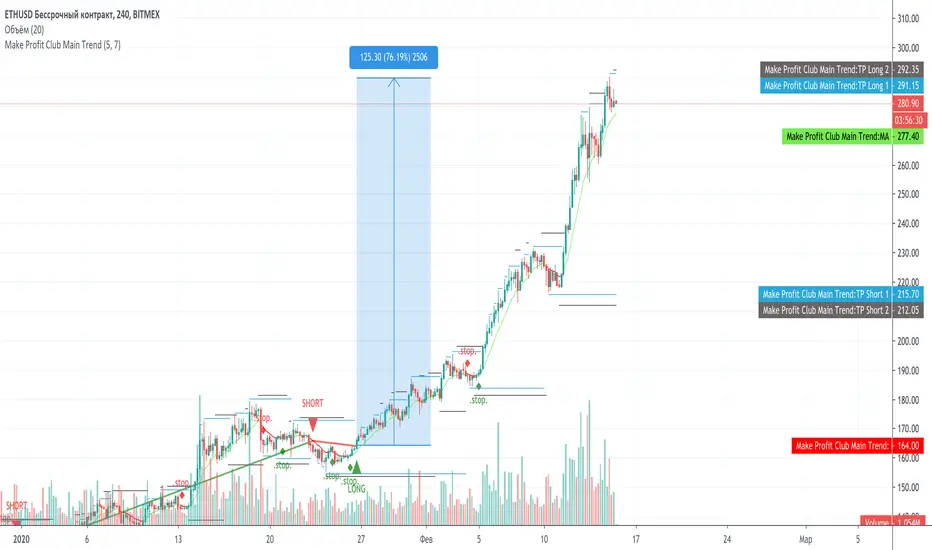
Make Profit Club Main TrendThe main trend indicator.
Suitable for 1H-1D, on any exchange and on any coin, currency pair, index.
There are basic settings that allow you to adjust the indicator individually for each situation.
Shade a particular timeframeI couldn't find a script that shades a particular timeframe so I created one where you can adjust the times, colors, and transparency. Pretty simple but nice if you just want to trade before or after certain times. Only issue is it seems to default to Eastern times. Lucky you if you are on the east coast of the USA! Everyone else add or subtract from that timeframe.

Multi Timeframe Bollinger BandsMulti Timeframe Bollinger Bands:
This script calculates and displays the Bollinger Bands for three different timeframes. The timeframes, moving averages and sigma values can be adjusted to personal likings. I publish this with an open visibility, feel free to tinker with it or suggest improvements.
Enjoy,
s0ullight

Multiple EMAs with marked zones and custom timeframe supportThis script plots 10 exponential moving averages and marks the areas between them.
The lengths are Fibonacci numbers starting from 5 and ending with 377.
The colors indicate the length of the moving average, green for the shortest and purple for the longest.
The zones between consecutive EMA's (e.g. 5 and 8 ema ) are market according to the color of the greater one in value.
By default the script plots values for the current time frame, but supports custom time frames.
I'm releasing this script with an open visibility. Feel free to suggest improvements!
Enjoy,
s0ullight

Divergences multi timeframeMT div monitor, add your own input for divs under expressions. Add them to the original bulldivs or beardivs with +. Set div_threshold in inputs.

Multi-Timeframe Stochs by Tom L.I find it really usefull. Can put 4 different timeframes.
Thanks again to Tom !
PMA4LIFE
RAF3x

Custom Timeframe Indicators(MA,EMA,BB) [CryptoProSignal]This is a combination of 3 types of indicators :
1) Simple Moving Average
2) Exponential Moving Average
3) Bollinger Band
Idea is to plot any of the above indicator with a particular period length from a different timeframe to the timeframe on which you are currently working.
eg : As shown in the chart we have indicator plots from daily timeframe plotted/shown on the current 4hr time frame .
Similarly, you can have indicator plots from 4hr timeframe to be shown on any other timeframe and so on.
Basically you can select plots from any timeframe to work with on any other timeframe of your liking .
Not a rocket science, just play around with it and you will understand :)
