Dynamic 15-Ticker Multi-Symbol Table 2025 EditionTitle:
Dynamic 15-Ticker Multi-Symbol Table 2025 Edition
Description:
This script provides a multi-ticker table for TradingView charts. It is fully open-source and free to use. The table displays up to 15 tickers, including SPY as the baseline symbol. The script updates in real-time on any timeframe.
Features:
SPY baseline: The first row always shows SPY for reference.
Custom tickers: Add up to 14 additional tickers via the input settings. Rows without tickers remain hidden.
Price and direction: Each ticker row displays the current price and an indicator of direction based on recent price movement.
RSI (14) indicator: Shows the current relative strength index value with a simple directional marker.
Volume formatting: Displays volume values in thousands, millions, or billions automatically. Volume change is indicated with directional markers.
Stable layout: The table uses alternating row colors for readability and maintains consistent row count without collapsing or disappearing rows.
Real-time updates: All displayed values refresh automatically on any chart timeframe.
How to use:
Add the script to your chart.
Enter your chosen tickers in the input settings. SPY will remain as the first ticker automatically.
Tickers not entered will remain hidden. When a ticker is removed, the row will be removed-dynamically.
Observe live prices, RSI values, and volume changes directly on your chart without switching symbols.
Additional notes:
The script is fully open-source; users are encouraged to modify or improve it.
No external links or references are required to understand its function.
This script does not repaint and does not require additional requests to update values.
Ticker

LE ScannerGENERAL OVERVIEW:
The LE Scanner is a multi-ticker dashboard that scans up to 20 tickers in real time and displays their current trend, price, volume, and key level conditions directly on your chart. It tracks how each ticker interacts with both the Previous Day’s High/Low (PDH/PDL) and Pre-Market High/Low (PMH/PML) to determine whether price is breaking above, below, or remaining inside those levels. The indicator automatically classifies each ticker as Bullish, Bearish, or Neutral based on these break conditions.
This indicator was developed by Flux Charts in collaboration with Ellis Dillinger (Ellydtrades).
What is the purpose of the indicator?:
The LE Scanner helps traders keep track of up to 20 tickers at once without switching between charts. It puts all the key information in one place, including price, daily percentage change, volume, and how each ticker is reacting around the previous day’s and pre-market highs and lows. The layout is simple and easy to read, with progress bars that show where price is relative to those levels. The goal is to save time and make it easier to understand market strength and weakness across your watchlist.
What’s the theory behind the indicator?:
The LE Scanner is built around the idea that key levels define bias. The previous day’s high and low show where the market traded most actively during the prior session, and the pre-market range reveals how price behaved before the open. When a ticker breaks both the previous day’s high and the pre-market high, it shows that buyers are in control. When it breaks both the previous day’s low and the pre-market low, sellers are in control. If neither side has full control, the bias is seen as neutral.
LE SCANNER FEATURES:
Multi-Ticker Dashboard
Key Level Tracking
Trend Classification
Sorting
Customization
Multi-Ticker Dashboard:
The LE Scanner can monitor up to 20 tickers at the same time. Each ticker has its own row in the dashboard showing:
Ticker Name
Current Price
Volume
Daily % Change
PDH Break
PDL Break
PMH Break
PML Break
Trend (bullish, bearish, or neutral)
You can enable or disable each ticker individually, so if you only want to track 5 or 10 tickers, you can simply toggle the rest off. Each ticker input lets you type in any valid ticker that’s available on TradingView.
Ticker Name:
Shows the ticker you selected in your input settings
Current Price:
Displays the latest price of that ticker based on your chart’s selected timeframe.
Volume:
Tracks the total trading volume for the current session.
Daily % Change:
Measures how much price has moved since the previous session’s close.
The remaining elements of the dashboard are explained in full detail throughout the remaining sections of this write-up.
Key Level Tracking:
The core of the LE Scanner is its ability to track and visualize how price interacts with four key levels for every ticker:
Previous Day High (PDH)
Previous Day Low (PDL)
Pre-Market High (PMH)
Pre-Market Low (PML)
These levels are updated automatically and compared to the current market price for each ticker inputted into the indicator. They show you whether the market is staying inside yesterday’s range or expanding beyond it.
🔹Previous Day High (PDH) & Previous Day Low (PDL)
The Previous Day High (PDH) marks where price reached its highest point during the last full trading session, while the Previous Day Low (PDL) marks the lowest point. Together, they define the previous day’s range and help traders understand where price is trading relative to that prior structure.
When the current price of a user-selected ticker moves above the PDH, it signals that buyers are taking control and that the ticker is now trading above yesterday’s range. In the dashboard, this change triggers a 🟢 icon under the “PDH Break” column. Once the PDH Break is confirmed, the opposite PDL Break column for that same ticker becomes blank.
When the current price of the user-selected ticker moves below the PDL, it shows that sellers are taking control and that the ticker is trading below yesterday’s range. In the dashboard, this change triggers a 🔴 icon under the “PDL Break” column. Once the PDL Break is confirmed, the opposite PDH Break column for that same ticker becomes blank.
🔹 Pre-Market High (PMH) & Pre-Market Low (PML)
The Pre-Market High (PMH) and Pre-Market Low (PML) show where price reached its highest and lowest points before the main trading session begins. On most U.S. exchanges, the pre-market session is from 4:00 AM to 9:29 AM Eastern Standard Time (EST), just before the New York session opens at 9:30 AM EST. These levels are important because they reflect how traders positioned themselves during the early morning hours. Many traders use the pre-market session to react to overnight news. The PMH and PML outline that entire pre-market range, showing where buyers and sellers fought for control and where the early balance between the two sides was established before the market opens.
When the current price of a ticker moves above the Pre-Market High, it means buyers are in control and that price has pushed through the top of the pre-market range. In the dashboard, this triggers a 🟢 icon under the “PMH Break” column. Once this break is confirmed, the opposite PML Break column for that ticker becomes blank.
When the current price moves below the Pre-Market Low, it means sellers are in control and that price has fallen beneath the pre-market range. In the dashboard, this triggers a 🔴 icon under the “PML Break” column. Once a PML Break is confirmed, the opposite PMH Break column for that ticker becomes blank.
🔹Progress Bars
The LE Scanner indicator includes progress bars that show how far the current price is from key levels.
When price is between the Previous Day High (PDH) and Previous Day Low (PDL), the progress bar measures price’s distance relative to those two points.
When price is between the Pre-Market High (PMH) and Pre-Market Low (PML), the bar tracks how far price is from those pre-market boundaries.
The closer price gets to either side, the more the bar fills, giving you a quick visual sense of how close a breakout or breakdown might be. A bar that’s nearly full means price is approaching one of the levels, while a shorter bar means it’s still far away from it. By seeing this relationship directly in the dashboard, you can see which tickers are getting ready to test key levels without flipping through multiple charts.
🔹PDH Progress Bar
The PDH progress bar measures how close price is to breaking above the previous day’s high.
When the bar is nearly full, it means the current price is trading just below yesterday’s high.
When the bar is low or mostly empty, it means price is far from the PDH and trading near the middle or lower end of the previous day’s range.
Once price breaks above the PDH, the progress bar is replaced with a green confirmation icon in the PDH Break column.
🔹Previous Day Low (PDL) Progress Bar
The PDL progress bar measures how close price is to breaking below the previous day’s low.
When the bar is nearly full, it means the current price is trading just above yesterday’s low.
When the bar is low or mostly empty, it means price is far from the PDL and trading near the middle or upper end of the previous day’s range.
Once price breaks below the PDL, the progress bar is replaced with a red confirmation icon in the PDL Break column.
🔹Pre-Market High (PMH) Progress Bar
The PMH progress bar shows how close price is to breaking above the pre-market high.
When the bar is nearly full, it means the current price is trading just below the pre-market high.
When the bar is low or mostly empty, it means price is far from the PMH and trading near the middle or lower end of the pre-market range.
Once price breaks above the PMH, the progress bar is replaced with a green confirmation icon in the PMH Break column.
🔹Pre-Market Low (PML) Progress Bar
The PML progress bar shows how close price is to breaking below the pre-market low.
When the bar is nearly full, it means the current price is trading just above the pre-market low.
When the bar is low or mostly empty, it means price is far from the PML and trading near the middle or upper end of the pre-market range.
Once price breaks below the PML, the progress bar is replaced with a red confirmation icon in the PML Break column.
Trend Classification:
The LE Scanner automatically classifies each user-inputted ticker as bullish, bearish, or neutral based on how price is interacting with its key levels.
Each trend type follows a specific set of conditions and is displayed in its own column under Trend on the dashboard.
🔹 Bullish Trend
A bullish trend occurs when price has broken above both the Previous Day High (PDH) and the Pre-Market High (PMH). This shows that buyers are in full control and that the ticker is trading firmly above the prior session’s and pre-market range.
When this condition is met, the Trend column displays a green background with an upward-facing triangle icon (▲).
🔹 Bearish Trend
A bearish trend occurs when price has broken below both the Previous Day Low (PDL) and the Pre-Market Low (PML). This indicates that sellers are in control and that the ticker is trading firmly below the prior session’s and pre-market range.
When this happens, the Trend column switches to a red background with a downward-facing triangle icon (▼).
🔹 Neutral Trend
A neutral trend occurs when price is trading inside the range, meaning it hasn’t broken above the PDH/PMH or below the PDL/PML. This indicates that neither bulls nor bears has clear control, and the ticker is consolidating between the prior session’s and pre-market range.
When this condition is active, the Trend column appears with a warning sign icon (⚠️). This helps distinguish tickers that are still forming setups from those that have already shown decisive strength or weakness.
Sorting:
The LE Scanner includes a built-in sorting feature that lets you reorder the dashboard in either descending or ascending order based on one of four metrics:
% Change
Volume
Price
Trend
Sorting is handled directly in the indicator settings, where you can toggle “Sort By” and then select your preferred Sort By criteria and Order (Ascending or Descending). When enabled, the dashboard automatically repositions every ticker to match the selected sorting method.
🔹 % Change Sorting
When you sort by % Change, the dashboard ranks tickers based on their daily percentage movement relative to the previous session’s close.
If you choose descending order, the biggest gainers appear at the top.
If you choose ascending order, the biggest decliners appear at the top.
🔹 Volume Sorting
When you sort by Volume, the dashboard arranges tickers based on their total traded volume for the current session.
If you choose descending order, the highest-volume tickers appear at the top.
If you choose ascending order, the lowest-volume tickers appear at the top.
🔹 Price Sorting
When you sort by Price, the dashboard arranges tickers by their current market price.
If you choose descending order, the highest-priced tickers appear at the top.
If you choose ascending order, the lowest-priced tickers appear at the top.
🔹 Trend Sorting
When you sort by Trend, the dashboard organizes tickers based on their directional classification.
If you choose descending order, bullish tickers appear first, followed by neutral and bearish.
If you choose ascending order, bearish tickers appear first, followed by neutral and bullish.
Customization:
The LE Scanner includes several settings that let you customize how the dashboard appears on your chart. All visual and positional elements can be adjusted to fit your personal layout preferences.
🔹 Dashboard Position
You can move the dashboard anywhere on your chart using the “Table Position” setting. Options include:
Bottom-Center
Bottom-Left
Bottom-Right
Middle-Center
Middle-Left
Middle-Right
Top-Center
Top-Left
Top-Right
🔹 Dashboard Size
The dashboard size can be adjusted to be larger or smaller. Users can choose between the following options:
Tiny
Small
Normal
Large
Huge
🔹 Color Customization
All color elements in the dashboard are customizable. You can change the following:
Background Color
Border Color
Frame Color
Text Color
Bullish Trend Color
Bearish Trend Color
Important Notes:
Because the LE Scanner tracks multiple tickers and updates all data in real time, it performs several background calculations at once. On rare occasions, this can cause the following issue:
Computation Error:
Scanning up to 20 tickers at the same time requires multiple request.security() calls. This process is resource-intensive and can sometimes trigger a calculation timeout message in TradingView. If this occurs, simply force the indicator to refresh by changing one of its settings (for example, toggling a ticker off and back on) or by removing and re-adding the indicator to your chart.
Uniqueness:
The LE Scanner is unique because it combines real-time multi-ticker tracking, sortable data, and visual feedback into one tool. It can track up to 20 tickers simultaneously, automatically sort them by % change, volume, price, or trend. The built-in progress bars provide a clear visual of how close price is to breaking key levels, while the trend classification instantly shows whether each ticker is bullish, bearish, or neutral.

Name of tickerDescription:
This indicator displays the instrument’s ticker symbol and the current chart timeframe at the top center of the chart.
Features:
• Shows the ticker (e.g., BTCUSDT, AAPL, etc.).
• Displays the current timeframe (1m, 5m, 1H, 1D, etc.).
• Positioned at the top center of the chart for easy reference.
• Transparent background for minimal interference with price action.
• Lightweight and simple, no extra settings required.
Usage:
• Works with any instrument: stocks, crypto, futures.
• Useful for traders who want to always see the ticker and timeframe while analyzing the chart.
Settings:
• Text size can be adjusted in the script (text_size).
• Text and background colors can be customized (text_color, bgcolor).


IDX Utility Set [zidaniee]Purpose
This indicator is not a technical analysis tool. It’s a companion overlay designed to guide your analysis of the uniquely structured Indonesia Stock Exchange (IDX).
Core Features
Centered Ticker Display – Clean, readable ticker shown at the center of the chart.
Company Name – Displays the listed company’s full name.
Active Timeframe – Shows the currently selected timeframe.
Additional Features
ATH & ATL Markers – Labels the All-Time High (ATH) and All-Time Low (ATL) and shows the percentage distance from the latest price to each level, so you can quickly gauge upside/downside room.
IDX Fraction (Tick) Levels – Visualizes Indonesia’s price-fraction (tick) brackets. This matters because tick size changes by price range—very useful for scalpers and fast traders.
ARA/ARB Levels (Realtime) – Plots Auto-Reject Upper (ARA) and Auto-Reject Lower (ARB) levels in real time. Levels refresh in line with IDX trading hours 09:00–16:00 WIB (UTC+7), so your view stays consistent both during and outside market hours. This feature already complies with the latest rules and adjustments set by the Indonesia Stock Exchange (IDX).
Suspension Status – Shows SUSPENDED if the stock is halted/suspended, helping you avoid unnecessary analysis. The suspension check compares today’s date with the last available candle date and accounts for weekends.
Note: WIB = Western Indonesia Time (UTC+7).

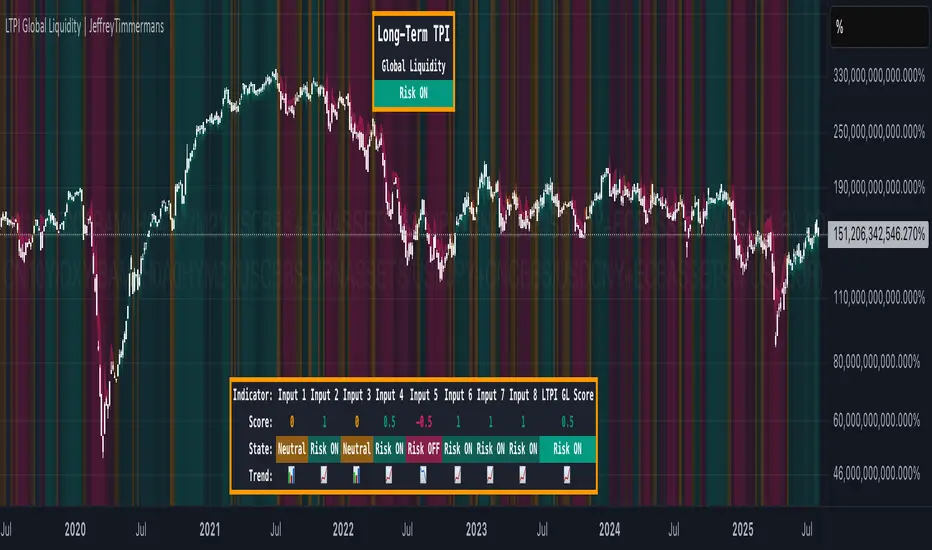
LTPI Global Liquidity | JeffreyTimmermansLong-Term Probability Indicator (LTPI)
The "Long-Term Probability Indicator (LTPI)" on a generic liquidity ticker is a custom-built analytical tool designed to evaluate market conditions over a long-term horizon, with a strong focus on global liquidity trends. By combining six carefully selected input signals into a single probability score, this indicator helps traders and analysts identify prevailing long-term market states: Bullish, Bearish, or Neutral.
Where short-term systems/timeframes react quickly to price fluctuations, LTPI smooths out noise and focuses on the bigger picture, allowing for informed strategic decision-making rather than short-term speculation.
Key Features
Multi-Input Aggregation:
Uses six independent inputs, each based on long-term liquidity and macro-related data, to generate a composite market probability score.
Long-Term Focus:
Prioritizes medium-to-long-term trends, ignoring smaller fluctuations that often mislead traders in volatile markets.
Simplified Market States:
Classifies the global market into three primary states:
Bullish: Favorable liquidity and conditions for long-term risk-taking.
Bearish: Tightening liquidity and conditions that require caution.
Neutral: Transitional phases or uncertain conditions.
Background Coloring:
Visual cues on the chart help identify which regime is active at a glance.
Global Liquidity Perspective:
Designed for use on a generic liquidity ticker, based on M2 money supply, to track macroeconomic liquidity flows and risk appetite.
Dashboard Display:
A compact on-screen table summarizes all six inputs, their states, and the resulting LTPI score.
Dynamic Alerts:
Real-time alerts signal when the LTPI shifts from one regime to another.
Inputs & Settings
LTPI Inputs:
Input Sources (6): Each input is a carefully chosen trend following indicator.
Weighting: Each input contributes equally to the final score.
Score Calculation:
Bullish = +1
Bearish = -1
Neutral = 0
Color Settings:
Strong Bullish: Bright Green
Weak Bullish: Light Green
Neutral: Gray/Orange
Weak Bearish: Light Red
Strong Bearish: Bright Red
(Colors can be customized.)
Calculation Process
Collect Data:
Six long-term inputs are evaluated at each bar.
Scoring:
Each input’s state contributes +1 (bullish), -1 (bearish), or around 0 (neutral).
Aggregate Probability:
The LTPI Score is calculated as the sum of all six scores divided by 6, resulting in a value between -1 and +1.
Market Classification:
Score > 0.1: Bullish regime
Score < -0.1: Bearish regime
-0.1 ≤ Score ≤ 0.1: Neutral
Background Coloring:
Background colors are applied to highlight the current regime.
How to Use LTPI
Strategic Positioning:
Bullish: Favor holding or adding to long-term positions.
Bearish: Reduce risk, protect capital.
Neutral: Wait for confirmation before making significant moves.
Confirmation Tool:
LTPI works best when combined with shorter-term indicators like MTPI or trend-following tools to confirm alignment across multiple timeframes.
Dynamic Alerts:
Bullish Regime Entry: When the LTPI Score crosses above 0.1.
Bearish Regime Entry: When the LTPI Score crosses below -0.1.
Neutral Zone: When the score moves back between -0.1 and 0.1.
These alerts help identify significant macro-driven shifts in market conditions.
Conclusion
The Long-Term Probability Indicator (LTPI) is an advanced, liquidity-focused tool for identifying macro-driven market phases. By consolidating six inputs into a single probability score and presenting the results visually, LTPI helps long-term investors and analysts stay aligned with global liquidity trends and avoid being distracted by short-term volatility.
Watermark by HAZEDEnhanced Watermark - Clean Chart Labeling
A professional watermark indicator for traders who want clean, customizable chart identification.
Features:
- Show/hide: Exchange prefix, timeframe, price change %, volume
- 9 positioning options - place anywhere on your chart
- Custom text styling - normal or spaced text modes
- Full color control - including transparency settings
- Size customization - independent sizing for each element
- Personal signature - add your trading brand
- Custom symbols - personalize arrows and indicators
Perfect for:
Content creators, educational posts, professional setups, and social media sharing.
Easy to use: Works immediately with smart defaults. Fully customizable to match your style.
Clean charts, professional presentation.

Ticker DataThis script mostly for Pine coders but may be useful for regular users too.
I often find myself needing quick access to certain information about a ticker — like its full ticker name, mintick, last bar index and so on. Usually, I write a few lines of code just to display this info and check it.
Today I got tired of doing that manually, so I created a small script that shows the most essential data in one place. I also added a few extra fields that might be useful or interesting to regular users.
Description for regular users (from Pine Script Reference Manual)
tickerid - full ticker name
description - description for the current symbol
industry - the industry of the symbol. Example: "Internet Software/Services", "Packaged software", "Integrated Oil", "Motor Vehicles", etc.
country - the two-letter code of the country where the symbol is traded
sector - the sector of the symbol. Example: "Electronic Technology", "Technology services", "Energy Minerals", "Consumer Durables", etc.
session - session type (regular or extended)
timezone - timezone of the exchange of the chart
type - the type of market the symbol belongs to. Example: "stock", "fund", "index", "forex", "futures", "spread", "economic", "fundamental", "crypto".
volumetype - volume type of the current symbol.
mincontract - the smallest amount of the current symbol that can be traded
mintick - min tick value for the current symbol (the smallest increment between a symbol's price movements)
pointvalue - point value for the current symbol
pricescale - a whole number used to calculate mintick (usually (when minmove is 1), it shows the resolution — how many decimal places the price has. For example, a pricescale 100 means the price will have two decimal places - 1 / 100 = 0.01)
bar index - last bar index (if add 1 (because indexes starts from 0) it will shows how many bars available to you on the chart)
If you need some more information at table feel free to leave a comment.

BB Context PanelThe BB Context Panel indicator is designed to provide a customizable and informative overlay on your chart. It offers key contextual details to enhance your trading experience by combining essential market data, user-defined messages, and time-based insights in an easily accessible panel. Whether you use it for quick reference, sharing screenshots, or maintaining focus with motivational reminders, this tool adapts to your unique trading needs.
Key Features
1. Futures Contract Tracking:
• Automatically displays the current or nearest futures contract (e.g., MNQH5), including support for continuous contracts.
• Adjusts dynamically based on the quarterly roll schedule (March, June, September, December).
2. Time and Date Display:
• Choose to display either:
• Bar Time: Reflects the timestamp of the most recent bar.
• Current Time: Updates in real time based on your selected timezone.
• Formats the timestamp as hh:mm Day mm-dd-yy for easy readability.
3. Custom User Messages:
• Add personalized messages, motivational reminders, or trading affirmations (e.g., “Patience | Discipline | Confidence”).
• Supports multiline messages for greater customization.
4. Customizable Placement:
• Select from multiple placement options (e.g., Top Right, Bottom Left, etc.) to integrate seamlessly with your chart layout.
5. Time Zone Support:
• Supports a wide range of global time zones, ensuring accurate time synchronization based on your location or trading session preferences.
6. Clean and Minimalist Design:
• Aesthetic panel with customizable text and background colors for better integration with your chart theme.
• Bolded key information like contract symbols and timeframes for quick recognition.
How to Use
1. Enable the Context Panel:
• Select a location for the panel using the Show Chart Context Panel? setting (e.g., Top Right).
2. Choose Time Display:
• Decide whether to show Bar Time, Current Time, or disable the time display entirely (None).
3. Add Custom Messages:
• Use the Panel Message input to add motivational reminders, strategy notes, or any text you’d like to see during your trading sessions.
4. Set Your Time Zone:
• Configure the time zone using the Select Timezone dropdown to ensure time data aligns with your trading hours.
Example Use Cases
1. Screenshot-Friendly Context:
• Capture annotated screenshots with clear context, including contract symbol, timeframe, timestamp, and reminders.
2. Quick Market Overview:
• Use the panel to stay informed about the current futures contract and trading session details without cluttering your chart.
3. Trading Psychology Support:
• Display affirmations like “Patience | Discipline | Confidence” to help maintain focus and emotional discipline while trading.

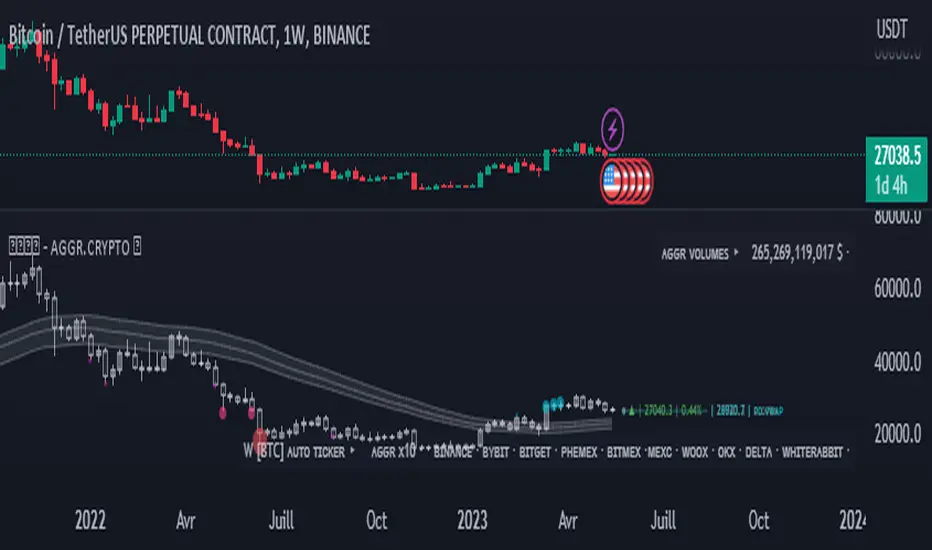
Opal - Aggr.Crypto█ OVERVIEW
The Multi-Exchange Crypto Aggregator is a unique concept ticker that gathers up to 10 tickers into one. A new OPAL Chart is created as an indicator, with its own candles and information. This information is meant to be interpreted as average information in order to reduce noise from a single ticker only. Everything is automated between assets. Our script will always check and ensure that data is received for calculations; otherwise, invalid tickers are ignored. This version is designed for Crypto Perpetual markets.
█ HOW DATA SLIPPAGE/DIFFERENCE IMPACT NOISE
This new average ticker aims to reduce noise in your candles and their live movements, avoiding most of the minor/last-second spikes, especially when they don't happen on every desired exchange at the same time. Our candles have different behaviors and highlight close-open slippage/gaps, as it seems to provide a strong reaction. Those gaps represent average slippage.
█ HOW TO USE
This should help you visualize market behaviors. Volume pressures are the origin of a lot of misunderstood things. Data analysis and observations show that makers target liquidity on both sides. Time and sessions have their own logic and will always need experience, as it is basically a gigantic Tetris game. Anyway, this should help with timing confirmations or bring confidence.
█ FEATURES
Aggregated (Tickers) Candles ▸ Aggregated OHLC candles, the idea behind the script. Set desired tickers to automate in settings. Value and Var% are displayed right next to the current candle.
Aggr. Dynamics/Levels ▸ Plot some strong levels as landmarks calculated on modified price, from Volume Weighted Average Price (VWAP) to Daily aggregated Open Price. The previous day's key level is included.
Aggr. Data Markers ▸ Plot some key markers on the chart, such as Open Pressure gaps, or estimated 3-scale liquidation bubbles with 2 confirmation modes (using different filters).
Aggr. Averages ▸ Plot up to 3 averages or HLC channels for visual ease.
█ SIGN
All of our contents are shared for educational purposes only.
Wishing you success;
OPAL - Strive for Greatness
composite_ticker_cleanerLibrary "composite_ticker_cleaner"
Extract a clean symbol from a composite ticker. E.g., (BINANCE:BTCUSD+KRAKEN:BTCUSD)/2 as input will return BTCUSD or BINANCE:BTCUSD
composite_ticker_cleaner_extract_first(symbol, keepexchange)
Extract the first symbol out of the supplied string (usually ticker.standard(syminfo.tickerid) )
Parameters:
symbol : string input string to search in
keepexchange : bool (optional) Keep exchange in the returned ticker? By default, we only return the symbol without the exchange.
Returns: first occurrence of a symbol
composite_ticker_cleaner_extract_first(keepexchange)
Extract the first symbol out of the current tickerid (as provided by ticker.standard(syminfo.tickerid) )
Parameters:
keepexchange : bool (optional) Keep exchange in the returned ticker? By default, we only return the symbol without the exchange.
Returns: first occurrence of a symbol in the current tickerid
This is inspired by the work I did on this indicator:
I needed a similar functionality in another script, so instead of duplicating code, I thought generalizing the process in a library could be helpful for me and others, and will be easier to maintain and upgrade with new features if I need to.

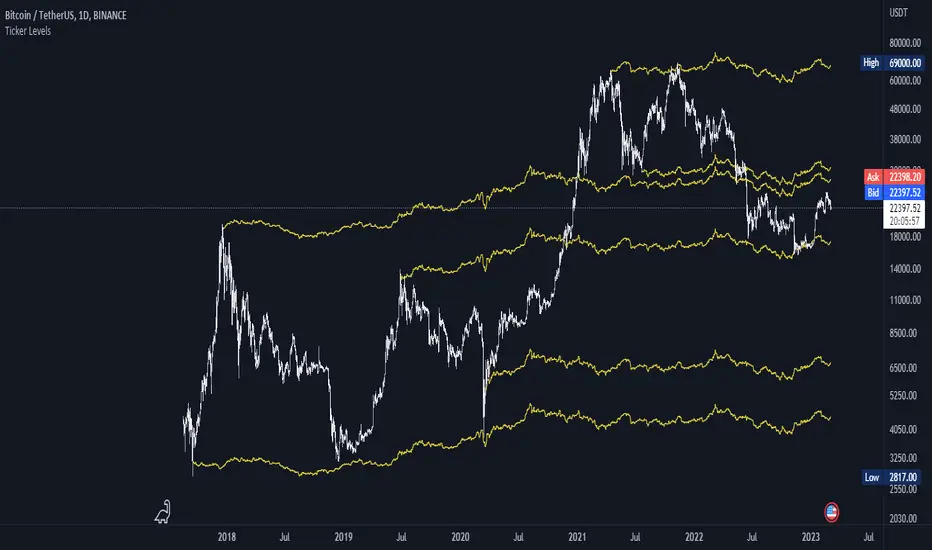
Ticker Ratio LevelsIndicator for constructing levels of price ratios from other tickers.
The user can choose from predefined tickers such as Gold(XAU), DXY, BTC, etc.
How it works:
Takes the important extremum of the closing candle from your current chart and builds a level based on the chart selected in the settings.
This function allows you to determine the price level based on the current price and the price at the time of a certain date. To do this, it first determines the time when the last candle before the specified date occurred. Then the price at the time of this candle and at the current moment is calculated. Finally, the price level is calculated relative to the price at the time of the candle. The result of this calculation will be the price level.
How to Use:
By default, the indicator is set to 1D for the BTC chart. But you can adjust any levels on the assets you are interested in.
You can adjust the levels both in the settings and by moving them around the chart.
Simply click on the indicator name or level, and vertical lines will appear, which you can drag to any location. (The vertical lines serve as the beginning of the calculation point)
Example of work on ETH paired with DXY.
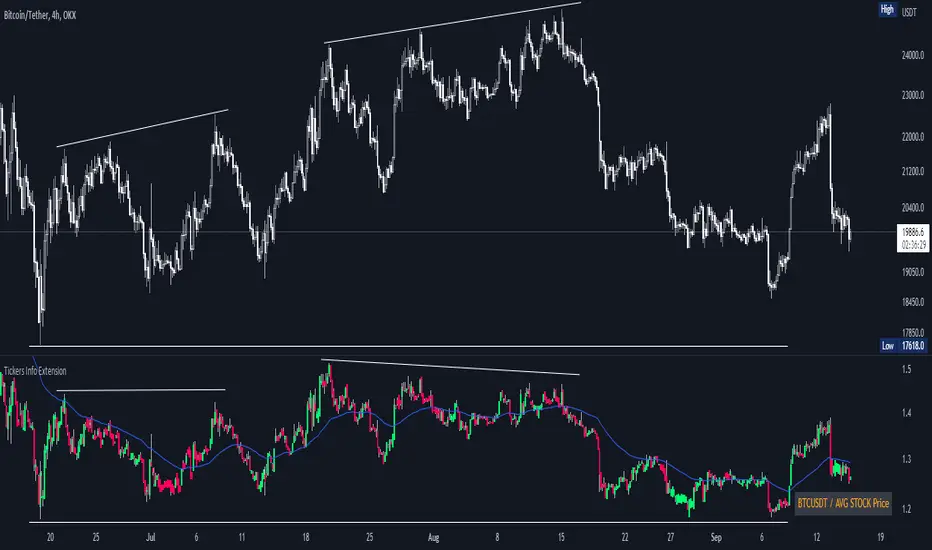
Tickers Info ExtensionWith the indicator you can easily evaluate or compare any ticker with the one you choose in the options.
You can choose any of the tickers I provide in the mod options to your liking :
XAU
DXY
BTC
ETH
SPX
NASDAQ
AVG Stable Dominance
AVG Stock Price
Custom
You can also select or create your own ticker if you select the Custom in Mode option.
If the Compare mode is enabled, then the current ticker you are viewing is divided by the ticker selected in the indicator (in the Mode option).
Thus, you create a new pair and can evaluate the strength of this or that asset.
For example, if you have the ticker BTCUSDT open. And the ticker XAU is selected in the Mode option in the indicator. And the Compare mode is also enabled. Then you will get a new BTCUSDT/XAU pair. That means that now you can see the bitcoin/gold ratio. (Same as EUR/USD etc.)
If the Compare option is switched off then you will see the usual ticker you choose in the Mode option. You can also see if there is a correlation between the selected pairs.
Option ' AVG STABLE.D ' = Calculated as: USDT.D + USDC.D + DAI.D
- This is the average domination of the most important Stable Coins
Option ' AVG STOCK Price ' = Calculated as: (DJI + SPX + NDQ) / 3
- This is the average price of the most important Indexes.
Symbol InfoFor those who likes clean chart:
Adjustable Symbol ticker and timeframe( AKA watermark) script is here.
1: You can place Symbol ticker and timeframe info anywhere on the chart.
Also you can hide one of them or both.
Position:
Horizontal options: Left Center Right
Vertical options: Top Middle Bottom
Size: Tiny Smal Normal Large Huge Auto
Color is adjustable. Background is optional too.
2: Even more cool part is you can add 2 different custom texts that can switch. (Idea from Pinecoders original script)
You don't have to use text function and reposition it everytime, your message will always stays at one place.
Let the chart deliver your message.
I put my favourite trading slangs there:
1. Do Your Own Research (DYOR)
2. Not a Financial Advice ( NFA)

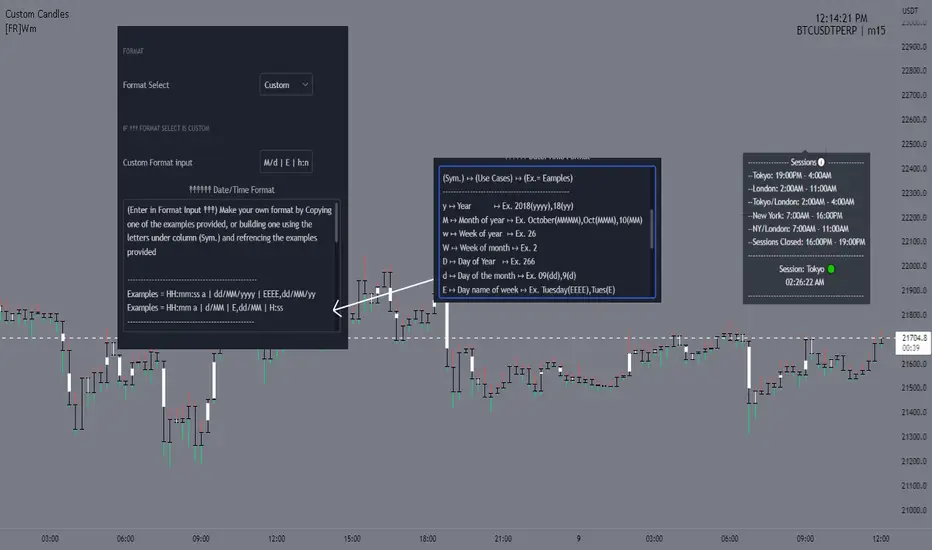
[FR]WmThis a water mark that uses a table to allow placement at 9 different locations on the screen
you can either pick on of the given Date and time formats or you can choose custom and build your own
One of the reasons for this project I wanted to be able to add the "s,m,h" to the water marks timeframe not have i.e. "240" and have it say 4h..
you can select what format for the dates from in the settings if the user selects custom it will make it so you can input what ever format
string into the input box "Custom Format input'"
Hope You Enjoy!
FFriZz
MultiAlert LITEAllows one to set 5 price level alerts on one symbol (1 Stop Loss 4 Targets)
Alerts work by prices crosses under the stop loss or over the targets, enabling short reverses this.
Unlike regular MultiAlert, this actually draws a true horizontal price at your price.
This is a lighter version of MultiAlert, supporting only one symbol. Your price levels will appear on all charts unless you hide the indicator.
Make the alert with targets and stop loss set, every time you make a change you MUST REMAKE THE ALERT.
Please comment any problems .

Ticker Info FYTicker Info for Companies FY
Currently including:
-> Market Cap
-> Enterprise Value
-> Total Shares Outstanding
-> Number of Employees
-> P/E Ratio
-> P/R Ratio
-> P/B Ratio
More information attributes for companies will be added as updates in the future.
Leave a like to keep this going!


Supertrend Screener PanelScript to display Supertrend trend state of 8 different securities in a panel. Timeframe & Tickers which are to be displayed can be configured from settings.
Part of code is from the ADX DI Monitoring Panel script by u/wugamlo with his permission. Thanks to him for that and do please check out his work also.

Monthly MA Close Generates buy or sell signal if monthly candle closes above or below the signal MA.
Long positions only.
Inputs:
-Change timeframe MA
-Change period MA
-Use SMA or EMA
-Display MA
-Use another ticker as signal
-Select time period for backtesting
This script is not necessarily written to maximize profits, but to minimize losses.
Although it can outperform 'Buy & Hold' on some occasions when there is a multiple month bearisch trend.
You can optimise this strategy by changing the signal MA inputs.
I would suggest aiming for the best Profit Factor starting from the monthly ("M") setting.
You can always fine-tune the results at a lower timeframe.
The option to use another ticker for providing signals can give you a more stable and unified results.
For example using AMEX:SPY as signal with default parameters gives better results with NASDAQ:AAPL than if you would use NASDAQ:AAPL itself.
I used the anti-repainting function from PineCoders to prevent repainting.
This script is best used for multi-month trading positions & Daily or 4H setting of your chart.

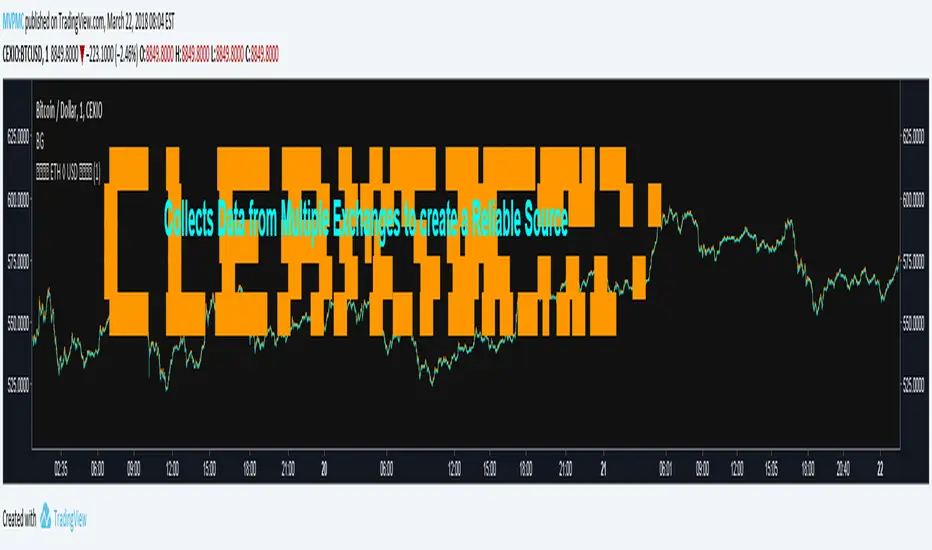
CMYK CLEANSIGNAL ETHUSD ◊ Introduction
This is CLEANSIGNAL
A script that combines Ticker data from multiple exchanges to create a more reliable source.
◊ Origin
This is a part of Project XIAM.
◊ Theoretical Approach
Philosophy a :: Cleansignal
◊ Usage
This is a source script intended to replace your current ticker.
You can apply Indicators on this script , just select the source in their settings.
My own indicators will be updated soon, to include source selection in their settings.
◊ Features
Close / High / Low / Volume data from 10 exchanges !
BITFINEX ◊ BITSTAMP ◊ COINBASE ◊ CEXIO ◊ WEX ◊ HITBTC ◊ GEMINI ◊ POLONIEX ◊ OKCOIN ◊ KRAKEN
◊ Community
Wanna share your findings ? or need help resolving a problem ?
CMYK :: discord.gg
AUTOVIEW :: discordapp.com
TRADINGVIEW UNOFFICIAL :: discord.gg