Market Breadth Toolkit [LuxAlgo]The Market Breadth Toolkit allows traders to use up to 6 different market breadth measures on two different exchanges, for a total of 12 different views of the market.
This toolkit includes divergence detection and allows setting custom fixed levels for traders who want to experiment with them.
🔶 USAGE
The main idea behind Breadth is to measure the number of advancing and declining issues and/or volume by exchange to have an idea of the underlying strength of the whole exchange.
On the other hand, thrusts represent big impulses in the breadth, as it is described by technicians to be the start of a new bullish trend.
By default, the Toolkit is set to "Breadth Thrust Zweig", with divergences enabled.
We will now explain all the different breadth measures available in the toolkit.
🔹 Deemer Breakaway Momentum
The "Breakaway Momentum" is a concept related to market breadth introduced by legendary technical analyst Walter Deemer.
As stated on his website:
We coined the term "breakaway momentum" in the 1970's to describe this REALLY powerful upward momentum
and:
We now know that the stock market generates breakaway momentum when the 10-day total advances on the NYSE are greater than 1.97 times the 10-day total NYSE declines OR the 20-day total advances on the NYSE are greater than 1.72 times the 20-day total NYSE declines.
As we can see in the chart above, which shows both methods, momentum is identified when the ratio of advancing issues to declining issues is greater than 1.97 for the 10-day average or 1.72 for the 20-day average.
🔹 Zweig Breadth Tools
Legendary trader and author Marting Zweig, best known as the author of "Winning on Wall Street" and the creator of the Put/Call Ratio.
In this toolkit, we feature two of his other tools:
Breadth Thrust: Number of Advancing / (Number of Advancing + Number of Declining Stocks)
Market Thrust: (Number of Advancing × Advancing Volume) — (Number of Declining Stocks × Declining Volume)
As we can see on the above chart, the Breadth Thrust printed a new signal on April 24, 2025, which is a bullish signal on the daily chart that can last several months, considering the previous signals.
On the right side, we have the Market Thrust as the delta between advancing minus declining volume weighted.
🔹 Whaley Measures
Wayne Whaley received the 2010 Charles Dow Award from the CMT Association, as stated on their website: "In 1994, the CMT Association established the Charles H. Dow Award to recognize outstanding research in technical analysis."
We include two of the tools from this paper:
Advance Decline Thrust: Number of Advancing / (Number of Advancing + Number of Declining Stocks)
Up/Down Volume Thrust Advancing Volume / (Advancing Volume + Declining Volume)
The chart above shows Thrust signals at extreme readings as described in the paper.
🔹 Divergences
The divergence detector is enabled by default, traders can disable it and fine-tune the detection length in the settings panel.
🔹 Fixed Levels
Traders can adjust the Thrust detection thresholds in the settings panel.
In the image above, we can see the Deemer Breakaway Momentum 10 with the original threshold (below) and with the 3.0 threshold (above).
🔶 SETTINGS
Breadth: Choose between 6 different breadth thrust measurement methods.
Data: Choose between NYSE or NASDAQ exchanges.
Divergences: Enable/Disable divergences and select the length detection.
🔹 Levels
Use Fixed Levels: Enable/Disable Fixed Levels.
Top Level: Select the top-level threshold.
Bottom Level: Select bottom level threshold.
Levels Style: Choose between dashed, dotted, or solid style.
🔹 Style
Breadth: Select breadth colors
Divergence: Select divergence colors
Thrust

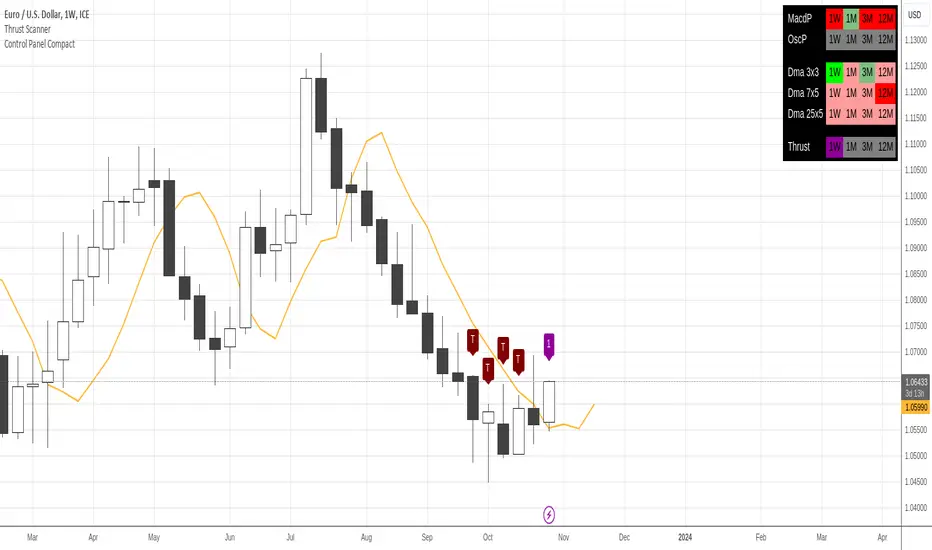
Dinapoli Thrust Scanner Multi MarketThis is the Multi-Market version of the Dinapoli Thrust Scanner. This indicator is able to scan up to 12 markets in 3 time frames simultaneously.
This tool is an aid to the trader and shouldn't be used in automated trading. As any Dinapoli trader would know, the Thrust pattern recognition requires visual approval from the trader.
The Thrust Scanner can display the following information onscreen:
A Multi-Timeframe Table that colors to indicate Recent/Current Thrusts. Green color signals a potential Up Thrusts, whilst red color signals a potential Down Thrust.
The DMA crosses get signaled with custom colors.
The Thrust Scanner has a Sensitivity Control which allows the trader to customize the accuracy of the scanner:
The stricter the setting, the lesser the number of potential Thrust that qualify, and therefore the more accurate the Thrust detection.
The looser the setting, the more number of potential Thrust being detected, but also the more Look Alikes (LaL) or false positives there will be.
Note: The scanner is resource hungry, and sometimes it might need some seconds to fully display the data.

DiNapoli Control Panel CompactThis is a compact more customizable control panel to display the overall state of Dinapoli related indicators.
This indicator displays a matrix containing a customized set of Dinapoli indicator states from Higher Timeframes. It works as a Control Panel to properly monitor multiple layers of the market at an eye glance.
It can print the multi time frame state of the following indicators:
Macd Predictor
Oscillator Predictor
Stochastic Predictor
Trusht: Its presence and state of maturity
DMAs: 3x3, 7x5 and 25x5
In order to aid a custom display, it's designed to only supply color states in multiple time frames. This one doesn't provide the value reading of the indicators.
Only Higher Timeframes states do appear in the table. Lower Timeframes are hidden due to inability to get reliable results for such behaviour in current Tradingview environment.
By default only 5 timeframes get activated: 1H, 4H, 1D, 1W and 1M. But many more are available to be displayed throught the Input Tab.
The sorting of the rows and the position of the table can be customized through the input panel.
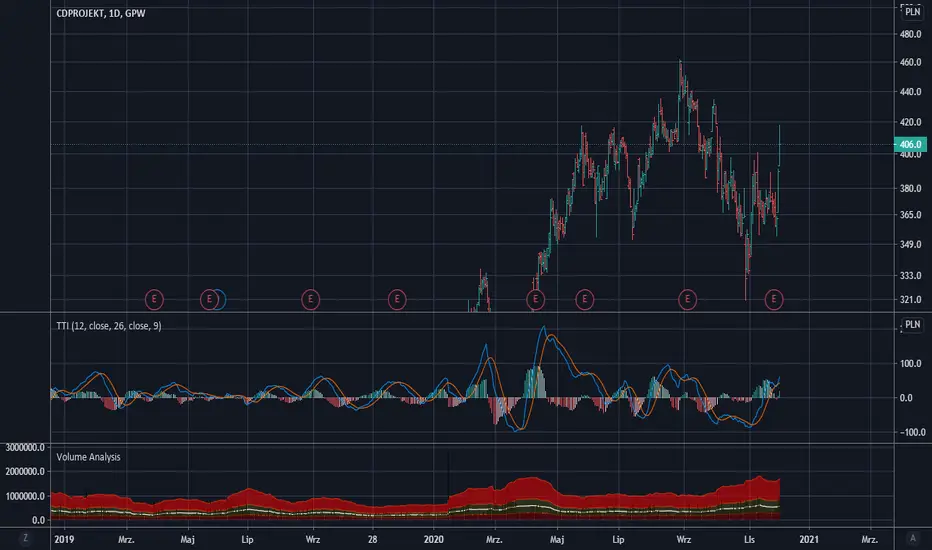
[TTI] Whaley Breadth Thrust––––History & Credit
The Whaley Breadth Trust is a powerful signal that has a great success rate. It was invented by Wayne Whaley in 2009. Since 1970 to 2009, the signal has occured only 12 times!
–––––What it does
The indicator uses 3 conditions.
Condition 1: The Advancing and Declining NYSE stocks
Condition 2: The Up and Down volume
Condition 3:The absolute price increase in the SP500
It calculates different ratios and determine bullish or bearish setting based on this.
When only conditions 1 and 2 are present, we call this a Light Thrust. When all 3 conditions have occured then we call this Full Thrust.
–––––How to use it
Consider very bullish signal when you see this.
The light thrust occured on 12JAN23 on the SPX.
The signal occured in the following years: 1974, 1982, 1987, 2002, 2008

[TTI] Ned Davis 3 day Price Thrust IndicatorThe NedDavis 3 Day Price Thrust Indicator
HISTORY AND CREDITS –––––––––––––––––––––––––––––––––––––––––––––––––––––––
The indicator is inspired by studies from Ned Davis' NDR Institutional Service. I have shared before the backtest of this indicator, and now have coded it for TradingView so that you can have it on your charts.
Link to idea here:
WHAT IT DOES ––––––––––––––––––––––––––––––––––––––––––––––––––––––––––––––
Thrusts occur when the S&P 500 rises at least 1.5% for one day, at least 1.15% for a second day, and at least 1.5% on the third day. The record since 1970 is perfect one year later. However, the prior 18 cases, ending in 1938, only show 11 out of 18 profitable one year later.
HOW TO USE IT –––––––––––––––––––––––––––––––––––––––––––––––––––––––––––––
I use the indicator as a gauge tool, in other words it is a piece of the puzzle to justify bullish or bearish trades. I put this type of analysis in my secondary tools that give me additional confidence for market direction and aggressiveness in my trading

Dinapoli Thrust ScannerThis is a Multi-Timeframe Dinapoli Thrust Scanner that works on the market displayed on screen and searches for Thrusts within this market along Higher Timeframes.
This tool is an aid to the trader and shouldn't be used in automated trading. As any Dinapoli trader would know, the Thrust pattern recognition requires visual approval from the trader.
The Thrust Scanner can display the following information onscreen:
A Multi-Timeframe Table that colors to indicate Recent/Current Thrusts. Green color signals a potential Up Thrusts, whilst red color signals a potential Down Thrust.
The DMA line that helps you trade the Thrusts according to Bread'n Butter or Double Repo patterns.
Candle Labels that point the Thrusts being detected directly on the chart.
The Thrust Scanner has a Sensitivity Control which allows the trader to customize the accuracy of the scanner://
The stricter the setting, the lesser the number of potential Thrust that qualify, and therefore the more accurate the Thrust detection.
The looser the setting, the more number of potential Thrust being detected, but also the more Look Alikes (LaL) or false positives there will be.
Note: The scanner is resource hungry, and sometimes it might need some seconds to fully display the data.

Trend Thrust Indicator - RafkaThis indicator defines the impact of volume on the volume-weighted moving average, emphasizing trends with greater volume.
What determines a security’s value? Price is the agreement to exchange despite the possible disagreement in value. Price is the conviction, emotion, and volition of investors. It is not a constant but is influenced by information, opinions, and emotions over time. Volume represents this degree of conviction and is the embodiment of information and opinions flowing through investor channels. It is the asymmetry between the volume being forced through supply (offers) and demand (bids) that facilitates price change. Quantifying the extent of asymmetry between price trends and the corresponding volume flows is a primary objective of volume analysis. Volume analysis research reveals that volume often leads price but may also be used to confirm the present price trend.
Trend thrust indicator
The trend thrust indicator (TTI), an enhanced version of the volume-weighted moving average convergence/divergence (VW-Macd) indicator, was introduced in Buff Pelz Dormeier's book 'Investing With Volume Analysis'. The TTI uses a volume multiplier in unique ways to exaggerate the impact of volume on volume-weighted moving averages. Like the VW-Macd, the TTI uses volume-weighted moving averages as opposed to exponential moving averages. Volume-weighted averages weigh closing prices proportionally to the volume traded during each time period, so the TTI gives greater emphasis to those price trends with greater volume and less emphasis to time periods with lighter volume. In the February 2001 issue of Stocks & Commodities, I showed that volume-weighted moving averages (Buff averages, or Vwmas) improve responsiveness while increasing reliability of simple moving averages.
Like the Macd and VW-Macd, the TTI calculates a spread by subtracting the short (fast) average from the long (slow) average. This spread combined with a volume multiplier creates the Buff spread
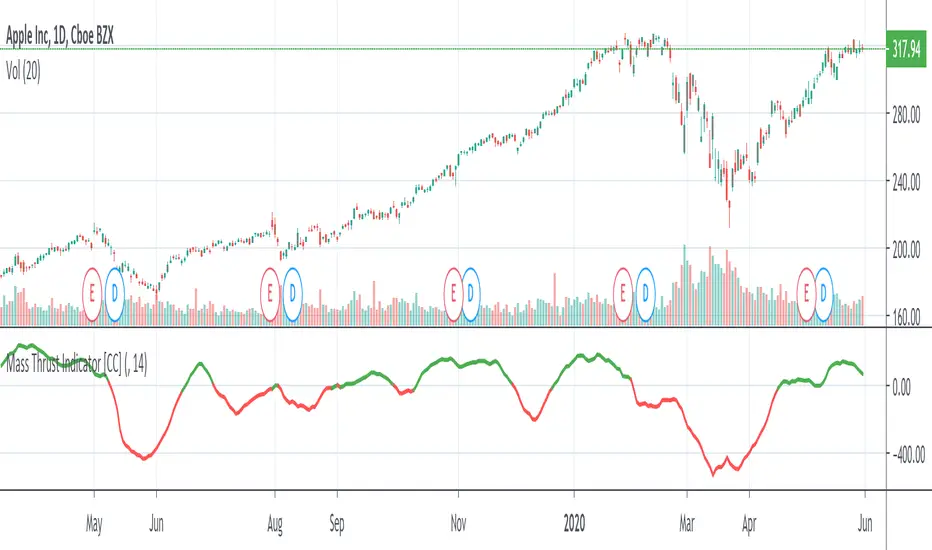
Mass Thrust OscillatorThis is a custom indicator that turns my Mass Thrust Indicator into an oscillator which is loosely based on Tushar S. Chande's Market Thrust Oscillator (Stocks & Commodities V. 10:8 (347-350))
Let me know if you would like a custom script or if you want to see me publish any other indicators!

Mass Thrust IndicatorThis is a custom indicator of mine that I based loosely on Tushar S. Chande's Market Thrust Indicator (Stocks & Commodities V. 10:8 (347-350)). Buy the stock if the indicator is green and sell when it turns red.
Let me know if you would like to see more scripts or if you have custom requests!
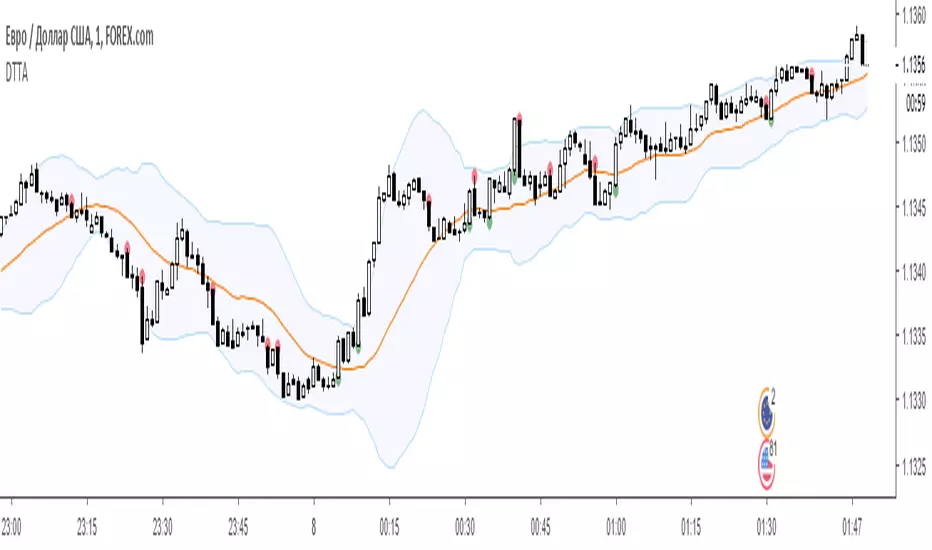
Dual Thrust Trading Algorithm (ps4)This is an PS4 update to the popular Dual Thrust trading algorithm posted by me some time ago (). It has been commonly used in futures, Forex and equity markets. The idea of Dual Thrust is similar to a typical breakout system, however dual thrust uses the historical price to construct update the look back period - theoretically making it more stable in any given period.
See: www.quantconnect.com

Dual Thrust Trading AlgorithmThe Dual Thrust trading algorithm is a famous strategy developed by Michael Chalek. It has been commonly used in futures, forex and equity markets. The idea of Dual Thrust is similar to a typical breakout system, however dual thrust uses the historical price to construct update the look back period - theoretically making it more stable in any given period.
Thrust CountThis counts the number of up or down thrusts over the previous N days and creates a total (up thrust - down thrust) to produce the graph.
It also optionally will include "run days" as part of the same count.
The idea is that it gives you an indication of the strength of the current trend (and can possibly help you spot it reversing ;))
For more on thrust days see:
And for more on run days see:
