IndicatorsLibrary "Indicators"
this has a calculation for the most used indicators.
macd4C(fastMa, slowMa)
this calculates macd 4c
Parameters:
fastMa (simple int) : is the period for the fast ma. the minimum value is 7
slowMa (simple int) : is the period for the slow ma. the minimum value is 7
Returns: the macd 4c value for the current bar
rsi(rsiSourceInput, rsiLengthInput)
this calculates rsi
Parameters:
rsiSourceInput (float) : is the source for the rsi
rsiLengthInput (simple int) : is the period for the rsi
Returns: the rsi value for the current bar
ao(source, fastPeriod, slowPeriod)
this calculates ao
Parameters:
source (float) : is the source for the ao
fastPeriod (int) : is the period for the fast ma
slowPeriod (int) : is the period for the slow ma
Returns: the ao value for the current bar
kernelAoOscillator(kernelFastLookback, kernelSlowLookback, kernelFastWeight, kernelSlowWeight, kernelFastRegressionStart, kernelSlowRegressionStart, kernelFastSmoothPeriod, kernelSlowSmoothPeriod, kernelFastSmooth, kernelSlowSmooth, source)
this calculates our own kernel ao oscillator which we made
Parameters:
kernelFastLookback (simple int)
kernelSlowLookback (simple int)
kernelFastWeight (simple float)
kernelSlowWeight (simple float)
kernelFastRegressionStart (simple int)
kernelSlowRegressionStart (simple int)
kernelFastSmoothPeriod (int)
kernelSlowSmoothPeriod (int)
kernelFastSmooth (bool)
kernelSlowSmooth (bool)
source (float) : is the source for the ao
Returns: the kernel ao oscillator value for the current bar, the colors for both the fast and slow kernel, the fast & slow kernel
signalLineKernel(lag, h, r, x_0, smoothColors, _src, c_bullish, c_bearish)
Parameters:
lag (int)
h (float)
r (float)
x_0 (int)
smoothColors (bool)
_src (float)
c_bullish (color)
c_bearish (color)
zigzagCalc(Depth, Deviation, Backstep, repaint, Show_zz, line_thick, text_color)
Parameters:
Depth (int)
Deviation (int)
Backstep (int)
repaint (bool)
Show_zz (bool)
line_thick (int)
text_color (color)
Techindicator

RelativeValue█ OVERVIEW
This library is a Pine Script™ programmer's tool offering the ability to compute relative values, which represent comparisons of current data points, such as volume, price, or custom indicators, with their analogous historical data points from corresponding time offsets. This approach can provide insightful perspectives into the intricate dynamics of relative market behavior over time.
█ CONCEPTS
Relative values
In this library, a relative value is a metric that compares a current data point in a time interval to an average of data points with corresponding time offsets across historical periods. Its purpose is to assess the significance of a value by considering the historical context within past time intervals.
For instance, suppose we wanted to calculate relative volume on an hourly chart over five daily periods, and the last chart bar is two hours into the current trading day. In this case, we would compare the current volume to the average of volume in the second hour of trading across five days. We obtain the relative volume value by dividing the current volume by this average.
This form of analysis rests on the hypothesis that substantial discrepancies or aberrations in present market activity relative to historical time intervals might help indicate upcoming changes in market trends.
Cumulative and non-cumulative values
In the context of this library, a cumulative value refers to the cumulative sum of a series since the last occurrence of a specific condition (referred to as `anchor` in the function definitions). Given that relative values depend on time, we use time-based conditions such as the onset of a new hour, day, etc. On the other hand, a non-cumulative value is simply the series value at a specific time without accumulation.
Calculating relative values
Four main functions coordinate together to compute the relative values: `maintainArray()`, `calcAverageByTime()`, `calcCumulativeSeries()`, and `averageAtTime()`. These functions are underpinned by a `collectedData` user-defined type (UDT), which stores data collected since the last reset of the timeframe along with their corresponding timestamps. The relative values are calculated using the following procedure:
1. The `averageAtTime()` function invokes the process leveraging all four of the methods and acts as the main driver of the calculations. For each bar, this function adds the current bar's source and corresponding time value to a `collectedData` object.
2. Within the `averageAtTime()` function, the `maintainArray()` function is called at the start of each anchor period. It adds a new `collectedData` object to the array and ensures the array size does not exceed the predefined `maxSize` by removing the oldest element when necessary. This method plays an essential role in limiting memory usage and ensuring only relevant data over the desired number of periods is in the calculation window.
3. Next, the `calcAverageByTime()` function calculates the average value of elements within the `data` field for each `collectedData` object that corresponds to the same time offset from each anchor condition. This method accounts for cases where the current index of a `collectedData` object exceeds the last index of any past objects by using the last available values instead.
4. For cumulative calculations, the `averageAtTime()` function utilizes the `isCumulative` boolean parameter. If true, the `calcCumulativeSeries()` function will track the running total of the source data from the last bar where the anchor condition was met, providing a cumulative sum of the source values from one anchor point to the next.
To summarize, the `averageAtTime()` function continually stores values with their corresponding times in a `collectedData` object for each bar in the anchor period. When the anchor resets, this object is added to a larger array. The array's size is limited by the specified number of periods to be averaged. To correlate data across these periods, time indexing is employed, enabling the function to compare corresponding points across multiple periods.
█ USING THIS LIBRARY
The library simplifies the complex process of calculating relative values through its intuitive functions. Follow the steps below to use this library in your scripts.
Step 1: Import the library and declare inputs
Import the library and declare variables based on the user's input. These can include the timeframe for each period, the number of time intervals to include in the average, and whether the calculation uses cumulative values. For example:
//@version=5
import TradingView/RelativeValue/1 as TVrv
indicator("Relative Range Demo")
string resetTimeInput = input.timeframe("D")
int lengthInput = input.int(5, "No. of periods")
Step 2: Define the anchor condition
With these inputs declared, create a condition to define the start of a new period (anchor). For this, we use the change in the time value from the input timeframe:
bool anchor = timeframe.change(resetTimeInput)
Step 3: Calculate the average
At this point, one can calculate the average of a value's history at the time offset from the anchor over a number of periods using the `averageAtTime()` function. In this example, we use True Range (TR) as the `source` and set `isCumulative` to false:
float pastRange = TVrv.averageAtTime(ta.tr, lengthInput, anchor, false)
Step 4: Display the data
You can visualize the results by plotting the returned series. These lines display the non-cumulative TR alongside the average value over `lengthInput` periods for relative comparison:
plot(pastRange, "Past True Range Avg", color.new(chart.bg_color, 70), 1, plot.style_columns)
plot(ta.tr, "True Range", close >= open ? color.new(color.teal, 50) : color.new(color.red, 50), 1, plot.style_columns)
This example will display two overlapping series of columns. The green and red columns depict the current TR on each bar, and the light gray columns show the average over a defined number of periods, e.g., the default inputs on an hourly chart will show the average value at the hour over the past five days. This comparative analysis aids in determining whether the range of a bar aligns with its typical historical values or if it's an outlier.
█ NOTES
• The foundational concept of this library was derived from our initial Relative Volume at Time script. This library's logic significantly boosts its performance. Keep an eye out for a forthcoming updated version of the indicator. The demonstration code included in the library emulates a streamlined version of the indicator utilizing the library functions.
• Key efficiencies in the data management are realized through array.binary_search_leftmost() , which offers a performance improvement in comparison to its loop-dependent counterpart.
• This library's architecture utilizes user-defined types (UDTs) to create custom objects which are the equivalent of variables containing multiple parts, each able to hold independent values of different types . The recently added feature was announced in this blog post.
• To enhance readability, the code substitutes array functions with equivalent methods .
Look first. Then leap.
█ FUNCTIONS
This library contains the following functions:
calcCumulativeSeries(source, anchor)
Calculates the cumulative sum of `source` since the last bar where `anchor` was `true`.
Parameters:
source (series float) : Source used for the calculation.
anchor (series bool) : The condition that triggers the reset of the calculation. The calculation is reset when `anchor` evaluates to `true`, and continues using the values accumulated since the previous reset when `anchor` is `false`.
Returns: (float) The cumulative sum of `source`.
averageAtTime(source, length, anchor, isCumulative)
Calculates the average of all `source` values that share the same time difference from the `anchor` as the current bar for the most recent `length` bars.
Parameters:
source (series float) : Source used for the calculation.
length (simple int) : The number of reset periods to consider for the average calculation of historical data.
anchor (series bool) : The condition that triggers the reset of the average calculation. The calculation is reset when `anchor` evaluates to `true`, and continues using the values accumulated since the previous reset when `anchor` is `false`.
isCumulative (simple bool) : If `true`, `source` values are accumulated until the next time `anchor` is `true`. Optional. The default is `true`.
Returns: (float) The average of the source series at the specified time difference.

AoDivergenceLibrary_Library "AoDivergenceLibrary_"
this has functions which calculate and plot divergences which are used for ao divergences. essentially, this finds divergences by using the ao divergence logic. this logic has been used in "AO Hid & Reg Div with LC & Kernel".
regBullDivergence(swingLow, osc, colour)
Parameters:
swingLow (bool)
osc (float)
colour (color)
regBearDivergence(swingHigh, osc, colour)
Parameters:
swingHigh (bool)
osc (float)
colour (color)
hidBullDivergence(swingHigh, osc, colour)
Parameters:
swingHigh (bool)
osc (float)
colour (color)
hidBearDivergence(swingHigh, osc, colour)
Parameters:
swingHigh (bool)
osc (float)
colour (color)

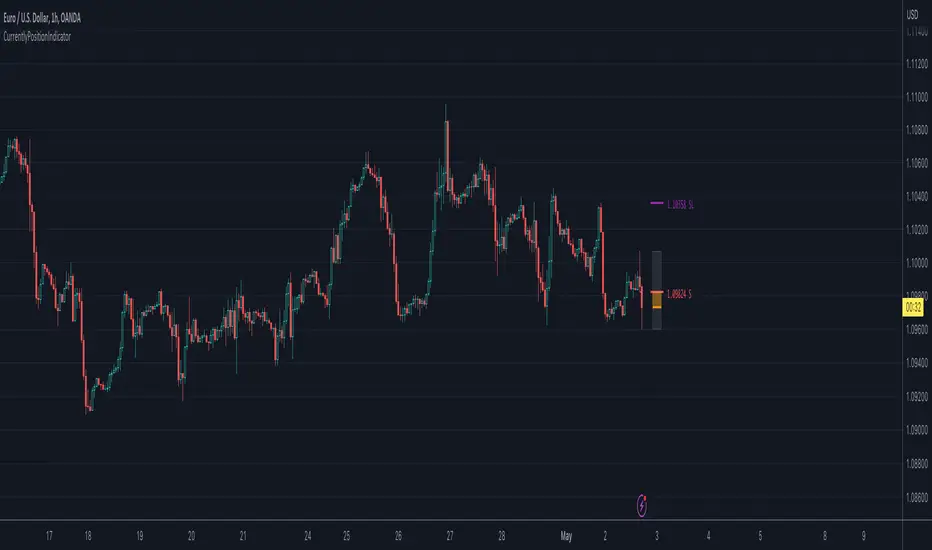
CurrentlyPositionIndicatorLibrary "CurrentlyPositionIndicator"
Currently position indicator
run(_index, _price, _stoploss, _high, _low, _side, _is_entered, _colors, _position_left, _box_width)
Currently positions indicator
Parameters:
_index (int) : entry index
_price (float) : entry price
_stoploss (float) : stoploss price
_high (float) : range high
_low (float) : range low
_side (int)
_is_entered (bool) : is entered
_colors (color ) : color array
_position_left (int) : Left position
_box_width (int) : box's width
Returns: TODO: add what function returns
BankNifty_CSMLibrary "BankNifty_CSM"
TODO: add library description here
getLtp_N_Chang(openPrice, closePrice, highPrice, hl2Price, lowPrice, hlc3Price, bankNiftyClose)
Parameters:
openPrice (float)
closePrice (float)
highPrice (float)
hl2Price (float)
lowPrice (float)
hlc3Price (float)
bankNiftyClose (float)

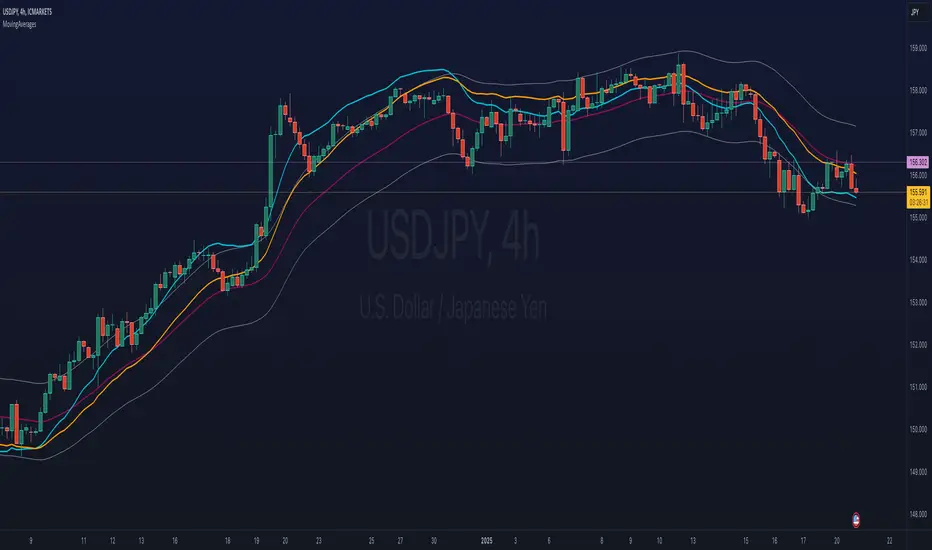
ka66: lib/MovingAveragesLibrary "MovingAverages"
Exotic or Interesting Moving Averages Collection. Just the one right now!
alphaConfigurableEma(src, alpha, nSmooth)
Calculates a variation of the EMA by specifying a custom alpha value.
Parameters:
src (float) : a float series to get the EMA for, e.g. close, hlc3, etc.
alpha (float) : a value between 0 (ideally greater, to get any MA!) and 1. Closer
to one makes it more responsive, and choppier.
nSmooth (int) : Just applies the same alpha and EMA to the last Alpha-EMA output.
A value between 0 and 10 (just keeping a a reasonable bound). The idea is
you can first use a reasonably high alpha, then smooth it out. Default 0,
no further smoothing.
Returns: MA series.
bands(src, multiplier)
Calculates fixed bands around a series, can be any series, though the intent
here is for MA series.
Parameters:
src (float) : a float series.
multiplier (float) : a value greater than or equal to 0 (ideally greater, to get any MA!),
determines the width of the bands. Start with small float values, or it may go
beyond the scale, e.g. 0.005.
Returns: a 2-tuple of (upBand, downBand)
Spider_PlotIntroduction:
Spider charts, also known as radar charts or web charts, are a powerful data visualization tool that can display multiple variables in a circular format. They are particularly useful when you want to compare different data sets or evaluate the performance of a single data set across multiple dimensions. In this blog post, we will dive into the world of spider charts, explore their benefits, and demonstrate how you can create your own spider chart using the Spider_Plot library.
Why Spider Charts are Cool:
Spider charts have a unique visual appeal that sets them apart from other chart types. They allow you to display complex data in a compact, easy-to-understand format, making them perfect for situations where you need to convey a lot of information in a limited space. Some of the key benefits of spider charts include:
Multi-dimensional analysis: Spider charts can display multiple variables at once, making them ideal for analyzing relationships between different data sets or examining a single data set across multiple dimensions.
Easy comparison: By displaying data in a circular format, spider charts make it simple to compare different data points, identify trends, and spot potential issues.
Versatility: Spider charts can be used for a wide range of applications, from business and finance to sports and health. They are particularly useful for situations where you need to analyze performance or make comparisons between different entities.
Creating Your Own Spider Chart with the Spider_Plot Library:
The Spider_Plot library is a user-friendly, easy-to-use tool that allows you to create stunning spider charts with minimal effort. To get started, you'll need to import the Spider_Plot library:
import peacefulLizard50262/Spider_Plot/1
With the library imported, you can now create your own spider chart. The first step is to normalize your data. Normalizing ensures that all data points fall within the 0 to 1 range, which is important for creating a visually balanced spider chart.
The Spider_Plot library provides the data_normalize function to help you normalize your data. This function accepts several parameters, including the normalization style ("All Time", "Range", or "Custom"), length of the range, outlier level, lookback period for standard deviation, and minimum and maximum values for the "Custom" normalization style.
Once you have normalized your data, you can create an array of your data points using the array.from function. This array will be used as input for the draw_spider_plot function, which is responsible for drawing the spider plot on your chart.
The draw_spider_plot function accepts an array of float values (the normalized data points), an array of background colors for each sector, a color for the axes, and a scaling factor.
Example Usage:
Here's an example script that demonstrates how to create a spider chart using the Spider_Plot library:
oc = data_normalize(ta.ema(math.abs(open - close), 20), "Range", 20)
// Create an array of your data points
data = array.from(tr, rsi, stoch, dev, tr, oc, tr)
// Define colors for each sector
colors = array.from(color.new(color.red, 90), color.new(color.blue, 90), color.new(color.green, 90), color.new(color.orange, 90), color.new(color.purple, 90), color.new(color.purple, 90), color.new(color.purple, 90))
// Draw the spider plot on your chart
draw_spider_plot(data, colors, color.gray, 100)
In this example, we have first normalized six different data points (rsi, source, stoch, dev, tr, and oc) using the data_normalize function. Next, we create an array of these normalized data points and define an array of colors for each sector of the spider chart. Finally, we call the draw_spider_plot function to draw the spider chart on our chart.
Conclusion:
Spider charts are a versatile and visually appealing tool for analyzing and comparing multi-dimensional data. With the Spider_Plot library, you can easily create your own spider charts and unlock valuable insights from your data. Just remember to normalize your data and create an array of data points before calling the draw_spider_plot function. Happy charting!
Library "Spider_Plot"
data_normalize(data, style, length, outlier_level, dev_lookback, min, max)
data_normalize(data, string style, int length, float outlier_level, simple int dev_lookback, float min, float max)
Parameters:
data (float) : float , A float value to normalize.
style (string) : string , The normalization style: "All Time", "Range", or "Custom".
length (int) : int , The length of the range for "Range" normalization style.
outlier_level (float) : float , The outlier level to exclude from calculations.
dev_lookback (simple int) : int , The lookback period for calculating the standard deviation.
min (float) : float , The minimum value for the "Custom" normalization style.
max (float) : float , The maximum value for the "Custom" normalization style.
Returns: array , The normalized float value.
draw_spider_plot(values, bg_colors, axes_color, scale)
draw_spider_plot(array values, array bg_colors, color axes_color, float scale)
Parameters:
values (float ) : array , An array of float values to plot in the spider plot.
bg_colors (color ) : array , An array of background colors for each sector in the spider plot.
axes_color (color) : color , The color of the axes in the spider plot. Default: color.gray
scale (float) : float , A scaling factor for the spider plot. Default: 10
Returns: void , Draws the spider plot on the chart.

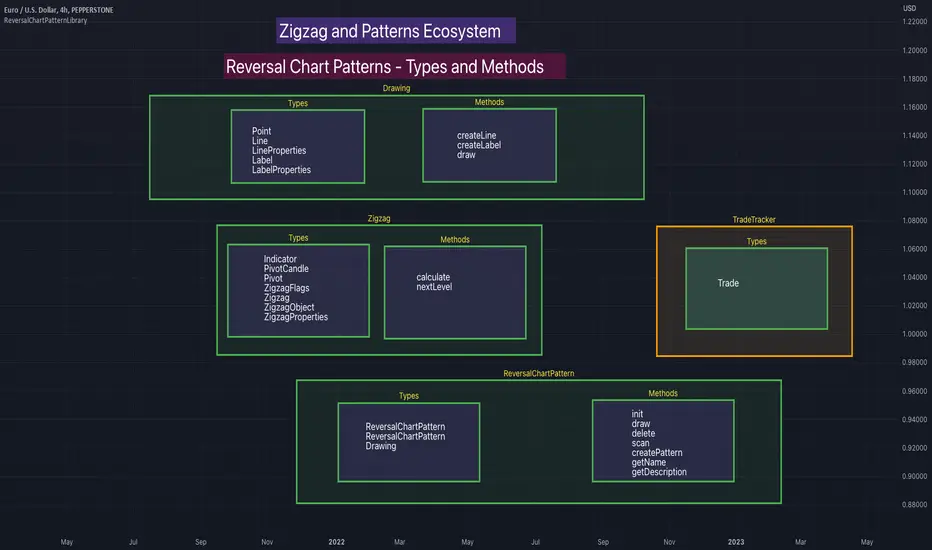
ReversalChartPatternLibraryLibrary "ReversalChartPatternLibrary"
User Defined Types and Methods for reversal chart patterns - Double Top, Double Bottom, Triple Top, Triple Bottom, Cup and Handle, Inverted Cup and Handle, Head and Shoulders, Inverse Head and Shoulders
method delete(this)
Deletes the drawing components of ReversalChartPatternDrawing object
Namespace types: ReversalChartPatternDrawing
Parameters:
this (ReversalChartPatternDrawing) : ReversalChartPatternDrawing object
Returns: current ReversalChartPatternDrawing object
method delete(this)
Deletes the drawing components of ReversalChartPattern object. In turn calls the delete of ReversalChartPatternDrawing
Namespace types: ReversalChartPattern
Parameters:
this (ReversalChartPattern) : ReversalChartPattern object
Returns: current ReversalChartPattern object
method lpush(this, obj, limit, deleteOld)
Array push with limited number of items in the array. Old items are deleted when new one comes and exceeds the limit
Namespace types: ReversalChartPattern
Parameters:
this (ReversalChartPattern ) : array object
obj (ReversalChartPattern) : ReversalChartPattern object which need to be pushed to the array
limit (int) : max items on the array. Default is 10
deleteOld (bool) : If set to true, also deletes the drawing objects. If not, the drawing objects are kept but the pattern object is removed from array. Default is false.
Returns: current ReversalChartPattern object
method draw(this)
Draws the components of ReversalChartPatternDrawing
Namespace types: ReversalChartPatternDrawing
Parameters:
this (ReversalChartPatternDrawing) : ReversalChartPatternDrawing object
Returns: current ReversalChartPatternDrawing object
method draw(this)
Draws the components of ReversalChartPatternDrawing within the ReversalChartPattern object.
Namespace types: ReversalChartPattern
Parameters:
this (ReversalChartPattern) : ReversalChartPattern object
Returns: current ReversalChartPattern object
method scan(zigzag, patterns, errorPercent, shoulderStart, shoulderEnd)
Scans zigzag for ReversalChartPattern occurences
Namespace types: zg.Zigzag
Parameters:
zigzag (Zigzag type from HeWhoMustNotBeNamed/ZigzagTypes/2) : ZigzagTypes.Zigzag object having array of zigzag pivots and other information on each pivots
patterns (ReversalChartPattern ) : Existing patterns array. Used for validating duplicates
errorPercent (float) : Error threshold for considering ratios. Default is 13
shoulderStart (float) : Starting range of shoulder ratio. Used for identifying shoulders, handles and necklines
shoulderEnd (float) : Ending range of shoulder ratio. Used for identifying shoulders, handles and necklines
Returns: int pattern type
method createPattern(zigzag, patternType, patternColor, riskAdjustment)
Create Pattern from ZigzagTypes.Zigzag object
Namespace types: zg.Zigzag
Parameters:
zigzag (Zigzag type from HeWhoMustNotBeNamed/ZigzagTypes/2) : ZigzagTypes.Zigzag object having array of zigzag pivots and other information on each pivots
patternType (int) : Type of pattern being created. 1 - Double Tap, 2 - Triple Tap, 3 - Cup and Handle, 4 - Head and Shoulders
patternColor (color) : Color in which the patterns are drawn
riskAdjustment (float) : Used for calculating stops
Returns: ReversalChartPattern object created
method getName(this)
get pattern name of ReversalChartPattern object
Namespace types: ReversalChartPattern
Parameters:
this (ReversalChartPattern) : ReversalChartPattern object
Returns: string name of the pattern
method getDescription(this)
get consolidated description of ReversalChartPattern object
Namespace types: ReversalChartPattern
Parameters:
this (ReversalChartPattern) : ReversalChartPattern object
Returns: string consolidated description
method init(this)
initializes the ReversalChartPattern object and creates sub object types
Namespace types: ReversalChartPattern
Parameters:
this (ReversalChartPattern) : ReversalChartPattern object
Returns: ReversalChartPattern current object
ReversalChartPatternDrawing
Type which holds the drawing objects for Reversal Chart Pattern Types
Fields:
patternLines (Line type from HeWhoMustNotBeNamed/DrawingTypes/1) : array of Line objects representing pattern
entry (Line type from HeWhoMustNotBeNamed/DrawingTypes/1) : Entry price Line
target (Line type from HeWhoMustNotBeNamed/DrawingTypes/1) : Target price Line
patternLabel (Label type from HeWhoMustNotBeNamed/DrawingTypes/1)
ReversalChartPattern
Reversal Chart Pattern master type which holds the pattern components, drawings and trade details
Fields:
pivots (Pivot type from HeWhoMustNotBeNamed/ZigzagTypes/2) : Array of Zigzag Pivots forming the pattern
patternType (series int) : Defines the main type of pattern 1 - Double Tap, 1 - Triple Tap, 3 - Cup and Handle, 4 - Head and Shoulders
patternColor (series color) : Color in which the pattern will be drawn on chart
riskAdjustment (series float) : Percentage adjustment of risk. Used for setting stops
drawing (ReversalChartPatternDrawing) : ReversalChartPatternDrawing object which holds the drawing components
trade (Trade type from HeWhoMustNotBeNamed/TradeTracker/1) : TradeTracker.Trade object holding trade components
TradeTrackerLibrary "TradeTracker"
Simple Library for tracking trades
method track(this)
tracks trade when called on every bar
Namespace types: Trade
Parameters:
this (Trade) : Trade object
Returns: current Trade object
Trade
Has the constituents to track trades generated by any method.
Fields:
id (series int)
direction (series int) : Trade direction. Positive values for long and negative values for short trades
initialEntry (series float) : Initial entry price. This value will not change even if the entry is changed in the lifecycle of the trade
entry (series float) : Updated entry price. Allows variations to initial calculated entry. Useful in cases of trailing entry.
initialStop (series float) : Initial stop. Similar to initial entry, this is the first calculated stop for the lifecycle of trade.
stop (series float) : Trailing Stop. If there is no trailing, the value will be same as that of initial trade
targets (float ) : array of target values.
startBar (series int) : bar index of starting bar. Set by default when object is created. No need to alter this after that.
endBar (series int) : bar index of last bar in trade. Set by tracker on each execution
startTime (series int) : time of the start bar. Set by default when object is created. No need to alter this after that.
endTime (series int) : time of the ending bar. Updated by tracking method.
status (series int) : Integer parameter to track the status of the trade
retest (series bool) : Boolean parameter to notify if there was retest of the entry price
peacefulIndicatorsWe are delighted to present the PeacefulIndicators library, a modest yet powerful collection of custom technical indicators created to enhance your trading analysis. The library features an array of practical tools, including MACD with Dynamic Length, Stochastic RSI with ATR Stop Loss, Bollinger Bands with RSI Divergence, and more.
The PeacefulIndicators library offers the following functions:
macdDynamicLength: An adaptive version of the classic MACD indicator, which adjusts the lengths of the moving averages based on the dominant cycle period, providing a more responsive signal.
rsiDivergence: A unique implementation of RSI Divergence detection that identifies potential bullish and bearish divergences using a combination of RSI and linear regression.
trendReversalDetection: A helpful tool for detecting trend reversals using the Rate of Change (ROC) and Moving Averages, offering valuable insights into possible market shifts.
volume_flow_oscillator: A custom oscillator that combines price movement strength and volume to provide a unique perspective on market dynamics.
weighted_volatility_oscillator: Another custom oscillator that factors in price volatility and volume to deliver a comprehensive view of market fluctuations.
rvo: The Relative Volume Oscillator highlights changes in volume relative to historical averages, helping to identify potential breakouts or reversals.
acb: The Adaptive Channel Breakout indicator combines a moving average with an adjustable volatility multiplier to create dynamic channels, useful for identifying potential trend shifts.
We hope this library proves to be a valuable addition to your trading toolbox.
Library "peacefulIndicators"
A custom library of technical indicators for trading analysis, including MACD with Dynamic Length, Stochastic RSI with ATR Stop Loss, Bollinger Bands with RSI Divergence, and more.
macdDynamicLength(src, shortLen, longLen, signalLen, dynLow, dynHigh)
Moving Average Convergence Divergence with Dynamic Length
Parameters:
src (float) : Series to use
shortLen (int) : Shorter moving average length
longLen (int) : Longer moving average length
signalLen (int) : Signal line length
dynLow (int) : Lower bound for the dynamic length
dynHigh (int) : Upper bound for the dynamic length
Returns: tuple of MACD line and Signal line
Computes MACD using lengths adapted based on the dominant cycle period
rsiDivergence(src, rsiLen, divThreshold, linRegLength)
RSI Divergence Detection
Parameters:
src (float) : Series to use
rsiLen (simple int) : Length for RSI calculation
divThreshold (float) : Divergence threshold for RSI
linRegLength (int) : Length for linear regression calculation
Returns: tuple of RSI Divergence (positive, negative)
Computes RSI Divergence detection that identifies bullish (positive) and bearish (negative) divergences
trendReversalDetection(src, rocLength, maLength, maType)
Trend Reversal Detection (TRD)
Parameters:
src (float) : Series to use
rocLength (int) : Length for Rate of Change calculation
maLength (int) : Length for Moving Average calculation
maType (string) : Type of Moving Average to use (default: "sma")
Returns: A tuple containing trend reversal direction and the reversal point
Detects trend reversals using the Rate of Change (ROC) and Moving Averages.
volume_flow_oscillator(src, length)
Volume Flow Oscillator
Parameters:
src (float) : Series to use
length (int) : Period for the calculation
Returns: Custom Oscillator value
Computes the custom oscillator based on price movement strength and volume
weighted_volatility_oscillator(src, length)
Weighted Volatility Oscillator
Parameters:
src (float) : Series to use
length (int) : Period for the calculation
Returns: Custom Oscillator value
Computes the custom oscillator based on price volatility and volume
rvo(length)
Relative Volume Oscillator
Parameters:
length (int) : Period for the calculation
Returns: Custom Oscillator value
Computes the custom oscillator based on relative volume
acb(price_series, ma_length, vol_length, multiplier)
Adaptive Channel Breakout
Parameters:
price_series (float) : Price series to use
ma_length (int) : Period for the moving average calculation
vol_length (int) : Period for the volatility calculation
multiplier (float) : Multiplier for the volatility
Returns: Tuple containing the ACB upper and lower values and the trend direction (1 for uptrend, -1 for downtrend)

UtilityLibrary "Utility"
dema(src, length)
Parameters:
src (float)
length (simple int)
tema(src, length)
Parameters:
src (float)
length (simple int)
hma(src, length)
Parameters:
src (float)
length (int)
zlema(src, length)
Parameters:
src (float)
length (simple int)
stochRSI(src, lengthRSI, lengthStoch, smoothK, smoothD)
Parameters:
src (float)
lengthRSI (simple int)
lengthStoch (int)
smoothK (int)
smoothD (int)
slope(src, length)
Parameters:
src (float)
length (int)

RsiLibLibrary "RsiLib"
TODO: add library description here
bullishDivergence(rsi, check_backward_length, rsi_threshold, rsi_overload_threshold, power_threshhold)
Parameters:
rsi (float)
check_backward_length (int)
rsi_threshold (float)
rsi_overload_threshold (float)
power_threshhold (int)
peterzorve-libraryLibrary "library"
is_bullish_engulfing()
is_bearish_engulfing()
is_hammer(fib_level)
Parameters:
fib_level (float)
is_shooting_star(fib_level)
Parameters:
fib_level (float)
is_hammer_and_star(fib_level)
Parameters:
fib_level (float)
is_star_and_hammer(fib_level)
Parameters:
fib_level (float)
is_dogi(dogi_body_ratio)
Parameters:
dogi_body_ratio (float)
is_bear_bear_bullish_engulf()
is_atr_stoploss_takeprofit(atr_multiplier, atr_length, reward_ratio)
Parameters:
atr_multiplier (float)
atr_length (simple int)
reward_ratio (float)
is_fixed_stoploss_takeprofit(stoploss_pips, reward_ratio)
Parameters:
stoploss_pips (float)
reward_ratio (float)
is_step_trailing_stoploss(stoploss_pips)
Parameters:
stoploss_pips (float)
is_atr_trailing_stoploss(atr_multiplier, break_even_pip)
Parameters:
atr_multiplier (float)
break_even_pip (int)
is_pull_back_strategy(length)
Parameters:
length (simple int)
is_trade_statistics(condition, entrypoint, stoploss, takeprofit)
Parameters:
condition (bool)
entrypoint (float)
stoploss (float)
takeprofit (float)
is_table_of_statistics(win_trades, lost_trades, even_trades, pips_won, pips_lost)
Parameters:
win_trades (int)
lost_trades (int)
even_trades (int)
pips_won (float)
pips_lost (float)
is_pine_info(lotsize, stoploss, takeprofit)
Parameters:
lotsize (float)
stoploss (float)
takeprofit (float)
is_support_and_resistance_strategy(look_back, look_forward)
Parameters:
look_back (int)
look_forward (int)
is_choral_strategy(smoothing_period, constant_d)
Parameters:
smoothing_period (int)
constant_d (float)
is_bollinger_band_strategy(length, dev_entry, dev_stoploss, dev_takeprofit)
Parameters:
length (int)
dev_entry (simple float)
dev_stoploss (simple float)
dev_takeprofit (simple float)
VolumeLibLibrary "VolumeLib"
Contains types and methods related to VOLUME
volumePrice()
TODO: add function description here
Returns: TODO: add what function returns
averageVolumePrice(length)
Parameters:
length (simple int)
volumePower(volume_price, average_volume_price)
Parameters:
volume_price (float)
average_volume_price (float)
volumePower(length)
Parameters:
length (simple int)
AdxLibLibrary "AdxLib"
TODO: add library description here
create(di_length, adx_length)
Parameters:
di_length (simple int)
adx_length (simple int)
create(adx_length)
Parameters:
adx_length (simple int)
LibreLibrary "Libre"
TODO: add library description here
MMMM(toe)
Parameters:
toe (string)
OOOO(toe, toe1, toe2, toe3, toe4, toe5, init)
Parameters:
toe (string)
toe1 (string)
toe2 (string)
toe3 (string)
toe4 (string)
toe5 (string)
init (int)
XXXX(toe)
Parameters:
toe (string)
WWWW(toe)
Parameters:
toe (string)
OHLC📕 LIBRARY OHLC
🔷 Introduction
This library is a custom library designed to work with real-time bars. It allows to easily calculate OHLC values for any source.
Personally, I use this library to accurately display the highest and lowest values on visual indicators such as my progress bars.
🔷 How to Use
◼ 1. Import the OHLC library into your TradingView script:
import cryptolinx/OHLC/1
- or -
Instead of the library namespace, you can define a custom namespace as alias.
import cryptolinx/OHLC/1 as src
◼ 2. Create a new OHLC source using the `new()` function.
varip mySrc = OHLC.new() // It is required to use the `varip` keyword to init your ``
- or -
If you has set up an alias before.
varip mySrc = src.new()
===
In that case, your `` needs to be `na`, define your object like that
varip mySrc = na
◼ 3. Call the `hydrateOHLC()` method on your OHLC source to update its values:
Basic
float rsi = ta.rsi(close, 14)
mySrc.hydrateOHLC(rsi)
- or -
Inline
rsi = ta.rsi(close, 14).hydrateOHLC(mySrc)
◼ 4. The data is accessible under their corresponding names.
mySrc.open
mySrc.high
mySrc.low
mySrc.close
🔷 Note: This library only works with real-time bars and will not work with historical bars.

Lex_3CR_Functions_Library2Library "Lex_3CR_Functions_Library2"
This is a source code for a technical analysis library in Pine Script language,
designed to identify and mark Bullish and Bearish Three Candle Reversal (3CR) chart patterns.
The library provides three functions to be used in a trading algorithm.
The first function, Bull_3crMarker, adds a dashed line and label to a Bullish 3CR chart pattern, indicating the 3CR point.
The second function, Bear_3crMarker, adds a dashed line and label to a Bearish 3CR chart pattern.
The third function, Bull_3CRlogicals, checks for a Bullish 3CR pattern where the first candle's low is greater than the second candle's low and the second candle's low is less than the third candle's low.
If found, creates a line at the breakout point and a label at the fail point,
if specified. All functions take parameters such as the chart pattern's characteristics and output colors, labels, and markers.
Bull_3crMarker(bulllinearray, barnum, breakpoint, failpointB, failpoint, linecolorbull, bulllabelarray, labelcolor, textcolor, labelon)
Bull_3crMarker Adds a 3CR marker to a Bullish 3CR chart pattern
@description Adds a dashed line and label to a 3CR up chart pattern, indicating the 3CR (3 Candle Reversal) point.
Parameters:
bulllinearray (line )
barnum (int)
breakpoint (float)
failpointB (float )
failpoint (float)
linecolorbull (color)
bulllabelarray (label )
labelcolor (color)
textcolor (color)
labelon (bool)
Bear_3crMarker(bearlinearray, barnum, breakpoint, failpointB, failpoint, linecolorbear, bearlabelarray, labelcolor, textcolor, labelon)
Bear_3crMarker Adds a 3CR marker to a Bearish 3CR chart pattern
@description Adds a dashed line and label to a 3CR down chart pattern, indicating the 3CR (3 Candle Reversal) point.
Parameters:
bearlinearray (line )
barnum (int)
breakpoint (float)
failpointB (float )
failpoint (float)
linecolorbear (color)
bearlabelarray (label )
labelcolor (color)
textcolor (color)
labelon (bool)
Bull_3CRlogicals(low1, low2, low3, bulllinearray, bulllabelarray, failpointB, linecolorbull, labelcolor, textcolor, labelon)
Checks for a bullish three candle reversal pattern and creates a line and label at the breakout point if found
@description Checks for a bullish three candle reversal pattern where the first candle's low is greater than the second candle's low and the second candle's low is less than the third candle's low. If found, creates a line at the breakout point and a label at the fail point, if specified.
Parameters:
low1 (float)
low2 (float)
low3 (float)
bulllinearray (line )
bulllabelarray (label )
failpointB (float )
linecolorbull (color)
labelcolor (color)
textcolor (color)
labelon (bool)
Bear_3CRlogicals(high1, high2, high3, bearlinearray, bearlabelarray, failpointB, linecolorbear, labelcolor, textcolor, labelon)
Checks for a Bearish 3CR pattern and draws a bearish marker on the chart at the appropriate location
@description This function checks for a Bearish 3CR (Three-Candle Reversal) pattern, which is defined as the second candle having a higher high than the first and third candles, and the third candle having a lower high than the first candle. If the pattern is detected, a bearish marker is drawn on the chart at the appropriate location, and an optional label can be added to the marker.
Parameters:
high1 (float)
high2 (float)
high3 (float)
bearlinearray (line )
bearlabelarray (label )
failpointB (float )
linecolorbear (color)
labelcolor (color)
textcolor (color)
labelon (bool)
bullLineDelete(i, bulllinearray, failarray, bulllabelarray, labelon)
Removes a bullish line from a specified position in a line array, and optionally removes a label associated with that line
@description Removes a bullish line from a specified position in a line array, and optionally removes a label associated with that line.
Parameters:
i (int)
bulllinearray (line )
failarray (float )
bulllabelarray (label )
labelon (bool)
bearLineDelete(i, bearlinearray, failarray, bearlabelarray, labelon)
Removes a bearish line from a specified position in a line array, and optionally removes a label associated with that line
@description Removes a bearish line from a specified position in a line array, and optionally removes a label associated with that line.
Parameters:
i (int)
bearlinearray (line )
failarray (float )
bearlabelarray (label )
labelon (bool)
bulloffsetdelete(i, bulllinearray, failarray, bulllabelarray, labelon)
Removes a bullish line from a specified position in a line array, and optionally removes a label associated with that line
@description Removes a bullish line from a specified position in a line array, and optionally removes a label associated with that line.
Parameters:
i (int)
bulllinearray (line )
failarray (float )
bulllabelarray (label )
labelon (bool)
bearoffsetdelete(i, bearlinearray, failarray, bearlabelarray, labelon)
Removes a bearish line from a specified position in a line array, and optionally removes a label associated with that line
@description Removes a bearish line from a specified position in a line array, and optionally removes a label associated with that line.
Parameters:
i (int)
bearlinearray (line )
failarray (float )
bearlabelarray (label )
labelon (bool)
BullEntry_setter(i, bulllinearray, failpointB, entrystopB, entryB, entryboolB)
Checks if the specified value is greater than the break point of any bullish line in an array, and removes that line if true
@description Checks if the s pecified value is greater than the break point of any bullish line in an array, and removes that line if true.
Parameters:
i (int)
bulllinearray (line )
failpointB (float )
entrystopB (float )
entryB (float )
entryboolB (bool )
Bull3CRchecker(close1, bulllinearray, FailpointB, rsiB, bulllabelarray, labelt, bullcolored, directionarray, rsi, secondbullline, entrystopB, entryB, entryboolB)
Parameters:
close1 (float)
bulllinearray (line )
FailpointB (float )
rsiB (float )
bulllabelarray (label )
labelt (bool)
bullcolored (color)
directionarray (label )
rsi (float)
secondbullline (line )
entrystopB (float )
entryB (float )
entryboolB (bool )
Bear3CRchecker(close1, bearlinearray, FailpointB, bearlabelarray, labelt, bearcolored, directionarray, rsi, secondbearline, rsiB)
Checks if the specified value is less than the break point of any bearish line in an array, and removes that line if true
@description Checks if the specified value is less than the break point of any bearish line in an array, and removes that line if true.
Parameters:
close1 (float)
bearlinearray (line )
FailpointB (float )
bearlabelarray (label )
labelt (bool)
bearcolored (color)
directionarray (label )
rsi (float)
secondbearline (line )
rsiB (float )
Bulloffsetcheck(FailpointB, bulllabelarray, linearray, labelt, offset)
Checks the offset of bullish lines and deletes them if they are beyond a certain offset from the current bar index
@description Checks the offset of bullish lines and deletes them if they are beyond a certain offset from the current bar index
Parameters:
FailpointB (float )
bulllabelarray (label )
linearray (line )
labelt (bool)
offset (int)
Bearoffsetcheck(FailpointB, bearlabelarray, linearray, labelt, offset)
Checks the offset of bearish lines and deletes them if they are beyond a certain offset from the current bar index
@description Checks the offset of bearish lines and deletes them if they are beyond a certain offset from the current bar index
Parameters:
FailpointB (float )
bearlabelarray (label )
linearray (line )
labelt (bool)
offset (int)
Bullfailchecker(close1, FailpointB, bulllabelarray, linearray, labelt)
Checks if the current price has crossed above a bullish fail point and deletes the corresponding line and label
@description Checks if the current price has crossed above a bullish fail point and deletes the corresponding line and label
Parameters:
close1 (float)
FailpointB (float )
bulllabelarray (label )
linearray (line )
labelt (bool)
Bearfailchecker(close1, FailpointB, bearlabelarray, linearray, labelt)
Checks for bearish lines that have failed to trigger and removes them from the chart
@description This function checks for bearish lines that have failed to trigger (i.e., where the current price is above the fail point) and removes them from the chart along with any associated label.
Parameters:
close1 (float)
FailpointB (float )
bearlabelarray (label )
linearray (line )
labelt (bool)
rsibullchecker(rsiinput, rsiBull, secondbullline)
Checks for bullish RSI lines that have failed to trigger and removes them from the chart
@description This function checks for bullish RSI lines that have failed to trigger (i.e., where the current RSI value is below the line's trigger level) and removes them from the chart along with any associated line.
Parameters:
rsiinput (float)
rsiBull (float )
secondbullline (line )
rsibearchecker(rsiinput, rsiBear, secondbearline)
Checks for bearish RSI lines that have failed to trigger and removes them from the chart
@description This function checks for bearish RSI lines that have failed to trigger (i.e., where the current RSI value is above the line's trigger level) and removes them from the chart along with any associated line.
Parameters:
rsiinput (float)
rsiBear (float )
secondbearline (line )

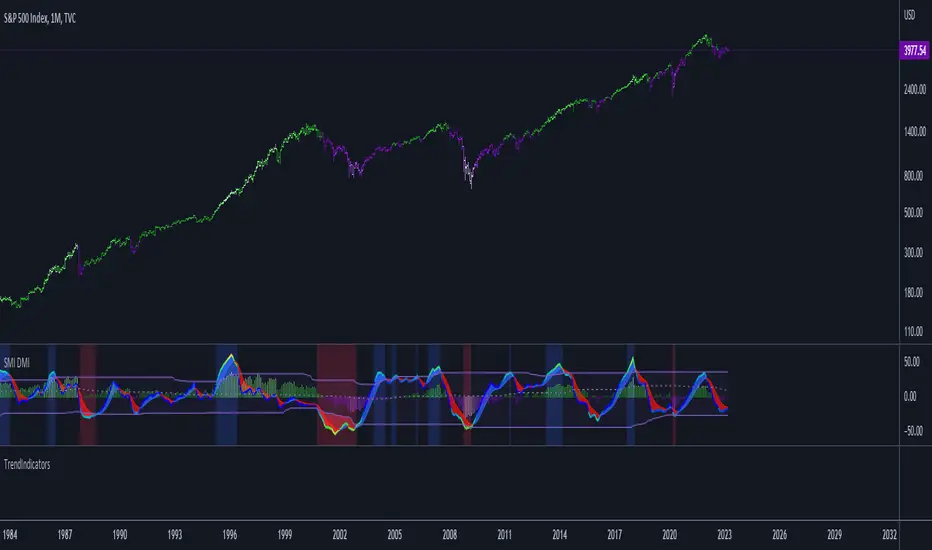
TrendIndicatorsLibrary "TrendIndicators"
This is a library of 'Trend Indicators'.
It aims to facilitate the grouping of this category of indicators, and also offer the customized supply of
the source, not being restricted to just the closing price.
Indicators (this is a work in progress):
1. Absolute DI (Directional Moviment Index) (Difference between DI+ and DI-).
Used in 'DMI Stochastic Extreme' by Barbara Star.
2. DMI
DI_Abs(lengthDI, smoothDI, typeMA, lengthMA)
@description Absolute DI (Directional Moviment Index).
Used in 'DMI Stochastic Extreme' by Barbara Star.
Difference between DI+ and DI-
Parameters:
lengthDI : (int) Length of DI+/DI-
smoothDI : (bool) Sets whether absolute DI should be smoothed
typeMA : (int) Type of moving average of smoothing
lengthMA : (int) Length for moving average of smoothing
Returns: (float) Absolute value of DI
dmi(diLength, adxSmoothing)
@description DMI (Directional Movement Index)
Same as ta.dmi()
Parameters:
diLength : (int) Length of DI+/DI-
adxSmoothing : (int) ADX Smoothing
Returns: Tuple of three DMI series: Positive Directional
Movement (+DI), Negative Directional Movement (-DI) and Average Directional Movement Index (ADX).
dmi(source, diLength, adxSmoothing)
@description DMI (Directional Movement Index)
Customized version of ta.dmi(), with custom source
Parameters:
source : (float) Source for DI+/DI-
diLength : (int) Length of DI+/DI-
adxSmoothing : (int) ADX Smoothing
Returns: Tuple of three DMI series: Positive Directional
Movement (+DI), Negative Directional Movement (-DI) and Average Directional Movement Index (ADX).
MomentumIndicatorsLibrary "MomentumIndicators"
This is a library of 'Momentum Indicators', also denominated as oscillators.
The purpose of this library is to organize momentum indicators in just one place, making it easy to access.
In addition, it aims to allow customized versions, not being restricted to just the price value.
An example of this use case is the popular Stochastic RSI.
# Indicators:
1. Relative Strength Index (RSI):
Measures the relative strength of recent price gains to recent price losses of an asset.
2. Rate of Change (ROC):
Measures the percentage change in price of an asset over a specified time period.
3. Stochastic Oscillator (Stoch):
Compares the current price of an asset to its price range over a specified time period.
4. True Strength Index (TSI):
Measures the price change, calculating the ratio of the price change (positive or negative) in relation to the
absolute price change.
The values of both are smoothed twice to reduce noise, and the final result is normalized
in a range between 100 and -100.
5. Stochastic Momentum Index (SMI):
Combination of the True Strength Index with a signal line to help identify turning points in the market.
6. Williams Percent Range (Williams %R):
Compares the current price of an asset to its highest high and lowest low over a specified time period.
7. Commodity Channel Index (CCI):
Measures the relationship between an asset's current price and its moving average.
8. Ultimate Oscillator (UO):
Combines three different time periods to help identify possible reversal points.
9. Moving Average Convergence/Divergence (MACD):
Shows the difference between short-term and long-term exponential moving averages.
10. Fisher Transform (FT):
Normalize prices into a Gaussian normal distribution.
11. Inverse Fisher Transform (IFT):
Transform the values of the Fisher Transform into a smaller and more easily interpretable scale is through the
application of an inverse transformation to the hyperbolic tangent function.
This transformation takes the values of the FT, which range from -infinity to +infinity, to a scale limited
between -1 and +1, allowing them to be more easily visualized and compared.
12. Premier Stochastic Oscillator (PSO):
Normalizes the standard stochastic oscillator by applying a five-period double exponential smoothing average of
the %K value, resulting in a symmetric scale of 1 to -1
# Indicators of indicators:
## Stochastic:
1. Stochastic of RSI (Relative Strengh Index)
2. Stochastic of ROC (Rate of Change)
3. Stochastic of UO (Ultimate Oscillator)
4. Stochastic of TSI (True Strengh Index)
5. Stochastic of Williams R%
6. Stochastic of CCI (Commodity Channel Index).
7. Stochastic of MACD (Moving Average Convergence/Divergence)
8. Stochastic of FT (Fisher Transform)
9. Stochastic of Volume
10. Stochastic of MFI (Money Flow Index)
11. Stochastic of On OBV (Balance Volume)
12. Stochastic of PVI (Positive Volume Index)
13. Stochastic of NVI (Negative Volume Index)
14. Stochastic of PVT (Price-Volume Trend)
15. Stochastic of VO (Volume Oscillator)
16. Stochastic of VROC (Volume Rate of Change)
## Inverse Fisher Transform:
1.Inverse Fisher Transform on RSI (Relative Strengh Index)
2.Inverse Fisher Transform on ROC (Rate of Change)
3.Inverse Fisher Transform on UO (Ultimate Oscillator)
4.Inverse Fisher Transform on Stochastic
5.Inverse Fisher Transform on TSI (True Strength Index)
6.Inverse Fisher Transform on CCI (Commodity Channel Index)
7.Inverse Fisher Transform on Fisher Transform (FT)
8.Inverse Fisher Transform on MACD (Moving Average Convergence/Divergence)
9.Inverse Fisher Transfor on Williams R% (Williams Percent Range)
10.Inverse Fisher Transfor on CMF (Chaikin Money Flow)
11.Inverse Fisher Transform on VO (Volume Oscillator)
12.Inverse Fisher Transform on VROC (Volume Rate of Change)
## Stochastic Momentum Index:
1.Stochastic Momentum Index of RSI (Relative Strength Index)
2.Stochastic Momentum Index of ROC (Rate of Change)
3.Stochastic Momentum Index of VROC (Volume Rate of Change)
4.Stochastic Momentum Index of Williams R% (Williams Percent Range)
5.Stochastic Momentum Index of FT (Fisher Transform)
6.Stochastic Momentum Index of CCI (Commodity Channel Index)
7.Stochastic Momentum Index of UO (Ultimate Oscillator)
8.Stochastic Momentum Index of MACD (Moving Average Convergence/Divergence)
9.Stochastic Momentum Index of Volume
10.Stochastic Momentum Index of MFI (Money Flow Index)
11.Stochastic Momentum Index of CMF (Chaikin Money Flow)
12.Stochastic Momentum Index of On Balance Volume (OBV)
13.Stochastic Momentum Index of Price-Volume Trend (PVT)
14.Stochastic Momentum Index of Volume Oscillator (VO)
15.Stochastic Momentum Index of Positive Volume Index (PVI)
16.Stochastic Momentum Index of Negative Volume Index (NVI)
## Relative Strength Index:
1. RSI for Volume
2. RSI for Moving Average
rsi(source, length)
RSI (Relative Strengh Index). Measures the relative strength of recent price gains to recent price losses of an asset.
Parameters:
source : (float) Source of series (close, high, low, etc.)
length : (int) Period of loopback
Returns: (float) Series of RSI
roc(source, length)
ROC (Rate of Change). Measures the percentage change in price of an asset over a specified time period.
Parameters:
source : (float) Source of series (close, high, low, etc.)
length : (int) Period of loopback
Returns: (float) Series of ROC
stoch(kLength, kSmoothing, dSmoothing, maTypeK, maTypeD, almaOffsetKD, almaSigmaKD, lsmaOffSetKD)
Stochastic Oscillator. Compares the current price of an asset to its price range over a specified time period.
Parameters:
kLength
kSmoothing : (int) Period for smoothig stochastic
dSmoothing : (int) Period for signal (moving average of stochastic)
maTypeK : (int) Type of Moving Average for Stochastic Oscillator
maTypeD : (int) Type of Moving Average for Stochastic Oscillator Signal
almaOffsetKD : (float) Offset for Arnaud Legoux Moving Average for Oscillator and Signal
almaSigmaKD : (float) Sigma for Arnaud Legoux Moving Average for Oscillator and Signal
lsmaOffSetKD : (int) Offset for Least Squares Moving Average for Oscillator and Signal
Returns: A tuple of Stochastic Oscillator and Moving Average of Stochastic Oscillator
stoch(source, kLength, kSmoothing, dSmoothing, maTypeK, maTypeD, almaOffsetKD, almaSigmaKD, lsmaOffSetKD)
Stochastic Oscillator. Customized source. Compares the current price of an asset to its price range over a specified time period.
Parameters:
source : (float) Source of series (close, high, low, etc.)
kLength : (int) Period of loopback to calculate the stochastic
kSmoothing : (int) Period for smoothig stochastic
dSmoothing : (int) Period for signal (moving average of stochastic)
maTypeK : (int) Type of Moving Average for Stochastic Oscillator
maTypeD : (int) Type of Moving Average for Stochastic Oscillator Signal
almaOffsetKD : (float) Offset for Arnaud Legoux Moving Average for Stoch and Signal
almaSigmaKD : (float) Sigma for Arnaud Legoux Moving Average for Stoch and Signal
lsmaOffSetKD : (int) Offset for Least Squares Moving Average for Stoch and Signal
Returns: A tuple of Stochastic Oscillator and Moving Average of Stochastic Oscillator
tsi(source, shortLength, longLength, maType, almaOffset, almaSigma, lsmaOffSet)
TSI (True Strengh Index). Measures the price change, calculating the ratio of the price change (positive or negative) in relation to the absolute price change.
The values of both are smoothed twice to reduce noise, and the final result is normalized in a range between 100 and -100.
Parameters:
source : (float) Source of series (close, high, low, etc.)
shortLength : (int) Short length
longLength : (int) Long length
maType : (int) Type of Moving Average for TSI
almaOffset : (float) Offset for Arnaud Legoux Moving Average
almaSigma : (float) Sigma for Arnaud Legoux Moving Average
lsmaOffSet : (int) Offset for Least Squares Moving Average
Returns: (float) TSI
smi(sourceTSI, shortLengthTSI, longLengthTSI, maTypeTSI, almaOffsetTSI, almaSigmaTSI, lsmaOffSetTSI, maTypeSignal, smoothingLengthSignal, almaOffsetSignal, almaSigmaSignal, lsmaOffSetSignal)
SMI (Stochastic Momentum Index). A TSI (True Strengh Index) plus a signal line.
Parameters:
sourceTSI : (float) Source of series for TSI (close, high, low, etc.)
shortLengthTSI : (int) Short length for TSI
longLengthTSI : (int) Long length for TSI
maTypeTSI : (int) Type of Moving Average for Signal of TSI
almaOffsetTSI : (float) Offset for Arnaud Legoux Moving Average
almaSigmaTSI : (float) Sigma for Arnaud Legoux Moving Average
lsmaOffSetTSI : (int) Offset for Least Squares Moving Average
maTypeSignal
smoothingLengthSignal
almaOffsetSignal
almaSigmaSignal
lsmaOffSetSignal
Returns: A tuple with TSI, signal of TSI and histogram of difference
wpr(source, length)
Williams R% (Williams Percent Range). Compares the current price of an asset to its highest high and lowest low over a specified time period.
Parameters:
source : (float) Source of series (close, high, low, etc.)
length : (int) Period of loopback
Returns: (float) Series of Williams R%
cci(source, length, maType, almaOffset, almaSigma, lsmaOffSet)
CCI (Commodity Channel Index). Measures the relationship between an asset's current price and its moving average.
Parameters:
source : (float) Source of series (close, high, low, etc.)
length : (int) Period of loopback
maType : (int) Type of Moving Average
almaOffset : (float) Offset for Arnaud Legoux Moving Average
almaSigma : (float) Sigma for Arnaud Legoux Moving Average
lsmaOffSet : (int) Offset for Least Squares Moving Average
Returns: (float) Series of CCI
ultimateOscillator(fastLength, middleLength, slowLength)
UO (Ultimate Oscilator). Combines three different time periods to help identify possible reversal points.
Parameters:
fastLength : (int) Fast period of loopback
middleLength : (int) Middle period of loopback
slowLength : (int) Slow period of loopback
Returns: (float) Series of Ultimate Oscilator
ultimateOscillator(source, fastLength, middleLength, slowLength)
UO (Ultimate Oscilator). Customized source. Combines three different time periods to help identify possible reversal points.
Parameters:
source : (float) Source of series (close, high, low, etc.)
fastLength : (int) Fast period of loopback
middleLength : (int) Middle period of loopback
slowLength : (int) Slow period of loopback
Returns: (float) Series of Ultimate Oscilator
macd(source, fastLength, slowLength, signalLength, maTypeFast, maTypeSlow, maTypeMACD, almaOffset, almaSigma, lsmaOffSet)
MACD (Moving Average Convergence/Divergence). Shows the difference between short-term and long-term exponential moving averages.
Parameters:
source : (float) Source of series (close, high, low, etc.)
fastLength : (int) Period for fast moving average
slowLength : (int) Period for slow moving average
signalLength : (int) Signal length
maTypeFast : (int) Type of fast moving average
maTypeSlow : (int) Type of slow moving average
maTypeMACD : (int) Type of MACD moving average
almaOffset : (float) Offset for Arnaud Legoux Moving Average
almaSigma : (float) Sigma for Arnaud Legoux Moving Average
lsmaOffSet : (int) Offset for Least Squares Moving Average
Returns: A tuple with MACD, Signal, and Histgram
fisher(length)
Fisher Transform. Normalize prices into a Gaussian normal distribution.
Parameters:
length
Returns: A tuple with Fisher Transform and signal
fisher(source, length)
Fisher Transform. Customized source. Normalize prices into a Gaussian normal distribution.
Parameters:
source : (float) Source of series (close, high, low, etc.)
length
Returns: A tuple with Fisher Transform and signal
inverseFisher(source, length, subtrahend, denominator)
Inverse Fisher Transform.
Transform the values of the Fisher Transform into a smaller and more easily interpretable scale is
through the application of an inverse transformation to the hyperbolic tangent function.
This transformation takes the values of the FT, which range from -infinity to +infinity,
to a scale limited between -1 and +1, allowing them to be more easily visualized and compared.
Parameters:
source : (float) Source of series (close, high, low, etc.)
length : (int) Period for loopback
subtrahend : (int) Denominator. Useful in unbounded indicators. For example, in CCI.
denominator
Returns: (float) Series of Inverse Fisher Transform
premierStoch(length, smoothlen)
Premier Stochastic Oscillator (PSO).
Normalizes the standard stochastic oscillator by applying a five-period double exponential smoothing
average of the %K value, resulting in a symmetric scale of 1 to -1.
Parameters:
length : (int) Period for loopback
smoothlen : (int) Period for smoothing
Returns: (float) Series of PSO
premierStoch(source, smoothlen, subtrahend, denominator)
Premier Stochastic Oscillator (PSO) of custom source.
Normalizes the source by applying a five-period double exponential smoothing average.
Parameters:
source : (float) Source of series (close, high, low, etc.)
smoothlen : (int) Period for smoothing
subtrahend : (int) Denominator. Useful in unbounded indicators. For example, in CCI.
denominator
Returns: (float) Series of PSO
stochRsi(sourceRSI, lengthRSI, kLength, kSmoothing, dSmoothing, maTypeK, maTypeD, almaOffsetKD, almaSigmaKD, lsmaOffSetKD)
Parameters:
sourceRSI
lengthRSI
kLength
kSmoothing
dSmoothing
maTypeK
maTypeD
almaOffsetKD
almaSigmaKD
lsmaOffSetKD
stochRoc(sourceROC, lengthROC, kLength, kSmoothing, dSmoothing, maTypeK, maTypeD, almaOffsetKD, almaSigmaKD, lsmaOffSetKD)
Parameters:
sourceROC
lengthROC
kLength
kSmoothing
dSmoothing
maTypeK
maTypeD
almaOffsetKD
almaSigmaKD
lsmaOffSetKD
stochUO(fastLength, middleLength, slowLength, kLength, kSmoothing, dSmoothing, maTypeK, maTypeD, almaOffsetKD, almaSigmaKD, lsmaOffSetKD)
Parameters:
fastLength
middleLength
slowLength
kLength
kSmoothing
dSmoothing
maTypeK
maTypeD
almaOffsetKD
almaSigmaKD
lsmaOffSetKD
stochTSI(source, shortLength, longLength, maType, almaOffset, almaSigma, lsmaOffSet, kLength, kSmoothing, dSmoothing, maTypeK, maTypeD, almaOffsetKD, almaSigmaKD, lsmaOffSetKD)
Parameters:
source
shortLength
longLength
maType
almaOffset
almaSigma
lsmaOffSet
kLength
kSmoothing
dSmoothing
maTypeK
maTypeD
almaOffsetKD
almaSigmaKD
lsmaOffSetKD
stochWPR(source, length, kLength, kSmoothing, dSmoothing, maTypeK, maTypeD, almaOffsetKD, almaSigmaKD, lsmaOffSetKD)
Parameters:
source
length
kLength
kSmoothing
dSmoothing
maTypeK
maTypeD
almaOffsetKD
almaSigmaKD
lsmaOffSetKD
stochCCI(source, length, maType, almaOffset, almaSigma, lsmaOffSet, kLength, kSmoothing, dSmoothing, maTypeK, maTypeD, almaOffsetKD, almaSigmaKD, lsmaOffSetKD)
Parameters:
source
length
maType
almaOffset
almaSigma
lsmaOffSet
kLength
kSmoothing
dSmoothing
maTypeK
maTypeD
almaOffsetKD
almaSigmaKD
lsmaOffSetKD
stochMACD(source, fastLength, slowLength, signalLength, maTypeFast, maTypeSlow, maTypeMACD, almaOffset, almaSigma, lsmaOffSet, kLength, kSmoothing, dSmoothing, maTypeK, maTypeD, almaOffsetKD, almaSigmaKD, lsmaOffSetKD)
Parameters:
source
fastLength
slowLength
signalLength
maTypeFast
maTypeSlow
maTypeMACD
almaOffset
almaSigma
lsmaOffSet
kLength
kSmoothing
dSmoothing
maTypeK
maTypeD
almaOffsetKD
almaSigmaKD
lsmaOffSetKD
stochFT(length, kLength, kSmoothing, dSmoothing, maTypeK, maTypeD, almaOffsetKD, almaSigmaKD, lsmaOffSetKD)
Parameters:
length
kLength
kSmoothing
dSmoothing
maTypeK
maTypeD
almaOffsetKD
almaSigmaKD
lsmaOffSetKD
stochVolume(kLength, kSmoothing, dSmoothing, maTypeK, maTypeD, almaOffsetKD, almaSigmaKD, lsmaOffSetKD)
Parameters:
kLength
kSmoothing
dSmoothing
maTypeK
maTypeD
almaOffsetKD
almaSigmaKD
lsmaOffSetKD
stochMFI(source, length, kLength, kSmoothing, dSmoothing, maTypeK, maTypeD, almaOffsetKD, almaSigmaKD, lsmaOffSetKD)
Parameters:
source
length
kLength
kSmoothing
dSmoothing
maTypeK
maTypeD
almaOffsetKD
almaSigmaKD
lsmaOffSetKD
stochOBV(source, kLength, kSmoothing, dSmoothing, maTypeK, maTypeD, almaOffsetKD, almaSigmaKD, lsmaOffSetKD)
Parameters:
source
kLength
kSmoothing
dSmoothing
maTypeK
maTypeD
almaOffsetKD
almaSigmaKD
lsmaOffSetKD
stochPVI(source, kLength, kSmoothing, dSmoothing, maTypeK, maTypeD, almaOffsetKD, almaSigmaKD, lsmaOffSetKD)
Parameters:
source
kLength
kSmoothing
dSmoothing
maTypeK
maTypeD
almaOffsetKD
almaSigmaKD
lsmaOffSetKD
stochNVI(source, kLength, kSmoothing, dSmoothing, maTypeK, maTypeD, almaOffsetKD, almaSigmaKD, lsmaOffSetKD)
Parameters:
source
kLength
kSmoothing
dSmoothing
maTypeK
maTypeD
almaOffsetKD
almaSigmaKD
lsmaOffSetKD
stochPVT(source, kLength, kSmoothing, dSmoothing, maTypeK, maTypeD, almaOffsetKD, almaSigmaKD, lsmaOffSetKD)
Parameters:
source
kLength
kSmoothing
dSmoothing
maTypeK
maTypeD
almaOffsetKD
almaSigmaKD
lsmaOffSetKD
stochVO(shortLen, longLen, maType, almaOffset, almaSigma, lsmaOffSet, kLength, kSmoothing, dSmoothing, maTypeK, maTypeD, almaOffsetKD, almaSigmaKD, lsmaOffSetKD)
Parameters:
shortLen
longLen
maType
almaOffset
almaSigma
lsmaOffSet
kLength
kSmoothing
dSmoothing
maTypeK
maTypeD
almaOffsetKD
almaSigmaKD
lsmaOffSetKD
stochVROC(length, kLength, kSmoothing, dSmoothing, maTypeK, maTypeD, almaOffsetKD, almaSigmaKD, lsmaOffSetKD)
Parameters:
length
kLength
kSmoothing
dSmoothing
maTypeK
maTypeD
almaOffsetKD
almaSigmaKD
lsmaOffSetKD
iftRSI(sourceRSI, lengthRSI, lengthIFT)
Parameters:
sourceRSI
lengthRSI
lengthIFT
iftROC(sourceROC, lengthROC, lengthIFT)
Parameters:
sourceROC
lengthROC
lengthIFT
iftUO(fastLength, middleLength, slowLength, lengthIFT)
Parameters:
fastLength
middleLength
slowLength
lengthIFT
iftStoch(kLength, kSmoothing, dSmoothing, maTypeK, maTypeD, almaOffsetKD, almaSigmaKD, lsmaOffSetKD, lengthIFT)
Parameters:
kLength
kSmoothing
dSmoothing
maTypeK
maTypeD
almaOffsetKD
almaSigmaKD
lsmaOffSetKD
lengthIFT
iftTSI(source, shortLength, longLength, maType, almaOffset, almaSigma, lsmaOffSet, lengthIFT)
Parameters:
source
shortLength
longLength
maType
almaOffset
almaSigma
lsmaOffSet
lengthIFT
iftCCI(source, length, maType, almaOffset, almaSigma, lsmaOffSet, lengthIFT)
Parameters:
source
length
maType
almaOffset
almaSigma
lsmaOffSet
lengthIFT
iftFisher(length, lengthIFT)
Parameters:
length
lengthIFT
iftMACD(source, fastLength, slowLength, signalLength, maTypeFast, maTypeSlow, maTypeMACD, almaOffset, almaSigma, lsmaOffSet, lengthIFT)
Parameters:
source
fastLength
slowLength
signalLength
maTypeFast
maTypeSlow
maTypeMACD
almaOffset
almaSigma
lsmaOffSet
lengthIFT
iftWPR(source, length, lengthIFT)
Parameters:
source
length
lengthIFT
iftMFI(source, length, lengthIFT)
Parameters:
source
length
lengthIFT
iftCMF(length, lengthIFT)
Parameters:
length
lengthIFT
iftVO(shortLen, longLen, maType, almaOffset, almaSigma, lsmaOffSet, lengthIFT)
Parameters:
shortLen
longLen
maType
almaOffset
almaSigma
lsmaOffSet
lengthIFT
iftVROC(length, lengthIFT)
Parameters:
length
lengthIFT
smiRSI(source, length, shortLengthTSI, longLengthTSI, maTypeTSI, almaOffsetTSI, almaSigmaTSI, lsmaOffSetTSI, maTypeSignal, smoothingLengthSignal, almaOffsetSignal, almaSigmaSignal, lsmaOffSetSignal)
Parameters:
source
length
shortLengthTSI
longLengthTSI
maTypeTSI
almaOffsetTSI
almaSigmaTSI
lsmaOffSetTSI
maTypeSignal
smoothingLengthSignal
almaOffsetSignal
almaSigmaSignal
lsmaOffSetSignal
smiROC(source, length, shortLengthTSI, longLengthTSI, maTypeTSI, almaOffsetTSI, almaSigmaTSI, lsmaOffSetTSI, maTypeSignal, smoothingLengthSignal, almaOffsetSignal, almaSigmaSignal, lsmaOffSetSignal)
Parameters:
source
length
shortLengthTSI
longLengthTSI
maTypeTSI
almaOffsetTSI
almaSigmaTSI
lsmaOffSetTSI
maTypeSignal
smoothingLengthSignal
almaOffsetSignal
almaSigmaSignal
lsmaOffSetSignal
smiVROC(length, shortLengthTSI, longLengthTSI, maTypeTSI, almaOffsetTSI, almaSigmaTSI, lsmaOffSetTSI, maTypeSignal, smoothingLengthSignal, almaOffsetSignal, almaSigmaSignal, lsmaOffSetSignal)
Parameters:
length
shortLengthTSI
longLengthTSI
maTypeTSI
almaOffsetTSI
almaSigmaTSI
lsmaOffSetTSI
maTypeSignal
smoothingLengthSignal
almaOffsetSignal
almaSigmaSignal
lsmaOffSetSignal
smiWPR(source, length, shortLengthTSI, longLengthTSI, maTypeTSI, almaOffsetTSI, almaSigmaTSI, lsmaOffSetTSI, maTypeSignal, smoothingLengthSignal, almaOffsetSignal, almaSigmaSignal, lsmaOffSetSignal)
Parameters:
source
length
shortLengthTSI
longLengthTSI
maTypeTSI
almaOffsetTSI
almaSigmaTSI
lsmaOffSetTSI
maTypeSignal
smoothingLengthSignal
almaOffsetSignal
almaSigmaSignal
lsmaOffSetSignal
smiFT(length, shortLengthTSI, longLengthTSI, maTypeTSI, almaOffsetTSI, almaSigmaTSI, lsmaOffSetTSI, maTypeSignal, smoothingLengthSignal, almaOffsetSignal, almaSigmaSignal, lsmaOffSetSignal)
Parameters:
length
shortLengthTSI
longLengthTSI
maTypeTSI
almaOffsetTSI
almaSigmaTSI
lsmaOffSetTSI
maTypeSignal
smoothingLengthSignal
almaOffsetSignal
almaSigmaSignal
lsmaOffSetSignal
smiFT(source, length, shortLengthTSI, longLengthTSI, maTypeTSI, almaOffsetTSI, almaSigmaTSI, lsmaOffSetTSI, maTypeSignal, smoothingLengthSignal, almaOffsetSignal, almaSigmaSignal, lsmaOffSetSignal)
Parameters:
source
length
shortLengthTSI
longLengthTSI
maTypeTSI
almaOffsetTSI
almaSigmaTSI
lsmaOffSetTSI
maTypeSignal
smoothingLengthSignal
almaOffsetSignal
almaSigmaSignal
lsmaOffSetSignal
smiCCI(source, length, maTypeCCI, almaOffsetCCI, almaSigmaCCI, lsmaOffSetCCI, shortLengthTSI, longLengthTSI, maTypeTSI, almaOffsetTSI, almaSigmaTSI, lsmaOffSetTSI, maTypeSignal, smoothingLengthSignal, almaOffsetSignal, almaSigmaSignal, lsmaOffSetSignal)
Parameters:
source
length
maTypeCCI
almaOffsetCCI
almaSigmaCCI
lsmaOffSetCCI
shortLengthTSI
longLengthTSI
maTypeTSI
almaOffsetTSI
almaSigmaTSI
lsmaOffSetTSI
maTypeSignal
smoothingLengthSignal
almaOffsetSignal
almaSigmaSignal
lsmaOffSetSignal
smiUO(fastLength, middleLength, slowLength, shortLengthTSI, longLengthTSI, maTypeTSI, almaOffsetTSI, almaSigmaTSI, lsmaOffSetTSI, maTypeSignal, smoothingLengthSignal, almaOffsetSignal, almaSigmaSignal, lsmaOffSetSignal)
Parameters:
fastLength
middleLength
slowLength
shortLengthTSI
longLengthTSI
maTypeTSI
almaOffsetTSI
almaSigmaTSI
lsmaOffSetTSI
maTypeSignal
smoothingLengthSignal
almaOffsetSignal
almaSigmaSignal
lsmaOffSetSignal
smiMACD(source, fastLength, slowLength, signalLength, maTypeFast, maTypeSlow, maTypeMACD, almaOffset, almaSigma, lsmaOffSet, shortLengthTSI, longLengthTSI, maTypeTSI, almaOffsetTSI, almaSigmaTSI, lsmaOffSetTSI, maTypeSignal, smoothingLengthSignal, almaOffsetSignal, almaSigmaSignal, lsmaOffSetSignal)
Parameters:
source
fastLength
slowLength
signalLength
maTypeFast
maTypeSlow
maTypeMACD
almaOffset
almaSigma
lsmaOffSet
shortLengthTSI
longLengthTSI
maTypeTSI
almaOffsetTSI
almaSigmaTSI
lsmaOffSetTSI
maTypeSignal
smoothingLengthSignal
almaOffsetSignal
almaSigmaSignal
lsmaOffSetSignal
smiVol(shortLengthTSI, longLengthTSI, maTypeTSI, almaOffsetTSI, almaSigmaTSI, lsmaOffSetTSI, maTypeSignal, smoothingLengthSignal, almaOffsetSignal, almaSigmaSignal, lsmaOffSetSignal)
Parameters:
shortLengthTSI
longLengthTSI
maTypeTSI
almaOffsetTSI
almaSigmaTSI
lsmaOffSetTSI
maTypeSignal
smoothingLengthSignal
almaOffsetSignal
almaSigmaSignal
lsmaOffSetSignal
smiMFI(source, length, shortLengthTSI, longLengthTSI, maTypeTSI, almaOffsetTSI, almaSigmaTSI, lsmaOffSetTSI, maTypeSignal, smoothingLengthSignal, almaOffsetSignal, almaSigmaSignal, lsmaOffSetSignal)
Parameters:
source
length
shortLengthTSI
longLengthTSI
maTypeTSI
almaOffsetTSI
almaSigmaTSI
lsmaOffSetTSI
maTypeSignal
smoothingLengthSignal
almaOffsetSignal
almaSigmaSignal
lsmaOffSetSignal
smiCMF(length, shortLengthTSI, longLengthTSI, maTypeTSI, almaOffsetTSI, almaSigmaTSI, lsmaOffSetTSI, maTypeSignal, smoothingLengthSignal, almaOffsetSignal, almaSigmaSignal, lsmaOffSetSignal)
Parameters:
length
shortLengthTSI
longLengthTSI
maTypeTSI
almaOffsetTSI
almaSigmaTSI
lsmaOffSetTSI
maTypeSignal
smoothingLengthSignal
almaOffsetSignal
almaSigmaSignal
lsmaOffSetSignal
smiOBV(source, shortLengthTSI, longLengthTSI, maTypeTSI, almaOffsetTSI, almaSigmaTSI, lsmaOffSetTSI, maTypeSignal, smoothingLengthSignal, almaOffsetSignal, almaSigmaSignal, lsmaOffSetSignal)
Parameters:
source
shortLengthTSI
longLengthTSI
maTypeTSI
almaOffsetTSI
almaSigmaTSI
lsmaOffSetTSI
maTypeSignal
smoothingLengthSignal
almaOffsetSignal
almaSigmaSignal
lsmaOffSetSignal
smiPVT(source, shortLengthTSI, longLengthTSI, maTypeTSI, almaOffsetTSI, almaSigmaTSI, lsmaOffSetTSI, maTypeSignal, smoothingLengthSignal, almaOffsetSignal, almaSigmaSignal, lsmaOffSetSignal)
Parameters:
source
shortLengthTSI
longLengthTSI
maTypeTSI
almaOffsetTSI
almaSigmaTSI
lsmaOffSetTSI
maTypeSignal
smoothingLengthSignal
almaOffsetSignal
almaSigmaSignal
lsmaOffSetSignal
smiVO(shortLen, longLen, maType, almaOffset, almaSigma, lsmaOffSet, shortLengthTSI, longLengthTSI, maTypeTSI, almaOffsetTSI, almaSigmaTSI, lsmaOffSetTSI, maTypeSignal, smoothingLengthSignal, almaOffsetSignal, almaSigmaSignal, lsmaOffSetSignal)
Parameters:
shortLen
longLen
maType
almaOffset
almaSigma
lsmaOffSet
shortLengthTSI
longLengthTSI
maTypeTSI
almaOffsetTSI
almaSigmaTSI
lsmaOffSetTSI
maTypeSignal
smoothingLengthSignal
almaOffsetSignal
almaSigmaSignal
lsmaOffSetSignal
smiPVI(source, shortLengthTSI, longLengthTSI, maTypeTSI, almaOffsetTSI, almaSigmaTSI, lsmaOffSetTSI, maTypeSignal, smoothingLengthSignal, almaOffsetSignal, almaSigmaSignal, lsmaOffSetSignal)
Parameters:
source
shortLengthTSI
longLengthTSI
maTypeTSI
almaOffsetTSI
almaSigmaTSI
lsmaOffSetTSI
maTypeSignal
smoothingLengthSignal
almaOffsetSignal
almaSigmaSignal
lsmaOffSetSignal
smiNVI(source, shortLengthTSI, longLengthTSI, maTypeTSI, almaOffsetTSI, almaSigmaTSI, lsmaOffSetTSI, maTypeSignal, smoothingLengthSignal, almaOffsetSignal, almaSigmaSignal, lsmaOffSetSignal)
Parameters:
source
shortLengthTSI
longLengthTSI
maTypeTSI
almaOffsetTSI
almaSigmaTSI
lsmaOffSetTSI
maTypeSignal
smoothingLengthSignal
almaOffsetSignal
almaSigmaSignal
lsmaOffSetSignal
rsiVolume(length)
Parameters:
length
rsiMA(sourceMA, lengthMA, maType, almaOffset, almaSigma, lsmaOffSet, lengthRSI)
Parameters:
sourceMA
lengthMA
maType
almaOffset
almaSigma
lsmaOffSet
lengthRSI

Commission-aware Trade LabelsCommission-aware Trade Labels
Description:
This library provides an easy way to visualize take-profit and stop-loss levels on your chart, taking into account trading commissions. The library calculates and displays the net profit or loss, along with other useful information such as risk/reward ratio, shares, and position size.
Features:
Configurable take-profit and stop-loss prices or percentages.
Set entry amount or shares.
Calculates and displays the risk/reward ratio.
Shows net profit or loss, considering trading commissions.
Customizable label appearance.
Usage:
Add the script to your chart.
Create an Order object for take-profit and stop-loss with desired configurations.
Call target_label() and stop_label() methods for each order object.
Example:
target_order = Order.new(take_profit_price=27483, stop_loss_price=28000, shares=0.2)
stop_order = Order.new(stop_loss_price=29000, shares=1)
target_order.target_label()
stop_order.stop_label()
This script is a powerful tool for visualizing your trading strategy's performance and helps you make better-informed decisions by considering trading commissions in your profit and loss calculations.
Library "tradelabels"
entry_price(this)
Parameters:
this : Order object
@return entry_price
take_profit_price(this)
Parameters:
this : Order object
@return take_profit_price
stop_loss_price(this)
Parameters:
this : Order object
@return stop_loss_price
is_long(this)
Parameters:
this : Order object
@return entry_price
is_short(this)
Parameters:
this : Order object
@return entry_price
percent_to_target(this, target)
Parameters:
this : Order object
target : Target price
@return percent
risk_reward(this)
Parameters:
this : Order object
@return risk_reward_ratio
shares(this)
Parameters:
this : Order object
@return shares
position_size(this)
Parameters:
this : Order object
@return position_size
commission_cost(this, target_price)
Parameters:
this : Order object
@return commission_cost
target_price
net_result(this, target_price)
Parameters:
this : Order object
target_price : The target price to calculate net result for (either take_profit_price or stop_loss_price)
@return net_result
create_take_profit_label(this, prefix, size, offset_x, bg_color, text_color)
Parameters:
this
prefix
size
offset_x
bg_color
text_color
create_stop_loss_label(this, prefix, size, offset_x, bg_color, text_color)
Parameters:
this
prefix
size
offset_x
bg_color
text_color
create_entry_label(this, prefix, size, offset_x, bg_color, text_color)
Parameters:
this
prefix
size
offset_x
bg_color
text_color
create_line(this, target_price, line_color, offset_x, line_style, line_width, draw_entry_line)
Parameters:
this
target_price
line_color
offset_x
line_style
line_width
draw_entry_line
Order
Order
Fields:
entry_price : Entry price
stop_loss_price : Stop loss price
stop_loss_percent : Stop loss percent, default 2%
take_profit_price : Take profit price
take_profit_percent : Take profit percent, default 6%
entry_amount : Entry amount, default 5000$
shares : Shares
commission : Commission, default 0.04%
Bitwise, Encode, DecodeLibrary "Bitwise, Encode, Decode"
Bitwise, Encode, Decode, and more Library
docs()
Hover-Over Documentation for inside Text Editor
bAnd(a, b)
Returns the bitwise AND of two integers
Parameters:
a : `int` - The first integer
b : `int` - The second integer
Returns: `int` - The bitwise AND of the two integers
bOr(a, b)
Performs a bitwise OR operation on two integers.
Parameters:
a : `int` - The first integer.
b : `int` - The second integer.
Returns: `int` - The result of the bitwise OR operation.
bXor(a, b)
Performs a bitwise Xor operation on two integers.
Parameters:
a : `int` - The first integer.
b : `int` - The second integer.
Returns: `int` - The result of the bitwise Xor operation.
bNot(n)
Performs a bitwise NOT operation on an integer.
Parameters:
n : `int` - The integer to perform the bitwise NOT operation on.
Returns: `int` - The result of the bitwise NOT operation.
bShiftLeft(n, step)
Performs a bitwise left shift operation on an integer.
Parameters:
n : `int` - The integer to perform the bitwise left shift operation on.
step : `int` - The number of positions to shift the bits to the left.
Returns: `int` - The result of the bitwise left shift operation.
bShiftRight(n, step)
Performs a bitwise right shift operation on an integer.
Parameters:
n : `int` - The integer to perform the bitwise right shift operation on.
step : `int` - The number of bits to shift by.
Returns: `int` - The result of the bitwise right shift operation.
bRotateLeft(n, step)
Performs a bitwise right shift operation on an integer.
Parameters:
n : `int` - The int to perform the bitwise Left rotation on the bits.
step : `int` - The number of bits to shift by.
Returns: `int`- The result of the bitwise right shift operation.
bRotateRight(n, step)
Performs a bitwise right shift operation on an integer.
Parameters:
n : `int` - The int to perform the bitwise Right rotation on the bits.
step : `int` - The number of bits to shift by.
Returns: `int` - The result of the bitwise right shift operation.
bSetCheck(n, pos)
Checks if the bit at the given position is set to 1.
Parameters:
n : `int` - The integer to check.
pos : `int` - The position of the bit to check.
Returns: `bool` - True if the bit is set to 1, False otherwise.
bClear(n, pos)
Clears a particular bit of an integer (changes from 1 to 0) passes if bit at pos is 0.
Parameters:
n : `int` - The integer to clear a bit from.
pos : `int` - The zero-based index of the bit to clear.
Returns: `int` - The result of clearing the specified bit.
bFlip0s(n)
Flips all 0 bits in the number to 1.
Parameters:
n : `int` - The integer to flip the bits of.
Returns: `int` - The result of flipping all 0 bits in the number.
bFlip1s(n)
Flips all 1 bits in the number to 0.
Parameters:
n : `int` - The integer to flip the bits of.
Returns: `int` - The result of flipping all 1 bits in the number.
bFlipAll(n)
Flips all bits in the number.
Parameters:
n : `int` - The integer to flip the bits of.
Returns: `int` - The result of flipping all bits in the number.
bSet(n, pos, newBit)
Changes the value of the bit at the given position.
Parameters:
n : `int` - The integer to modify.
pos : `int` - The position of the bit to change.
newBit : `int` - na = flips bit at pos reguardless 1 or 0 | The new value of the bit (0 or 1).
Returns: `int` - The modified integer.
changeDigit(n, pos, newDigit)
Changes the value of the digit at the given position.
Parameters:
n : `int` - The integer to modify.
pos : `int` - The position of the digit to change.
newDigit : `int` - The new value of the digit (0-9).
Returns: `int` - The modified integer.
bSwap(n, i, j)
Switch the position of 2 bits of an int
Parameters:
n : `int` - int to manipulate
i : `int` - bit pos to switch with j
j : `int` - bit pos to switch with i
Returns: `int` - new int with bits switched
bPalindrome(n)
Checks to see if the binary form is a Palindrome (reads the same left to right and vice versa)
Parameters:
n : `int` - int to check
Returns: `bool` - result of check
bEven(n)
Checks if n is Even
Parameters:
n : `int` - The integer to check.
Returns: `bool` - result.
bOdd(n)
checks if n is Even if not even Odd
Parameters:
n : `int` - The integer to check.
Returns: `bool` - result.
bPowerOfTwo(n)
Checks if n is a Power of 2.
Parameters:
n : `int` - number to check.
Returns: `bool` - result.
bCount(n, to_count)
Counts the number of bits that are equal to 1 in an integer.
Parameters:
n : `int` - The integer to count the bits in.
to_count `string` - the bits to count
Returns: `int` - The number of bits that are equal to 1 in n.
GCD(a, b)
Finds the greatest common divisor (GCD) of two numbers.
Parameters:
a : `int` - The first number.
b : `int` - The second number.
Returns: `int` - The GCD of a and b.
LCM(a, b)
Finds the least common multiple (LCM) of two integers.
Parameters:
a : `int` - The first integer.
b : `int` - The second integer.
Returns: `int` - The LCM of a and b.
aLCM(nums)
Finds the LCM of an array of integers.
Parameters:
nums : `int ` - The list of integers.
Returns: `int` - The LCM of the integers in nums.
adjustedLCM(nums, LCM)
adjust an array of integers to Least Common Multiple (LCM)
Parameters:
nums : `int ` - The first integer
LCM : `int` - The second integer
Returns: `int ` - array of ints with LCM
charAt(str, pos)
gets a Char at a given position.
Parameters:
str : `string` - string to pull char from.
pos : `int` - pos to get char from string (left to right index).
Returns: `string` - char from pos of string or "" if pos is not within index range
decimalToBinary(num)
Converts a decimal number to binary
Parameters:
num : `int` - The decimal number to convert to binary
Returns: `string` - The binary representation of the decimal number
decimalToBinary(num, to_binary_int)
Converts a decimal number to binary
Parameters:
num : `int` - The decimal number to convert to binary
to_binary_int : `bool` - bool to convert to int or to string (true for int, false for string)
Returns: `string` - The binary representation of the decimal number
binaryToDecimal(binary)
Converts a binary number to decimal
Parameters:
binary : `string` - The binary number to convert to decimal
Returns: `int` - The decimal representation of the binary number
decimal_len(n)
way of finding decimal length using arithmetic
Parameters:
n `float` - floating decimal point to get length of.
Returns: `int` - number of decimal places
int_len(n)
way of finding number length using arithmetic
Parameters:
n : `int`- value to find length of number
Returns: `int` - lenth of nunber i.e. 23 == 2
float_decimal_to_whole(n)
Converts a float decimal number to an integer `0.365 to 365`.
Parameters:
n : `string` - The decimal number represented as a string.
Returns: `int` - The integer obtained by removing the decimal point and leading zeroes from s.
fractional_part(x)
Returns the fractional part of a float.
Parameters:
x : `float` - The float to get the fractional part of.
Returns: `float` - The fractional part of the float.
form_decimal(a, b, zero_fix)
helper to form 2 ints into 1 float seperated by the decimal
Parameters:
a : `int` - a int
b : `int` - b int
zero_fix : `bool` - fix for trailing zeros being truncated when converting to float
Returns: ` ` - float = float decimal of ints | string = string version of b for future use to ref length
bEncode(n1, n2)
Encodes two numbers into one using bit OR. (fastest)
Parameters:
n1 : `int` - The first number to Encodes.
n2 : `int` - The second number to Encodes.
Returns: `int` - The result of combining the two numbers using bit OR.
bDecode(n)
Decodes an integer created by the bCombine function.(fastest)
Parameters:
n : `int` - The integer to decode.
Returns: ` ` - A tuple containing the two decoded components of the integer.
Encode(a, b)
Encodes by seperating ints into left and right of decimal float
Parameters:
a : `int` - a int
b : `int` - b int
Returns: `float` - new float of encoded ints one on left of decimal point one on right
Decode(encoded)
Decodes float of 2 ints seperated by decimal point
Parameters:
encoded : `float` - the encoded float value
Returns: ` ` - tuple of the 2 ints from encoded float
encode_heavy(a, b)
Encodes by combining numbers and tracking size in the
decimal of a floating number (slowest)
Parameters:
a : `int` - a int
b : `int` - b int
Returns: `float` - new decimal of encoded ints
decode_heavy(encoded)
Decodes encoded float that tracks size of ints in float decimal
Parameters:
encoded : `float` - encoded float
Returns: ` ` - tuple of decoded ints
decimal of float (slowest)
Parameters:
encoded : `float` - the encoded float value
Returns: ` ` - tuple of the 2 ints from encoded float
Bitwise, Encode, Decode Docs
In the documentation you may notice the word decimal
not used as normal this is because when referring to
binary a decimal number is a number that
can be represented with base 10 numbers 0-9
(the wiki below explains better)
A rule of thumb for the two integers being
encoded it to keep both numbers
less than 65535 this is because anything lower uses 16 bits or less
this will maintain 100% accuracy when decoding
although it is possible to do numbers up to 2147483645 with
this library doesnt seem useful enough
to explain or demonstrate.
The functions provided work within this 32-bit range,
where the highest number is all 1s and
the lowest number is all 0s. These functions were created
to overcome the lack of built-in bitwise functions in Pinescript.
By combining two integers into a single number,
the code can access both values i.e when
indexing only one array index
for a matrices row/column, thus improving execution time.
This technique can be applied to various coding
scenarios to enhance performance.
Bitwise functions are a way to use integers in binary form
that can be used to speed up several different processes
most languages have operators to perform these function such as
`<<, >>, &, ^, |, ~`
en.wikipedia.org
Simple Trendlines📈 Trendlines, made easy.
Simple Trendlines is a carefully made library that provides an easy and accessible way to draw trendlines on the chart.
Containing only 10 properties and 2 methods, the implementation is designed to be understandable through an object-oriented structure and provides developers the opportunity to expand without having to deal with slope calculation while also ensuring that there's no leakage between the trendlines before they're drawn.
Developers only need to provide 5 expressions to get everything up in running. This includes the following but is not limited to
The x-axis
Point A (Y1 Value)
Point B (Y2 Value)
A condition to draw the line
A condition to keep the trendline under continuation
Automatic x-axis calculation is not a built-in feature due to the inconsistency it could bring.
📕 Quick Example
import HoanGhetti/SimpleTrendlines/1 as tl
input_len = input.int(defval = 10)
pivotLow = fixnan(ta.pivotlow(input_len, input_len))
xAxis = ta.valuewhen(ta.change(pivotLow), bar_index, 0) - ta.valuewhen(ta.change(pivotLow), bar_index, 1)
prevPivot = ta.valuewhen(ta.change(pivotLow), pivotLow, 1)
pivotCondition = ta.change(pivotLow) and pivotLow > prevPivot
plData = tl.new(x_axis = xAxis, offset = input_len)
plData.drawLine(pivotCondition, prevPivot, pivotLow)
plData.drawTrendline(close > 0)
plData.lines.trendline.set_style(line.style_dashed)
plData.lines.trendline.set_width(2)
plData.lines.startline.set_width(2)
Excluding the styling at the bottom, that was only 8 lines of code which yields the following result.
⏳ Before continuing
The library does not support block-scoped execution. Conditions must be declared before and integrated as a parameter. This doesn't limit any capabilities and only involves thinking logically about precedence. It was made this way for code readability and to keep things organized.
The offset value inside the TrendlineSettings object can potentially affect performance (although very minimal) if you're using strict mode. When using strict mode, it loops through historical values to then do backend calculations.
🔽 Getting Started 🔽
Creating trendlines without a library isn't a hard task. However, the library features a built-in system called strict mode. We'll dive further into this below.
Creating an Instance
You can create an instance of the library by calling the new() function. Passing an identifier is conventionally mandatory in this case so you can reference properties and methods.
import HoanGhetti/SimpleTrendlines/2 as tl
lineData = tl.new(int x_axis, int offset, bool strictMode, int strictType)
___
int x_axis (Required) The distance between point A and point B provided by the user.
int offset (Optional) The offset from x2 and the current bar_index. Used in situations where conditions execute ahead of where the x2 location is such as pivót events.
bool strictMode (Optional) Strict mode works in the backend of things to ensure that the price hasn't closed below the trendline before the trendline is drawn.
int strictType (Optional) Only accepts 0 and 1, 0 ensures that the price during slope calculation is above the line, and 1 ensures that the price during slope calculation is below the line.
The Initial Line
After instantiating the library, we can go ahead use the identifer we made above and create an instance of our initial line by calling the drawLine() method.
lineData.drawLine(bool condition, float y1, float y2, float src)
___
bool condition (Required) The condition in order to draw a new line.
float y1 (Required) The y-value of point A.
float y2 (Required) The y-value of point B.
float src (Optional) Determines which value strict mode will actively check for leakage before a trendline is drawn.
Typically used if you're not referencing OHLC values for your y-values, or you want to check for another value to exceed the line besides using the close value.
The Trendline
The trendline that gets drawn solely uses the values of the initial line and can be called using the drawTrendline() method. The library enforces a condition as a parameter in order to maintain simplicity.
lineData.drawTrendline(bool condition)
___
bool condition (Required) The condition in order to maintain and continue drawing the trendline.
⚙️ Features
🔹 Automatic Slope Calculation
In the background, the library calculates the next Y2 and X2 values on every tick for the trendline. Preventing the developer from having to do such a process themself.
🔹 Object-Oriented
Each object contains manipulative properties that allow the developer to debug and have the freedom they want.
🔹 Enforced Error Checking
Runtime errors have been put in place to ensure you're doing things correctly.
🔹 Strict Mode & Offset
Strict mode can only be used when the offset value is over 0. It's a feature that's only meant to function under scenarios where a condition executes further than where the X2 is relative to the current bar_index value.
Let's think about pivot systems. As you're aware, pivot events are detected based on historical factors. If a swing low occurred nth bars ago, then the pivot condition will execute at the current bar_index instead of executing nth bars back.
Now because of this, what if you wanted to draw a trendline when the pivot event is executed? The offset value takes care of this just as you would when developing your other scripts, basically how we always do bar_index - n. However, what does this mean for strict mode?
The photo below represents the logic behind the execution.
When looking at this image, imagine this just happened, the event just executed and the trendline is now drawn. Pay attention to all the values inside the surrounding box. As you can see there are some candles that closed below the trendline before the trendline was drawn.
From what I can see 5-6 candles closed below the trendline during slope calculation. The goal of strict mode is to be a provisional system that prevents such occurrences from happening.
Here's a photo with strict mode on.
🔹 Strict Type
A parameter used in the new() function that acts as a representation of what strict mode should calculate for. It accepts only two values, 0 and 1.
0 - Ensures that all candles have closed above the trendline before the trendline is drawn.
1 - Ensures that all candles have closed below the trendline before the trendline is drawn.
In the most recent photo above, I used 0 for strict type, since I was wanting to have a clean trendline and ensure that not a single candlestick closed below.
If you want to reference something else besides the close value during strict mode calculation, you can change it in the drawLine() method.
If it's still difficult to understand, think 0 for pivot lows, and 1 for pivot highs.
📕 Methods and Property Inheritance
The library isn't crazy, but hopefully, it helps.
That is all.👍
