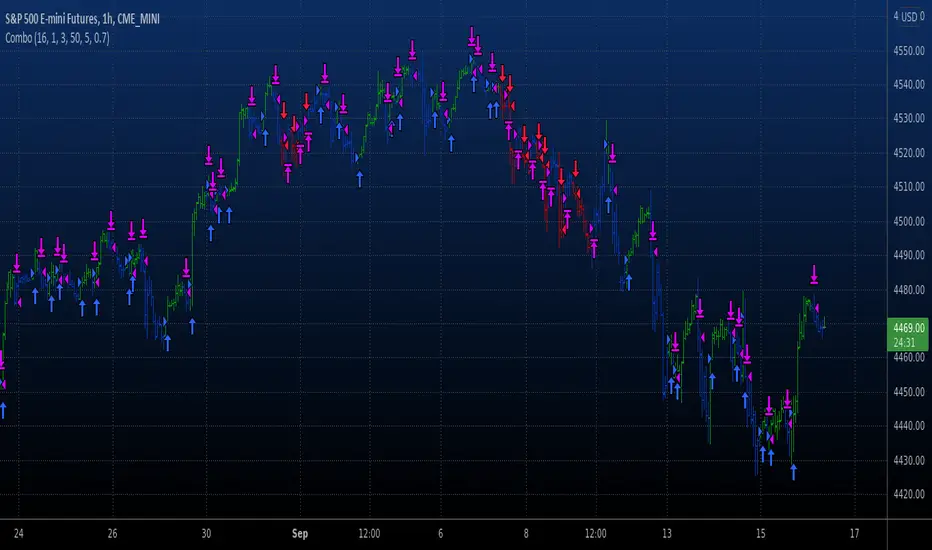
Combo Backtest 123 Reversal & T3 Averages This is combo strategies for get a cumulative signal.
First strategy
This System was created from the Book "How I Tripled My Money In The
Futures Market" by Ulf Jensen, Page 183. This is reverse type of strategies.
The strategy buys at market, if close price is higher than the previous close
during 2 days and the meaning of 9-days Stochastic Slow Oscillator is lower than 50.
The strategy sells at market, if close price is lower than the previous close price
during 2 days and the meaning of 9-days Stochastic Fast Oscillator is higher than 50.
Second strategy
This indicator plots the moving average described in the January, 1998 issue
of S&C, p.57, "Smoothing Techniques for More Accurate Signals", by Tim Tillson.
This indicator plots T3 moving average presented in Figure 4 in the article.
T3 indicator is a moving average which is calculated according to formula:
T3(n) = GD(GD(GD(n))),
where GD - generalized DEMA (Double EMA) and calculating according to this:
GD(n,v) = EMA(n) * (1+v)-EMA(EMA(n)) * v,
where "v" is volume factor, which determines how hot the moving average’s response
to linear trends will be. The author advises to use v=0.7.
When v = 0, GD = EMA, and when v = 1, GD = DEMA. In between, GD is a less aggressive
version of DEMA. By using a value for v less than1, trader cure the multiple DEMA
overshoot problem but at the cost of accepting some additional phase delay.
In filter theory terminology, T3 is a six-pole nonlinear Kalman filter. Kalman
filters are ones that use the error — in this case, (time series - EMA(n)) —
to correct themselves. In the realm of technical analysis, these are called adaptive
moving averages; they track the time series more aggres-sively when it is making large
moves. Tim Tillson is a software project manager at Hewlett-Packard, with degrees in
mathematics and computer science. He has privately traded options and equities for 15 years.
WARNING:
- For purpose educate only
- This script to change bars colors.
Média Móvel T3 (T3)
Swing/Scalper HULL + T3 avg Crypto StrategyThis is a both a swing and a scalper strategy(depends on the timeframe that you use), that works with all timeframes, however I noticed that with swing 3h works the best on most crypto pairs, such as ETH, BTC and so on.
Its main components are:
Hull moving average
T3 moving average
Risk management
With them I make an average and use it as the main moving average.
Rules for entry
For long: Average moving average is bigger than previous average moving average value.
For short:Average moving average is lower than previous average moving average value.
Rules for exit
We exit when either the TP/SL has been hit, or when we get a different condition than previous one(both for long and short).
If you have any questions, let me know !

T3MA_KC_7ye StrategyThis script uses KC and a T3 moving average
A red background is a bear market
A bull market is when the background is green
The main idea is the average of the bend and KC channel breakthrough
这个脚本使用了KC以及T3均线
背景为红色时是熊市
背景为绿色时是牛市
主要思路是均线的拐头以及KC通道的突破

Price action strategy FOREX with amazing results
Hello, today I bring another amazing strategy for forex .
Its made of T3 moving average , combined together with a pattern rule and a specific entry time.
We take all of that and we trade it in inverse.
So what normally for long would be : close higher than the previos high and close higher than the average, we use this as a short condition. We do the same stuff for long condition.
So in the end we end up with an amazing product.
It also has a risk management inside, with a TP/SL based on % move of the price .
Let me know how it goes .

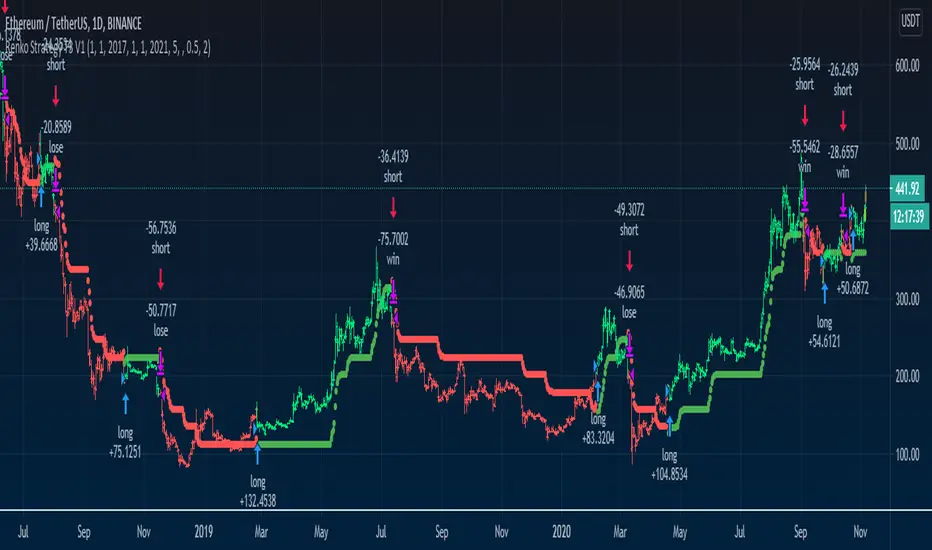
Renko Strategy T3 V1An interesting strategy using Renko calculations and Tilson T3 on normal charts targeted for cryptocurrencies but can work with different assets.
Tested on Daily but can work with lower frames using Renko Size and T3 Length adjustments.
== Description ==
Strategy get Renko close/open/high/low values and smooth them with T3 Tilson.
Base on these results the strategy triggers a long and short orders, where green uptrending and red downtrending.
Including Alerts
== Repaint ==
There seems to be some sort of inconsistency when doing 'Replay' function with the strategy, which means using Replay function won't trade like if you see the trading results without Replay. Regarding real time, it does not seem to repaint, besides that you need to wait for the last active bar to complete for it to give you indication.
You can disable strategy to use it has a sole indicator.
There might be a new strategy of Renko Strategy V2 in the future as i have an in progress prototype, Follow to get updated:
www.tradingview.com
Combo Backtest 123 Reversal & FX Sniper: T3-CCI This is combo strategies for get a cumulative signal.
First strategy
This System was created from the Book "How I Tripled My Money In The
Futures Market" by Ulf Jensen, Page 183. This is reverse type of strategies.
The strategy buys at market, if close price is higher than the previous close
during 2 days and the meaning of 9-days Stochastic Slow Oscillator is lower than 50.
The strategy sells at market, if close price is lower than the previous close price
during 2 days and the meaning of 9-days Stochastic Fast Oscillator is higher than 50.
Second strategy
This simple indicator gives you a lot of useful information - when to enter, when to exit
and how to reduce risks by entering a trade on a double confirmed signal.
You can use in the xPrice any series: Open, High, Low, Close, HL2, HLC3, OHLC4 and ect...
WARNING:
- For purpose educate only
- This script to change bars colors.

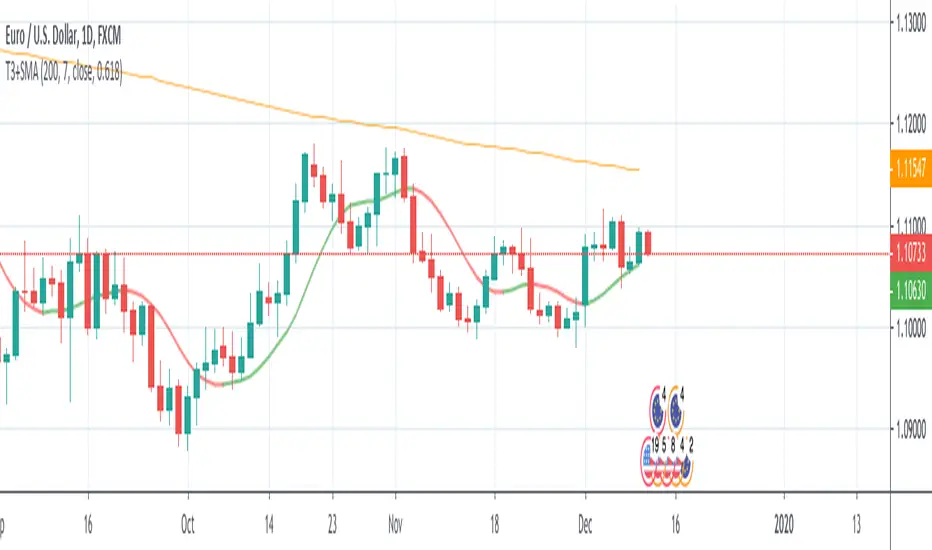
T3+SMA This source code is subject to the terms of the Mozilla Public License 2.0 at mozilla.org
© 03.freeman
This strategy is based only on T3 moving average, but uses sma 200 as filter for enter long or short.
The default settings considers a daily timeframe.
The strategy is very simple: long if T3 increase, short if T3 decrease.
Note that if you set volume factor to 0 you will have an exponential moving average, while if you set to 1 you'll get a DEMA.
RePaNoCHa V4 [Backtest]This is the Backtest version of the previous one.
It's important to correctly set the "TICKS / PIPS CORRECTION" parameter in each different chart.
Enjoy!

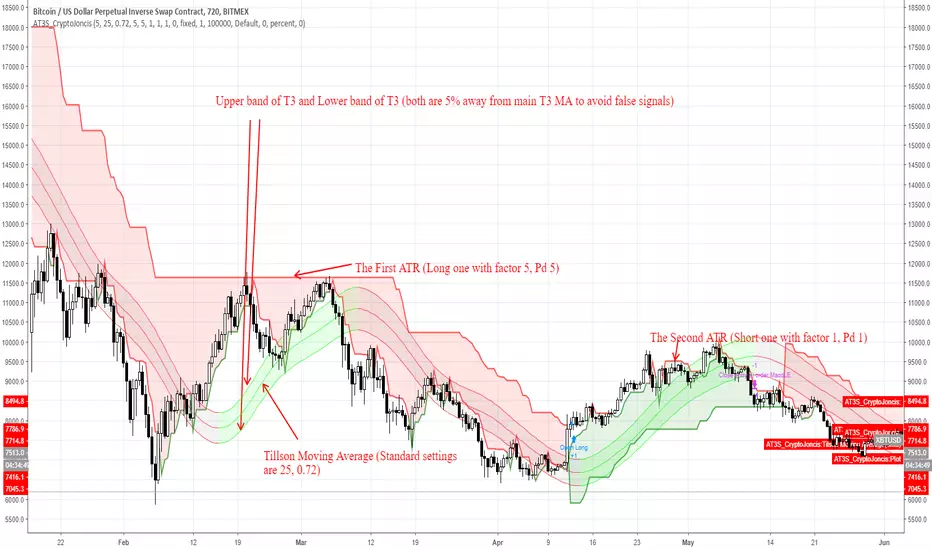
ATR and T3 strategyT3 Moving Average indicator was originally developed by Tim Tillson in 1998/99.
T3 Moving Average is considered as improved and better to traditional moving averages as it is smoother and performs better in trending market conditions.
It offers multiple opportunities when the price is in the state of retracement and therefore allows to minimize your exposed risk and allowing your profits run.
This strategy is for trend followers who are patient enough to have 6-10 trades per year.
What's included in strategy?
Two ATR (Code was taken from J.Dow and modified)
Tillson Moving average
Enter long signal:
When both ATR (Long and Short) are in uptrend and the bar closes above Upper Tillson's moving average band: Enter Long
Exit Long signal:
When hl2 is lower than Lower Tillson Moving Average band
Enter short signal:
When both ATR (Long and Short) are in downtrend and the bar closes below Lower Tillson's moving average band: Enter Short
Exit Shortsignal:
When hl2 is higher than Upper Tillson's Moving Average band
Best to use with Bitcoin on 12H TF
Can be used for different time frames as well but the settings must be adjusted accordingly
Remember, overtrading can be harmful to your trading account.
If this is helpful for you, consider a tip
BTC: 3FiBnveHo3YW6DSiPEmoCFCyCnsrWS3JBR
ETH: 0xac290B4A721f5ef75b0971F1102e01E1942A4578
Created by CryptoJoncis
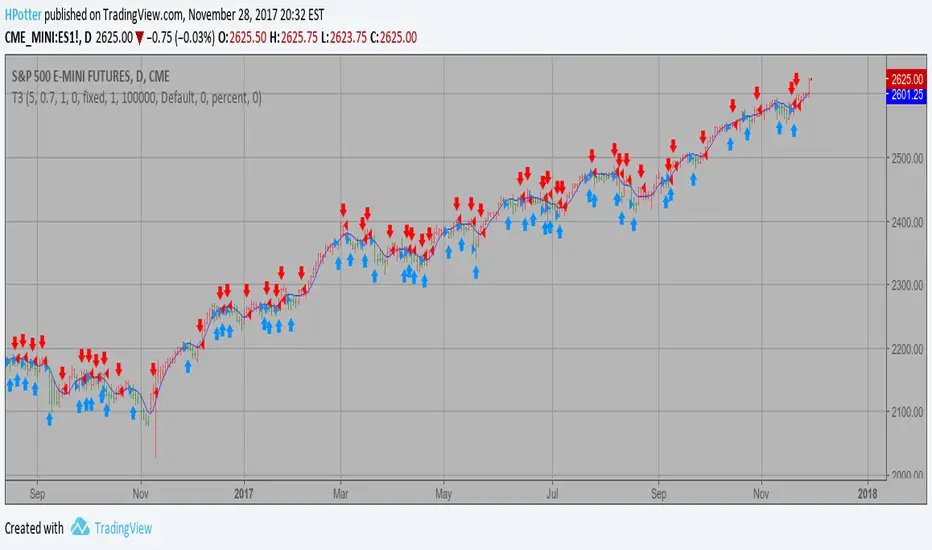
T3 Averages Backtest This indicator plots the moving average described in the January, 1998 issue
of S&C, p.57, "Smoothing Techniques for More Accurate Signals", by Tim Tillson.
This indicator plots T3 moving average presented in Figure 4 in the article.
T3 indicator is a moving average which is calculated according to formula:
T3(n) = GD(GD(GD(n))),
where GD - generalized DEMA (Double EMA) and calculating according to this:
GD(n,v) = EMA(n) * (1+v)-EMA(EMA(n)) * v,
where "v" is volume factor, which determines how hot the moving average’s response
to linear trends will be. The author advises to use v=0.7.
When v = 0, GD = EMA, and when v = 1, GD = DEMA. In between, GD is a less aggressive
version of DEMA. By using a value for v less than1, trader cure the multiple DEMA
overshoot problem but at the cost of accepting some additional phase delay.
In filter theory terminology, T3 is a six-pole nonlinear Kalman filter. Kalman
filters are ones that use the error — in this case, (time series - EMA(n)) —
to correct themselves. In the realm of technical analysis, these are called adaptive
moving averages; they track the time series more aggres-sively when it is making large
moves. Tim Tillson is a software project manager at Hewlett-Packard, with degrees in
mathematics and computer science. He has privately traded options and equities for 15 years.
You can change long to short in the Input Settings
WARNING:
- For purpose educate only
- This script to change bars colors.
FX Sniper: T3-CCI Strategy Backtest This simple indicator gives you a lot of useful information - when to enter, when to exit
and how to reduce risks by entering a trade on a double confirmed signal.
You can use in the xPrice any series: Open, High, Low, Close, HL2, HLC3, OHLC4 and ect...
You can change long to short in the Input Settings
Please, use it only for learning or paper trading. Do not for real trading.
