Multi TF Oscillators Screener [TradingFinder] RSI / ATR / Stoch🔵 Introduction
The oscillator screener is designed to simplify multi-timeframe analysis by allowing traders and analysts to monitor one or multiple symbols across their preferred timeframes—all at the same time. Users can track a single symbol through various timeframes simultaneously or follow multiple symbols in selected intervals. This flexibility makes the tool highly effective for analyzing diverse markets concurrently.
At the core of this screener lie two essential oscillators: RSI (Relative Strength Index) and the Stochastic Oscillator. The RSI measures the speed and magnitude of recent price movements and helps identify overbought or oversold conditions.
It's one of the most reliable indicators for spotting potential reversals. The Stochastic Oscillator, on the other hand, compares the current price to recent highs and lows to detect momentum strength and potential trend shifts. It’s especially effective in identifying divergences and short-term reversal signals.
In addition to these two primary indicators, the screener also displays helpful supplementary data such as the dominant candlestick type (Bullish, Bearish, or Doji), market volatility indicators like ATR and TR, and the four key OHLC prices (Open, High, Low, Close) for each symbol and timeframe. This combination of data gives users a comprehensive technical view and allows for quick, side-by-side comparison of symbols and timeframes.
🔵 How to Use
This tool is built for users who want to view the behavior of a single symbol across several timeframes simultaneously. Instead of jumping between charts, users can quickly grasp the state of a symbol like gold or Bitcoin across the 15-minute, 1-hour, and daily timeframes at a glance. This is particularly useful for traders who rely on multi-timeframe confirmation to strengthen their analysis and decision-making.
The tool also supports simultaneous monitoring of multiple symbols. Users can select and track various assets based on the timeframes that matter most to them. For example, if you’re looking for entry opportunities, the screener allows you to compare setups across several markets side by side—making it easier to choose the most favorable trade. Whether you’re a scalper focused on low timeframes or a swing trader using higher ones, the tool adapts to your workflow.
The screener utilizes the widely-used RSI indicator, which ranges from 0 to 100 and highlights market exhaustion levels. Readings above 70 typically indicate potential pullbacks, while values below 30 may suggest bullish reversals. Viewing RSI across timeframes can reveal meaningful divergences or alignments that improve signal quality.
Another key indicator in the screener is the Stochastic Oscillator, which analyzes the closing price relative to its recent high-low range. When the %K and %D lines converge and cross within the overbought or oversold zones, it often signals a momentum reversal. This oscillator is especially responsive in lower timeframes, making it ideal for spotting quick entries or exits.
Beyond these oscillators, the table includes other valuable data such as candlestick type (bullish, bearish, or doji), volatility measures like ATR and TR, and complete OHLC pricing. This layered approach helps users understand both market momentum and structure at a glance.
Ultimately, this screener allows analysts and traders to gain a full market overview with just one look—empowering faster, more informed, and lower-risk decision-making. It not only saves time but also enhances the precision and clarity of technical analysis.
🔵 Settings
🟣 Display Settings
Table Size : Lets you adjust the table’s visual size with options such as: auto, tiny, small, normal, large, huge.
Table Position : Sets the screen location of the table. Choose from 9 possible positions, combining vertical (top, middle, bottom) and horizontal (left, center, right) alignments.
🟣 Symbol Settings
Each of the 10 symbol slots comes with a full set of customizable parameters :
Enable Symbol : A checkbox to activate or hide each symbol from the table.
Symbol : Define or select the asset (e.g., XAUUSD, BTCUSD, EURUSD, etc.).
Timeframe : Set your desired timeframe for each symbol (e.g., 15, 60, 240, 1D).
RSI Length : Defines the period used in RSI calculation (default is 14).
Stochastic Length : Sets the period for the Stochastic Oscillator.
ATR Length : Sets the length used to calculate the Average True Range, a key volatility metric.
🔵 Conclusion
By combining powerful oscillators like RSI and Stochastic with full customization over symbols and timeframes, this tool provides a fast, flexible solution for technical analysts. Users can instantly monitor one or several assets across multiple timeframes without opening separate charts.
Individual configuration for each symbol, along with the inclusion of key metrics like candlestick type, ATR/TR, and OHLC prices, makes the tool suitable for a wide range of trading styles—from scalping to swing and position trading.
In summary, this screener enables traders to gain a clear, high-level view of various markets in seconds and make quicker, smarter, and lower-risk decisions. It saves time, streamlines analysis, and boosts overall efficiency and confidence in trading strategies.
Symbols

Normalized Price ComparisonNormalized Price Comparison Indicator Description
The "Normalized Price Comparison" indicator is designed to provide traders with a visual tool for comparing the price movements of up to three different financial instruments on a common scale, despite their potentially different price ranges. Here's how it works:
Features:
Normalization: This indicator normalizes the closing prices of each symbol to a scale between 0 and 1 over a user-defined period. This normalization process allows for the comparison of price trends regardless of the absolute price levels, making it easier to spot relative movements and trends.
Crossing Alert: It features an alert functionality that triggers when the normalized price lines of the first two symbols (Symbol 1 and Symbol 2) cross each other. This can be particularly useful for identifying potential trading opportunities when one asset's relative performance changes against another.
Customization: Users can input up to three symbols for analysis. The normalization period can be adjusted, allowing flexibility in how historical data is considered for the scaling process. This period determines how many past bars are used to calculate the minimum and maximum prices for normalization.
Visual Representation: The indicator plots these normalized prices in a separate pane below the main chart. Each symbol's normalized price is represented by a distinct colored line:
Symbol 1: Blue line
Symbol 2: Red line
Symbol 3: Green line
Use Cases:
Relative Performance Analysis: Ideal for investors or traders who want to compare how different assets are performing relative to each other over time, without the distraction of absolute price differences.
Divergence Detection: Useful for spotting divergences where one asset might be outperforming or underperforming compared to others, potentially signaling changes in market trends or investment opportunities.
Crossing Strategy: The alert for when Symbol 1 and Symbol 2's normalized lines cross can be used as a part of a trading strategy, signaling potential entry or exit points based on relative price movements.
Limitations:
Static Alert Messages: Due to Pine Script's constraints, the alert messages cannot dynamically include the names of the symbols being compared. The alert will always mention "Symbol 1" and "Symbol 2" crossing.
Performance: Depending on the timeframe and the number of symbols, performance might be affected, especially on lower timeframes with high data frequency.
This indicator is particularly beneficial for those interested in multi-asset analysis, offering a streamlined way to observe and react to relative price movements in a visually coherent manner. It's a powerful tool for enhancing your trading or investment analysis by focusing on trends and relationships rather than raw price data.

Price alert multi symbols (Miu)This indicator won't plot anything to the chart.
Please follow steps below to set your alarms based on multiple symbols' prices:
1) Add indicator to the chart
2) Go to settings
3) Check symbols you want to receive alerts (choose up to 8 different symbols)
4) Set price for each symbol
5) Once all is set go back to the chart and click on 3 dots to set alert in this indicator, rename your alert and confirm
6) You can remove indicator after alert is set and it'll keep working as expected
What does this indicator do?
This indicator will generate alerts based on following conditions:
- If price set is met for any symbol
Once condition is met it will send an alert with the following information:
- Symbol name (e.g: BTC, ETH, LTC)
- Price reached
This script requests current price for each symbol through request.security() built-in function. It also requests amount of digits (mintick) for each symbol to send alerts with correct value.
This script was developed to attend a demand from a comment in other published script.
Feel free to give feedbacks on comments section below.
Enjoy!
Oscillator EdgesAnother simple script to be added on top of other indicators. Simply provides a symbol of varying color depending on the value of the oscillator. Allows up to 4 different colors in each direction. Includes alerts conditions. Demonstration is the indicator being applied to the RSI (purple) included in Market Cipher B.
To use, simply add it to your indicator, and choose and oscillator of your choice in the Input Settings. Alternatively, you can just keep it on 'close' and use the built in RSI. Or, you can use the RSI formula on top of something else (if that's your thing).
The names are silly, so I hope this is okay with all of you.
Let me know what you think, and if there are any problems, questions, or concerns!

Ratio Between Two SymbolsThis scripts displays the ratio of any two symbols. The ratio is shown on a second chart.
A multiplier may be added to the ratio, and moving average is calculated.

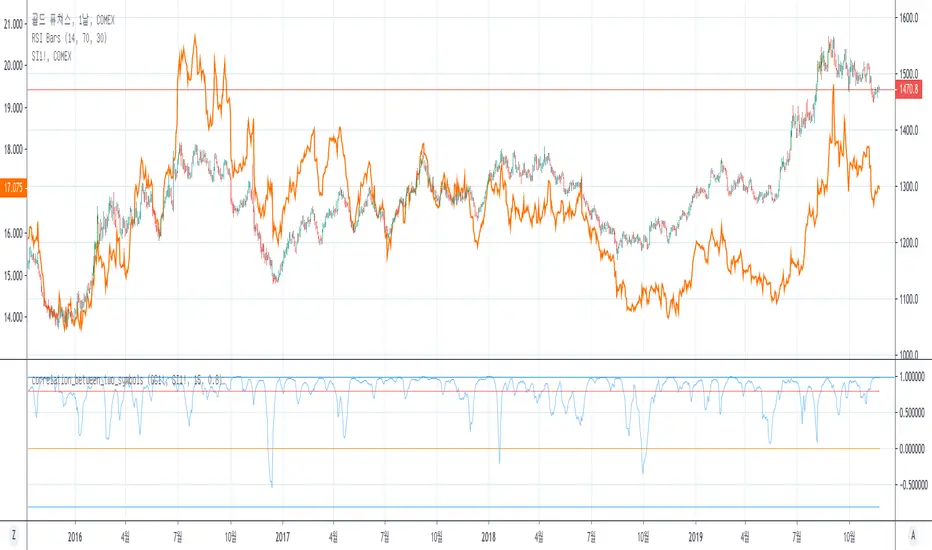
correlation_between_two_symbolsCorrelation between two symbols.
Notice: you can find more useful indicators by searching 'between_two_symbols'
Plotchar - How to draw external symbols on a chartHey everyone
It's been a while :) but still on holidays and working on the website. I'll resume the scripts sharing shortly once I'll get back home
For today, I wanted to share a very useful script that is going to make you a top of money 100% guaranteed and you'll even have a Lamborghini delivered at your place by tomorrow... (imagine some followers would believe me for this)
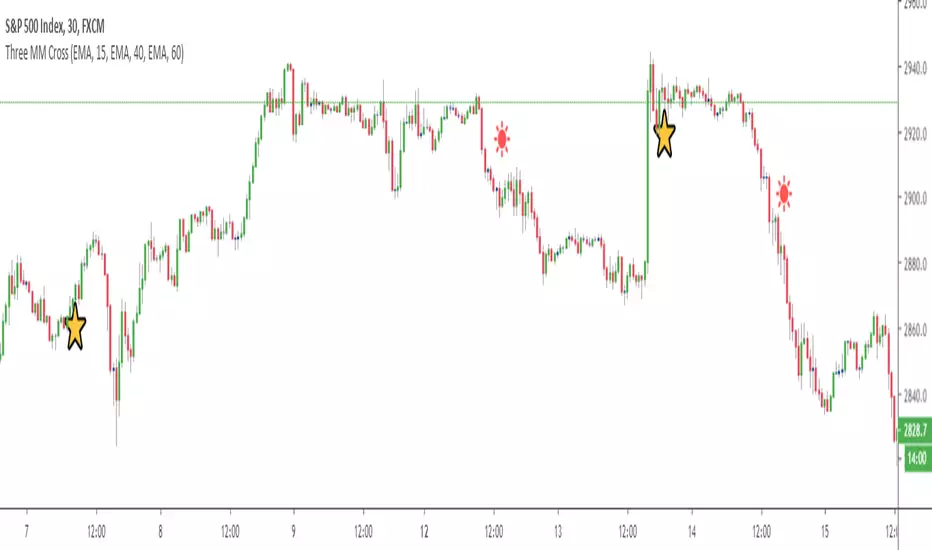
This "script" is a proof of concept that you can draw external Unicode symbols on a chart.
If you're tired with the plotshape shapes by default, you can use some others - I usually find mine there emojipedia.org
What are the use cases?
- Draw a dead skeleton when your stop-loss is hit
- Draw a winning cup when your take profit is hit
- Draw a coffin when you run out of capital
FAQ
Q: Does this script has any interest?
A: I'm not sure myself
Q: Will you make money using it?
A: I'm not a financial advisor but ... very likely NO
Q: Is it cool though?
A: Hell yeah!!
Be sure to hit the thumbs up so that I'll share real scripts the next times and not "joke scripts". I promise it's the first and last time I'm sharing such a script
Dave
____________________________________________________________
- I'm an officially approved PineEditor/LUA/MT4 approved mentor on codementor. You can request a coaching with me if you want and I'll teach you how to build kick-ass indicators and strategies
Jump on a 1 to 1 coaching with me
- You can also hire for a custom dev of your indicator/strategy/bot/chrome extension/python
Correlation MATRIX (Flexible version)Hey folks
A quick unrelated but interesting foreword
Hope you're all good and well and tanned
Me? I'm preparing the opening of my website where we're going to offer the Algorithm Builder Single Trend, Multiple Trends, Multi-Timeframe and plenty of others across many platforms (TradingView, FXCM, MT4, PRT). While others are at the beach and tanning (Yes I'm jealous, so what !?!), we're working our a** off to deliver an amazing looking website and great indicators and strategies for you guys.
Today I worked in including the Trade Manager Pro version and the Risk/Reward Pro version into all our Algorithm Builders. Here's a teaser
We're going to have a few indicators/strategies packages and subscriptions will open very soon.
The website should open in a few weeks and we still have loads to do ... (#no #summer #holidays #for #dave)
I see every message asking me to allow access to my Algorithm Builders but with the website opening shortly, it will be better for me to manage the trials from there - otherwise, it's duplicated and I can't follow all those requests
As you can probably all understand, it becomes very challenging to publish once a day with all that workload so I'll probably slow down (just a bit) and maybe posting once every 2/3 days until the website will be over (please forgive me for failing you). But once it will open, the daily publishing will resume again :) (here's when you're supposed to be clapping guys....)
While I'm so honored by all the likes, private messages and comments encouraging me, you have to realize that a script always takes me about 2/3 hours of work (with research, coding, debugging) but I'm doing it because I like it. Only pushing the brake a bit because of other constraints
INDICATOR OF THE DAY
I made a more flexible version of my Correlation Matrix .
You can now select the symbols you want and the matrix will update automatically !!! Let me repeat it once more because this is very cool... You can now select the symbols you want and the matrix will update automatically :)
Actually, I have nothing more to say about it... that's all :) Ah yes, I added a condition to detect negative correlation and they're being flagged with a black dot
Definition : Negative correlation or inverse correlation is a relationship between two variables whereby they move in opposite directions.
A negative correlation is a key concept in portfolio construction, as it enables the creation of diversified portfolios that can better withstand portfolio volatility and smooth out returns.
Correlation between two variables can vary widely over time. Stocks and bonds generally have a negative correlation, but in the decade to 2018, their correlation has ranged from -0.8 to 0.2. (Source : www.investopedia.com
See you maybe tomorrow or in a few days for another script/idea.
Be sure to hit the thumbs up to cheer me up as your likes will be the only sunlight I'll get for the next weeks.... because working on building a great offer for you guys.
Dave
____________________________________________________________
- I'm an officially approved PineEditor/LUA/MT4 approved mentor on codementor. You can request a coaching with me if you want and I'll teach you how to build kick-ass indicators and strategies
Jump on a 1 to 1 coaching with me
- You can also hire for a custom dev of your indicator/strategy/bot/chrome extension/python

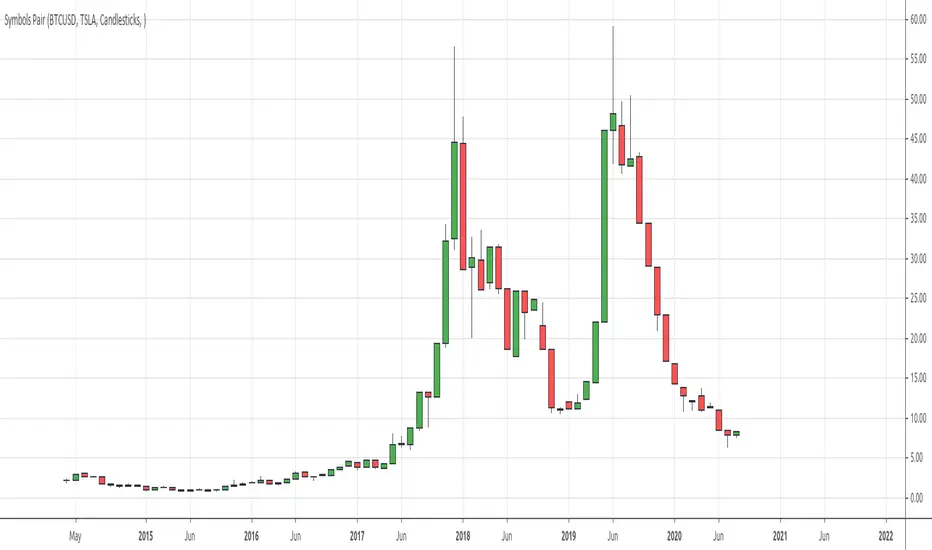
Symbols PairDraws the ratio between two input symbols.
You might find patterns in the ratio.
# Open Source
The code is open source @ github.com and uses the commonpine library github.com
Compare CandlesShows the candles of a specified EXCHANGE:PAIR in an indicator without overlay.
Has the following advantages over the standard comparison in TradingView:
- The compared pair is below your main chart.
- You can see the price of the compared pair.
- You can add multiple compared pairs and all of them will be shown in their own space with their own price.
