Swing Failure Pattern SFP [TradingFinder] SFP ICT Strategy🔵 Introduction
The Swing Failure Pattern (SFP), also referred to as a "Fake Breakout" or "False Breakout," is a vital concept in technical analysis. This pattern is derived from classic technical analysis, price action strategies, ICT concepts, and Smart Money Concepts.
It’s frequently utilized by traders to identify potential trend reversals in financial markets, especially in volatile markets like cryptocurrencies and forex. SFP helps traders recognize failed attempts to breach key support or resistance levels, providing strategic opportunities for trades.
The Swing Failure Pattern (SFP) is a popular strategy among traders used to identify false breakouts and potential trend reversals in the market. This strategy involves spotting moments where the price attempts to break above or below a previous high or low (breakout) but fails to sustain the move, leading to a sharp reversal.
Traders use this strategy to identify liquidity zones where stop orders (stop hunt) are typically placed and targeted by larger market participants or whales.
When the price penetrates these areas but fails to hold the levels, a liquidity sweep occurs, signaling exhaustion in the trend and a potential reversal. This strategy allows traders to enter the market at the right time and capitalize on opportunities created by false breakouts.
🟣 Types of SFP
When analyzing SFPs, two main variations are essential :
Real SFP : This occurs when the price breaks a critical level but fails to close above it, then quickly reverses. Due to its clarity and strong signal, this SFP type is highly reliable for traders.
Considerable SFP : In this scenario, the price closes slightly above a key level but quickly declines. Although significant, it is not as definitive or trustworthy as a Real SFP.
🟣 Understanding SFP
The Swing Failure Pattern, or False Breakout, is identified when the price momentarily breaks a crucial support or resistance level but cannot maintain the movement, leading to a rapid reversal.
The pattern can be categorized as follows :
Bullish SFP : This type occurs when the price dips below a support level but rebounds above it, signaling that sellers failed to push the price lower, indicating a potential upward trend.
Bearish SFP : This pattern forms when the price surpasses a resistance level but fails to hold, suggesting that buyers couldn’t maintain the higher price, leading to a potential decline.
🔵 How to Use
To effectively identify an SFP or Fake Breakout on a price chart, traders should follow these steps :
Identify Key Levels: Locate significant support or resistance levels on the chart.
Observe the Fake Breakout: The price should break the identified level but fail to close beyond it.
Monitor Price Reversal: After the breakout, the price should quickly reverse direction.
Execute the Trade: Traders typically enter the market after confirming the SFP.
🟣 Examples
Bullish Example : Bitcoin breaks below a $30,000 support level, drops to $29,000, but closes above $30,000 by the end of the day, signaling a Real Bullish SFP.
Bearish Example : Ethereum surpasses a $2,000 resistance level, rises to $2,100, but then falls back below $2,000, forming a Bearish SFP.
🟣 Pros and Cons of SFP
Pros :
Effective in identifying strong reversal points.
Offers a favorable risk-to-reward ratio.
Applicable across different timeframes.
Cons :
Requires experience and deep market understanding.
Risk of encountering false breakouts.
Should be combined with other technical tools for optimal effectiveness.
🔵 Settings
🟣 Logical settings
Swing period : You can set the swing detection period.
SFP Type : Choose between "All", "Real" and "Considerable" modes to identify the swing failure pattern.
Max Swing Back Method : It is in two modes "All" and "Custom". If it is in "All" mode, it will check all swings, and if it is in "Custom" mode, it will check the swings to the extent you determine.
Max Swing Back : You can set the number of swings that will go back for checking.
🟣 Display settings
Displaying or not displaying swings and setting the color of labels and lines.
🟣 Alert Settings
Alert SFP : Enables alerts for Swing Failure Pattern.
Message Frequency : Determines the frequency of alerts. Options include 'All' (every function call), 'Once Per Bar' (first call within the bar), and 'Once Per Bar Close' (final script execution of the real-time bar). Default is 'Once per Bar'.
Show Alert Time by Time Zone : Configures the time zone for alert messages. Default is 'UTC'.
🔵 Conclusion
The Swing Failure Pattern (SFP), or False Breakout, is an essential analytical tool that assists traders in identifying key market reversal points for successful trading.
By understanding the nuances between Real SFP and Considerable SFP, and integrating this pattern with other technical analysis tools, traders can make more informed decisions and better manage their trading risks.
Swing

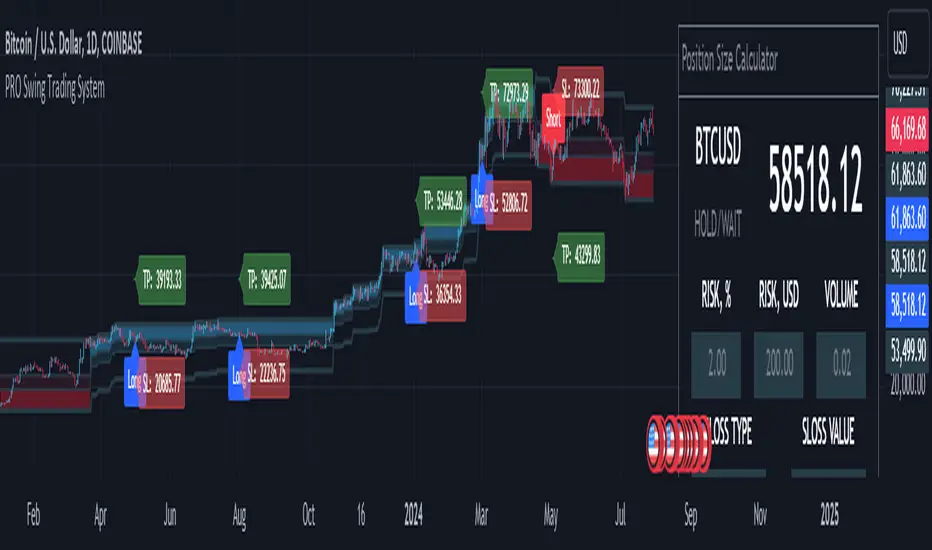
MQLSoftware - Pro Swing Trading SystemThe PRO Swing Trading System for TradingView is an advanced, fully integrated trading solution designed for traders who demand precision, versatility, and convenience in their trading strategies. Part of our Premium Collection, this system combines robust algorithms with hyper-customizable features to help traders effectively capitalize on market swings across various asset classes.
Our system embodies a comprehensive approach to trading, emphasizing risk management and capital preservation while maximizing trading efficiency. By seamlessly integrating risk management tools directly within the trading terminal, the PRO Swing Trading System eliminates the need for external spreadsheets or complex calculations, ensuring that traders can focus solely on executing their strategies. Every aspect of this system is designed to provide a streamlined, user-friendly experience where entry points, stop-loss levels, and take-profit targets are automatically calculated and displayed, allowing for rapid decision-making and execution.
KEY FEATURES
Advanced Trend Channels and Swing Levels
The PRO Swing Trading System features a unique, color-coded trend channel that visually adapts based on market trends. This channel helps traders identify optimal entry points by highlighting key swing levels for potential reversals or trend continuations. The system marks these levels on the chart as potential entry points for long or short positions, providing a clear visual cue for trading opportunities.
Comprehensive Signal and Trade Levels
Clear Stop-Loss and Take-Profit Levels: The system automatically marks stop-loss and take-profit levels on your charts, including absolute values to support informed decision-making. Traders can adjust these levels directly on the chart to match their trading style and risk tolerance, ensuring that risk management is always at the forefront of their trading strategy.
Dynamic Signal Adjustments: Customize your signals based on trend strength and market volatility to ensure you receive alerts that align with your specific trading strategies. This flexibility allows for a tailored trading experience that can adapt to various market conditions.
This image showcases a chart of BTC/USD on a one-hour timeframe. Here, we highlight the system's functionality, illustrating how different colors represent ascending and descending trends. The image includes features such as the Descending Channel, Extending Channel, Main Swing Level, Echo Swing Level, and Potential Entry points.
Additionally, it displays levels for managing profits and losses, such as Take Profit Levels and Stop Loss Level. The system allows setting either one or two take-profit levels for staged exit strategies. Traders can enter positions based on the Main Swing Level (primary entry point) or Echo Swing Level (secondary entry point), depending on their trading style or market conditions. This flexibility is useful for phased entry or if the primary entry opportunity is missed.
Integrated Position Size Calculator
Located in the top-right corner of the chart by default, the Position Size Calculator is a powerful tool that helps traders quickly determine the optimal trade size based on their risk settings. By integrating this calculator directly into the chart, traders can efficiently manage their trades with precision and confidence.
Configurable Risk Management: The calculator allows traders to set risk percentages, stop-loss types, and profit-to-loss ratios. It dynamically adjusts based on user inputs, optimizing trade volume and risk management to support a systematic trading approach.
This image presents a chart of ETH/USD on a 15-minute timeframe, clearly demonstrating the system’s ability to track trend changes accurately. The chart emphasizes the Position Size Calculator, part of the Risk Money Management Block. This panel allows users to set their risk (e.g., 2% of the deposit) and automatically calculates the appropriate position size. Absolute stop-loss and take-profit values are also calculated based on these settings, maintaining a consistent risk-reward ratio and supporting systematic trading.
Trend Strength Monitor
The Trend Strength Monitor is an essential tool for multi-timeframe analysis, helping traders identify the direction and strength of trends across higher timeframes. This feature aids in filtering out lower-probability trades, enhancing decision-making accuracy and ensuring that traders align their trades with the broader market trend.
This image features a chart of XAU/USD on an hourly timeframe, highlighting the Trend Strength Monitor. This tool helps traders understand the trend direction and strength across higher timeframes. The example shows that all higher timeframes indicate a buying zone, suggesting a safer long trade.
FILTERS AND SYSTEM USAGE
The indicator is equipped with a wide range of additional settings and filters that allow traders to adapt it to their specific needs and market conditions. Key features include:
Customizable Channel Width
The channel width is a crucial parameter that determines the indicator's adaptability to different market conditions. Traders can adjust the channel width to ensure the indicator responds quickly to market changes while remaining stable against false fluctuations. This flexibility is vital for trading in varying market conditions, such as ranging or trending markets.
Signal Frequency Control
This setting allows traders to control the frequency of signals generated by the system. By adjusting this parameter, traders can customize their trading approach to match their preferred style, whether it be a conservative, medium, or aggressive approach.
Alert and Notification Settings
The PRO Swing Trading System includes customizable alert settings to ensure traders are notified when key market conditions align with their strategy. Alerts can be set for specific entry points, trend reversals, or other significant market events, helping traders stay on top of their trades.
Trading Time Filters
Traders can set time filters to restrict trading activity to specific times of the day or week, ensuring their trading aligns with their schedule and market preferences. This feature is particularly useful for those who trade part-time or prefer to avoid trading during certain market sessions.
This image depicts a potentially risky LONG trade scenario after a prolonged downward movement on the AMD on an hourly timeframe. The recommendation is to avoid this trade, as the next three higher timeframes (H4, D1, W1) are in the red zone, indicating strong bearish trends.
CONCLUSION & ACCESS
The PRO Swing Trading System for TradingView is a powerful tool for traders who value precision, adaptability, and streamlined trading operations. With its advanced features, such as customizable trend channels, dynamic signal adjustments, and integrated risk management tools, this system supports a disciplined and systematic approach to trading. It's designed to enhance your trading experience by providing all the necessary tools to make informed decisions without the need for external resources.
To gain immediate access and start using the PRO Swing Trading System today, please refer to the Author's instructions below.
Bat Harmonic Pattern [TradingFinder] Bat Chart Indicator🔵 Introduction
The Bat Harmonic Pattern, created by Scott Carney in the 1990s, is a sophisticated tool in technical analysis, used to identify potential reversal points in price movements by leveraging Fibonacci ratios.
This pattern is classified into two primary types: the Bullish Bat Pattern, which signals the end of a downtrend and the beginning of an uptrend, and the Bearish Bat Pattern, which indicates the conclusion of an uptrend and the onset of a downtrend.
🟣 Bullish Bat Pattern
The Bullish Bat Pattern is designed to identify when a downtrend is likely to end and a new uptrend is about to begin. The key feature of this pattern is Point D, which typically aligns near the 88.6% Fibonacci retracement of the XA leg.
This point is considered a strong buy zone. When the price reaches Point D after a significant downtrend, it often indicates a potential reversal, presenting a buying opportunity for traders anticipating the start of an upward movement.
🟣 Bearish Bat Pattern
In contrast, the Bearish Bat Pattern forms when an uptrend is nearing its conclusion. Point D, which also typically aligns near the 88.6% Fibonacci retracement of the XA leg, serves as a critical point for traders.
This point is regarded as a strong sell zone, signaling that the uptrend may be ending, and a downtrend could be imminent. Traders often open short positions when they identify this pattern, aiming to capitalize on the anticipated downward movement.
🔵 How to Use
The Bat Pattern consists of five key points: X, A, B, C, and D, and four waves: XA, AB, BC, and CD. Fibonacci ratios play a crucial role in this pattern, helping traders pinpoint precise entry and exit points. In both the Bullish and Bearish Bat Patterns, the 88.6% retracement of the XA leg is a critical level for identifying potential reversal points.
🟣 Bullish Bat Pattern
Traders typically enter buy positions after Point D forms, expecting the downtrend to end and a new uptrend to start. This point, located near the 88.6% retracement of the XA leg, serves as a reliable buy signal.
🟣 Bearish Bat Pattern
Traders usually open short positions after identifying Point D, expecting the uptrend to end and a downtrend to begin. This point, also near the 88.6% retracement of the XA leg, acts as a valid sell signal.
🟣 Trading Tips for the Bat Pattern
Accurate Fibonacci Point Identification : Accurately identify Points X, A, B, C, and D, and calculate the Fibonacci ratios between these points. Point D should ideally be near the 88.6% retracement of the XA leg.
Signal Confirmation with Other Tools : To enhance the pattern's accuracy, avoid trading solely based on the Bat Pattern.
Risk Management : Always use stop-loss orders. In a Bullish Bat Pattern, place the stop-loss below Point X, and in a Bearish Bat Pattern, above Point X. This helps limit potential losses if the pattern fails.
Wait for Price Movement Confirmation : After identifying Point D, wait for the price to move in the anticipated direction to confirm the pattern's validity before entering a trade.
Set Realistic Profit Targets : Use Fibonacci retracement levels to set realistic profit targets, such as 38.2%, 50%, and 61.8% retracement levels of the CD leg. This strategy helps maximize profits and prevents premature exits.
🔵 Setting
🟣 Logical Setting
ZigZag Pivot Period : You can adjust the period so that the harmonic patterns are adjusted according to the pivot period you want. This factor is the most important parameter in pattern recognition.
Show Valid Forma t: If this parameter is on "On" mode, only patterns will be displayed that they have exact format and no noise can be seen in them. If "Off" is, the patterns displayed that maybe are noisy and do not exactly correspond to the original pattern.
Show Formation Last Pivot Confirm : if Turned on, you can see this ability of patterns when their last pivot is formed. If this feature is off, it will see the patterns as soon as they are formed. The advantage of this option being clear is less formation of fielded patterns, and it is accompanied by the latest pattern seeing and a sharp reduction in reward to risk.
Period of Formation Last Pivot : Using this parameter you can determine that the last pivot is based on Pivot period.
🟣 Genaral Setting
Show : Enter "On" to display the template and "Off" to not display the template.
Color : Enter the desired color to draw the pattern in this parameter.
LineWidth : You can enter the number 1 or numbers higher than one to adjust the thickness of the drawing lines. This number must be an integer and increases with increasing thickness.
LabelSize : You can adjust the size of the labels by using the "size.auto", "size.tiny", "size.smal", "size.normal", "size.large" or "size.huge" entries.
🟣 Alert Setting
Alert : On / Off
Message Frequency : This string parameter defines the announcement frequency. Choices include: "All" (activates the alert every time the function is called), "Once Per Bar" (activates the alert only on the first call within the bar), and "Once Per Bar Close" (the alert is activated only by a call at the last script execution of the real-time bar upon closing). The default setting is "Once per Bar".
Show Alert Time by Time Zone : The date, hour, and minute you receive in alert messages can be based on any time zone you choose. For example, if you want New York time, you should enter "UTC-4". This input is set to the time zone "UTC" by default.
🔵 Conclusion
The Bat Harmonic Pattern is a powerful tool in technical analysis, offering traders the ability to identify critical reversal points using Fibonacci ratios. By recognizing the Bullish and Bearish Bat Patterns, traders can anticipate potential trend reversals and make informed trading decisions.
However, it is essential to combine the Bat Pattern with other technical analysis tools and confirm signals for better trading outcomes. With proper use, this pattern can help traders minimize risk and optimize their entry and exit points in the market.

Shark Harmonic Pattern [TradingFinder] Shark Detector Indicator🔵 Introduction
The Shark harmonic pattern, first introduced by Scott Carney in 2011, is a recognized tool in technical analysis. Since its inception, it has been widely adopted by traders as an essential market analysis tool.
Due to its complexity, the Shark pattern can be challenging for novice traders. Therefore, we have developed the Harmonic Pattern Indicator to help analysts and traders easily identify these patterns.
🟣 Understanding the Types of Shark Pattern
In technical analysis, the Shark harmonic pattern forms at the end of trends and is categorized into two types: Bullish and Bearish Shark Patterns.
Bullish Shark Pattern : This pattern appears at the end of a downtrend, indicating a potential reversal to an uptrend. Traders can use this pattern to identify buy entry points. The image below illustrates the core components of the Bullish Shark Pattern.
Bearish Shark Pattern : Conversely, the Bearish Shark Pattern forms at the end of an uptrend, signaling a possible reversal to a downtrend. This pattern prompts traders to shift their positions from buying to selling. The image below showcases the characteristics of the Bearish Shark Pattern.
🔵 How to Use
🟣 Trading with the Bullish Shark Pattern
The Bullish Shark Pattern acts as a reversal pattern, helping traders identify the end of a downtrend and the beginning of an uptrend. It consists of five key points that indicate alternating bullish and bearish movements.
Upon the complete formation of this pattern, traders can look for opportunities to enter buy trades. To manage risk effectively, it is advisable to set a stop-loss below the lowest price point within the pattern.
🟣 Trading with the Bearish Shark Pattern
Similarly, the Bearish Shark Pattern functions as a reversal pattern but in the opposite direction. It helps traders identify the end of an uptrend and the onset of a downtrend.
After the pattern fully forms, traders can seek sell entry opportunities. As with the bullish pattern, placing a stop-loss above the highest price point within the pattern is recommended for risk management.
🔵 Setting
🟣 Logical Setting
ZigZag Pivot Period : You can adjust the period so that the harmonic patterns are adjusted according to the pivot period you want. This factor is the most important parameter in pattern recognition.
Show Valid Format : If this parameter is on "On" mode, only patterns will be displayed that they have exact format and no noise can be seen in them. If "Off" is, the patterns displayed that maybe are noisy and do not exactly correspond to the original pattern.
Show Formation Last Pivot Confirm : if Turned on, you can see this ability of patterns when their last pivot is formed. If this feature is off, it will see the patterns as soon as they are formed. The advantage of this option being clear is less formation of fielded patterns, and it is accompanied by the latest pattern seeing and a sharp reduction in reward to risk.
Period of Formation Last Pivot : Using this parameter you can determine that the last pivot is based on Pivot period.
🟣 Genaral Setting
Show : Enter "On" to display the template and "Off" to not display the template.
Color : Enter the desired color to draw the pattern in this parameter.
LineWidth : You can enter the number 1 or numbers higher than one to adjust the thickness of the drawing lines. This number must be an integer and increases with increasing thickness.
LabelSize : You can adjust the size of the labels by using the "size.auto", "size.tiny", "size.smal", "size.normal", "size.large" or "size.huge" entries.
🟣 Alert Setting
Alert : On / Off
Message Frequency : This string parameter defines the announcement frequency. Choices include: "All" (activates the alert every time the function is called), "Once Per Bar" (activates the alert only on the first call within the bar), and "Once Per Bar Close" (the alert is activated only by a call at the last script execution of the real-time bar upon closing). The default setting is "Once per Bar".
Show Alert Time by Time Zone : The date, hour, and minute you receive in alert messages can be based on any time zone you choose. For example, if you want New York time, you should enter "UTC-4". This input is set to the time zone "UTC" by default.
🔵 Conclusion
The Shark harmonic pattern is a potent analytical tool in technical analysis that aids traders in identifying critical reversal points in financial markets. Whether in a bullish or bearish context, this pattern provides clear trend change signals, allowing traders to enter trades with greater precision and optimize their strategies.
However, as with all analytical methods, it is essential to supplement the Shark pattern with additional analyses and strict risk management to avoid potential losses. Incorporating this pattern into a comprehensive trading strategy can lead to better trade outcomes and more opportunities for success

Pure Price Action Structures [LuxAlgo]The Pure Price Action Structures indicator is a pure price action analysis tool designed to automatically identify real-time market structures.
The indicator identifies short-term, intermediate-term, and long-term swing highs and lows, forming the foundation for real-time detection of shifts and breaks in market structure.
Its distinctive/unique feature lies in its reliance solely on price patterns, without being limited by any user-defined input, ensuring a robust and objective analysis of market dynamics.
🔶 USAGE
Market structure is a crucial aspect of understanding price action. The script automatically identifies real-time market structure, enabling traders to comprehend market trends more easily. It assists traders in recognizing both trend changes and continuations.
Market structures are constructed from three sets of swing points, short-term swings, intermediary swings, and long-term swings. Market structures associated with longer-term swing points are indicative of longer-term trends.
A market structure shift (MSS), also known as a change of character (CHoCH), is a significant event in price action analysis that may signal a potential shift in market sentiment or direction. Conversely, a break of structure (BOS) is another significant event in price action analysis that typically indicates a continuation of the prevailing trend.
However, it's important to note that while an MSS can be the first indication of a trend reversal and a BOS signifies a continuation of the prevailing trend, they do not guarantee a complete reversal or continuation of the trend.
In some cases, MSS and BOS levels may also act as liquidity zones or areas of price consolidation, rather than indicating a definitive change in market direction or continuation. Traders should approach them with caution and consider additional factors to confirm the validity of the signal before making trading decisions.
🔶 DETAILS
🔹 Market Structures
Market structures are based on the analysis of price action and aim to identify key levels and patterns in the market, where swing point detection is one of the core concepts within ICT trading methodologies and teachings.
Swing points are automatically detected solely based on market movements, without any reliance on user-defined input.
🔹 Utilizing Swing Points
Swing points are not identified in real time as they occur. While short-term swing points may be displayed with a delay of at most one bar, the identification of intermediate and long-term swing points depends entirely on market movements. Furthermore, detection is not limited by any user-defined input but relies solely on pure price action. Consequently, swing points are not typically utilized in real-time trading scenarios.
Traders often analyze historical swing points to discern market trends and pinpoint potential entry and exit points for their trades. By identifying swing highs and lows, traders can:
Recognize Trends: Swing highs and lows help traders identify the direction of the trend. Higher swing highs and higher swing lows indicate an uptrend, while lower swing highs and lower swing lows indicate a downtrend.
Identify Support and Resistance Levels: Swing highs often serve as resistance levels, known in ICT terminology as Buyside Liquidity Levels, while swing lows function as support levels, also referred to in ICT terminology as Sellside Liquidity Levels. Traders can utilize these levels to strategize entry and exit points for their trades.
Spot Reversal Patterns: Swing points can form various reversal patterns, such as double tops or bottoms, head and shoulders patterns, and triangles. Recognizing these patterns can signal potential trend reversals, allowing traders to adjust their strategies accordingly.
Set Stop Loss and Take Profit Levels: In the context of ICT teachings, swing levels represent specific price levels where a concentration of buy or sell orders is anticipated. Traders can target these liquidity levels/pools to accumulate or distribute their positions, essentially using swing points to establish stop loss and take profit levels for their trades.
Overall, swing points provide valuable information about market dynamics and can assist traders in making more informed trading decisions.
🔶 SETTINGS
🔹 Structures
Swings and Size: Toggles the visibility of the structure's highs and lows, assigns an icon corresponding to the structures, and controls the size of the icons.
Market Structures: Toggles the visibility of the market structures.
Market Structure Labels: Controls the visibility of labels that highlight the type of market structure.
Line Style and Width: Customizes the style and width of the lines representing the market structure.
Swing and Line Colors: Customizes colors for the icons representing highs and lows, and the lines and labels representing the market structure.
🔶 RELATED SCRIPTS
Market-Structures-(Intrabar).
Buyside-Sellside-Liquidity.

ZigZag ProHello Traders!
TRN ZigZag Pro is an indicator which identifies, and highlights pivot points (swings) and prints useful information about the swings in the chart (e.g. length, duration, ...). The indicator uses an extremely precise swing algorithm to detect the most important pivot points. Compared to other swing or zig-zag indicators TRN ZigZag Pro works in real-time, does not need a look-a-head to find swings and is not repainting. Moreover, equal (double) highs and lows are detected and displayed. The TRN ZigZag Pro helps traders to visualize pure price action and supports the trader to identify key turning points or trends.
The indicator comes with the following features:
Precise real-time swing detection without repainting
Equal/double high and low detection
Displaying of swing labels, values and information
Customizable settings as well as look and feel
It's important to note that the TRN ZigZag Pro is a visual tool and does not provide specific buy or sell signals. It serves as a guide for traders to analyze market structure in depth and make well-informed trading decisions based on their trading strategy and additional technical analysis.
Getting an edge with the TRN ZigZag Pro
The indicator clearly displays up trends, defined as a sequence of higher highs (HH) and higher lows (HL), with green labels and down trends, defined as a sequence of lower lows (LL) and lower highs (LH), with red labels. Equal highs/double tops (DT) and equal lows/ double bottoms (DB) are highlighted in gold.
In addition, the labels show a full stack of valuable information about the swings to maximize your accuracy.
Length
Length percentage in relation to the last swing length
Duration
Label (e.g. HH, LL...)
Use cases for swing detection
Trend Identification
By connecting the swing highs and lows, traders can identify and analyze the prevailing trend in the market. An uptrend is characterized by higher swing highs and lows, while a downtrend is characterized by lower highs and lower lows. The indicator helps traders visually to assess the strength and continuity of the trend.
Support And Resistance Levels
The swing highs and lows can act as support and resistance levels. Swing highs may act as resistance levels where selling pressure increases, while swing lows may act as support levels where buying pressure increases. Traders often pay attention to these levels as potential areas for trade entries, exits, or placing stop-loss orders.
Pattern Recognition
The swings identified by the indicator can help traders recognize chart patterns, such as equal high/lows, consolidations, wedges, triangles or more complex patterns like Gartley or Head and Shoulders. These patterns can provide insights into potential trend continuation or reversal.
Trade Entry and Exit
Traders may use TRN ZigZag Pro to determine potential trade entry and exit points. For example, in an uptrend, traders may look for opportunities to enter long positions near swing lows or on pullbacks to support levels. Conversely, in a downtrend, traders may consider short positions near swing highs or on retracements to resistance levels.
Conclusion
While signals from TRN ZigZag Pro can be informative, it is important to recognize that their reliability may vary. Various external factors can impact market prices, and it is essential to consider your risk tolerance and investment goals when executing trades.
Risk Disclaimer
The content, tools, scripts, articles, and educational resources offered by TRN Trading are intended solely for informational and educational purposes. Remember, past performance does not ensure future outcomes.

Breakouts with Tests & Retests [LuxAlgo]The Breakouts Tests & Retests indicator highlights tests and retests of levels constructed from detected swing points. A swing area of interest switches colors when a breakout occurs.
Users can control the sensitivity of the swing point detection and the width of the swing areas.
🔶 USAGE
When a Swing point is detected, an area of interest is drawn, colored green for a bullish swing and red when bearish.
A test is confirmed when the opening price is situated in the area of interest, and the closing price is above or below the area, depending on whether it is a bullish or bearish swing. Tests are highlighted with a solid-colored triangle.
A breakout is confirmed when the price closes in the opposite position, below or above the area, in which case the area will switch colors.
If the opening price is located within the area and the closing price closes outside the area, in the same direction as the breakout, this is considered a retest . Retests are highlighted with a hollow-colored triangle.
Note that tests/retests do not act on wicks. The main factor is that the opening price is in the area of interest, while the closing price is outside.
🔹 Area Of Interest Width
The user can adjust the width of the swing areas. Changing the " Width " is a fast and easy way to find different areas of interest.
A higher "Multiple" setting would return a wider area, allowing price to develop within it for a longer period of time and potentially provide later test signals.
When a swing area is broken, a higher "Width" setting can make it more complicated for the price to break it again, allowing a swing area to remain valid for a longer period of time thus potentially providing more retest signals.
🔶 DETAILS
Generally, only one bullish/bearish pattern can be active at a time. This means that no more than 1 bullish or bearish area will be active.
The " Display " settings, however, can help control how areas of different types are displayed.
Bullish AND Bearish: Both, bullish and bearish patterns can be drawn at the same time
Bullish OR Bearish: Only 1 bullish or 1 bearish pattern is drawn at a time
Bullish: Only bullish patterns
Bearish: Only bearish patterns
🔹 Test/Retest Labels
The user can adjust the settings so only the latest test/retest label is shown or set a minimum number of bars until the next test/retest can be drawn.
🔹 Maximum Bars
Users can set a limit of bars for when there is no test/retest in that period; the area of interest won't be updated anymore and will be available and ready for the next Swing.
An option for pulling the area back to the last retest is included.
🔶 SETTINGS
Display: Determines which swing areas are displayed by the indicator. See the "DETAILS" section for more information
Multiple: Adjusts the width of the areas of interest
Maximum Bars: Limit of bars for when there is no test/retest
Display Test/Retest Labels: Show all labels or just the last test/retest label associated with a swing area
Minimum Bars: Minimum bars required for a subsequent test/retest label are allowed to be displayed
Set Back To Last Retest: When after "Maximum Bars" no test/retest is found, place the right side of the area at the last test/retest
🔹 Swings
Left: x amount of wicks on the left of a potential Swing need to be higher/lower for a Swing to be confirmed.
Right: The number of wicks on the right of a potential swing needs to be higher/lower for a Swing to be confirmed.
🔹 Style
Bullish: color for test period (before a breakout) / retest period (after a breakout)
Bearish: color for test period (before a breakout) / retest period (after a breakout)
Label Size

Higher Timeframe High & Low [ChartPrime]The Higher Timeframe High & Low Indicator plots key levels (high, low, and average price) from a higher timeframe onto the current chart, aiding traders in identifying significant support and resistance zones.
The indicator also detects and labels breakout points and can display trend directions based on these higher timeframe levels breakout points.
Key Features:
◆ Higher Timeframe Levels:
Plots the high, low, and average price from a selected higher timeframe onto the current chart.
Extends these levels into the future for better visualization.
◆ Breakout Detection:
Identifies and labels breakouts above the higher timeframe high or below the higher timeframe low.
Breakout points are clearly marked with labels indicating "High Break" or "Low Break" with timeframe mark.
If the following break out type is the same that previous, it does not marked by labels, but still marked by bar color.
◆ Trend Visualization:
Optionally displays trend direction by changing bar colors and line styles based on breakout conditions.
Trend indication helps in identifying bullish or bearish market conditions.
◆ Support and Resistance Indication:
Marks support and resistance points with '◆' symbols when the current timeframe's high or low interacts with the higher timeframe's levels.
◆ Period separation:
Background color changes to indicate period separation if enabled.
◆ Inputs:
Extension to the right of High and Low: Sets the number of bars to extend the high and low lines into the future.
Timeframe: Selects the higher timeframe (e.g., Daily) to use for plotting high and low levels.
Period Separator: Toggles the visual separator for periods.
Show Trend?: Toggles the trend visualization, changing bar colors and plot styles based on breakouts.
Show Breakout Labels?: Toggles the Breakout Labels visualization.
Indicator Logic:
Historical vs. Real-Time Bars: Adjusts values based on whether the bar is historical or real-time to ensure accurate plotting.
High and Low Prices: Retrieves the high and low prices from the selected higher timeframe.
Breakout Conditions: Determines if the current price has crossed above the higher timeframe high (high break) or below the higher timeframe low (low break).
Color and Trend Logic: Adjusts colors and checks for breakouts to avoid multiple labels and indicate trend direction.
Usage Notes:
This indicator is ideal for traders looking to integrate multi-timeframe analysis into their strategy.
The higher timeframe levels act as significant support and resistance zones, helping traders identify potential reversal or continuation points.
The breakout labels and trend visualization provide additional context for trading decisions, indicating when the price has breached key levels and is likely to continue in that direction.
This indicator enhances chart analysis by providing clear, visual cues from higher timeframe data, helping traders make more informed decisions based on a broader market perspective.

Trend and Reversal ScannerHello Traders!
The TRN Trend and Reversal Scanner highlights in a user-friendly and easy to read table trend and reversal signals from up to 20 assets of your choosing. With it, you can efficiently monitor your preferred instruments simultaneously without jumping from one chart to the next. You will never miss a signal again. The indicator automatically finds swing-based up and down trends, bullish and bearish divergences, detects ranges and range breakouts as well as trend and reversal signals by the built-in trend detection algorithm called TRN Bars. Furthermore, you can conveniently stay updated with real-time alerts, notifying you whenever the scanner finds interesting market situations.
Feature List
Swing-based up and down trend detection
Divergence detection for any given (Custom) Indicator
Price range and breakout detection
Bar trend and reversal detection
Scanner alerts
The value of this indicator is to support traders to easily identify trend-based signals in an automated way and across many different markets at the same time. The trader saves a lot of time scanning the markets for up and down swings, divergences, consolidations and bar pattern-based trends and reversals, since finding and alerting these signals is done automatically for the trader.
For a visualization of the detected signals, you can add the TRN Bars and the Swing Suite indicator to your chart.
How does Trend Scanner work?
On the right side of the chart, you can find a table displaying the symbols monitored by the TRN Trend and Reversal Scanner for signal detection (first column). The table provides information on the status of each symbol. This visual representation allows you to quickly identify evolving signals across different symbols, helping you stay informed and make timely trading decisions.
The scanner operates specifically on the timeframe you are currently viewing, ensuring that the detected signals align precisely with your trading perspective.
In the following, we will describe the different signals displayed in the different columns of the table
Column 1 – Symbols
Column 2 – Bar Trend & Signals
Column 3 – Up & Down Swing Trend
Column 4 – Ranges & Range Breakouts
Column 5 – Bullish Divergences
Column 6 – Bearish Divergences
Bar Trend & Signals
In the second column, you can observe the status of TRN Bars, the built-in trend detection algorithm.
UP – Uptrend
DN – Downtrend
REV (Green) – Bullish Reversal Bar
REV (Red) – Bearish Reversal Bar
CON (Green) – Bullish Continuation Bar
CON (Red) – Bearish Continuation Bar
B/O (Green) – Bullish Range Breakout Bar
B/O (Red) – Bearish Range Breakout Bar
TRN Bars is designed to spot bullish and bearish trends and reversals. The trend analysis is based on a new algorithm that weights several different inputs:
classical and advanced bar patterns and their statistical frequency
probability distributions of price expansions after certain bar patterns
bar information such as wick length in %, overlapping of the previous bar in % and many more
historical trend and consolidation analysis
It provides high-probability trend continuation analysis and reversal detections.
Up and Downtrend
The second column (Trend) indicates whether the price of the asset moves within an uptrend (UP) or a downtrend (DN), as detected by our unique swing detection algorithm, on the selected timeframe.
The swing detection algorithm identifies pivot points (swings) with high accuracy. It works in real-time and does not need a look-a-head to find swings.
Ranges & Range Breakouts
The third column provides insights into the price behavior of a symbol within the selected timeframe, as analyzed by the range feature of the TRN Bars algorithm.
ACTIVE – Price moves within a price range
UP – Breakout detected
DN – Breakdown detected
UP CONF – Breakout confirmed
DN CONF – Breakdown confirmed
The bar range feature automatically finds consolidations where the price range of several consecutives bars is rather small. The detection of the bar ranges includes among other things the overlapping percentage of these bars.
Divergence Detection for any given (Custom) Indicator
The divergence detector finds with unrivaled precision bullish and bearish as well as regular and hidden divergences. The main difference compared to other divergences indicators is that this indicator finds rigorously the extreme peaks of each swing, both in price and in the corresponding indicator. This precision is unmatched and therefore this is one of the best divergences detectors.
The build in divergence detector works with any given indicator, even custom ones. In addition, there are 11 built-in indicators. Most noticeable is the cumulative delta indicator, which works astonishingly well as a divergence indicator. Full list:
External Indicator (see next section for the setup)
Awesome Oscillator (AO)
Commodity Channel Index (CCI)
Cumulative Delta Volume (CDV)
Chaikin Money Flow (CMF)
Moving Average Convergence Divergence (MACD)
Money Flow Index (MFI)
Momentum
On Balance Volume (OBV)
Relative Strength Index (RSI)
Stochastic
Williams Percentage Range (W%R)
Another highlight of the divergence detection is that it works with every indicator, even custom ones. To do this, you must add the (custom) indicator to your chart. Afterwards, simply go to the “Divergence Detection” section in the indicator settings and choose "External Indicator". If the custom indicator has one reference value, then choose this value in the “External Indicator (High)” field. If there are high and low values (e.g. candles), then you also must set the “External Indicator Low” field.
The visualization of the divergence detection is represented in the fifth column (Div Bull) and the sixth and last column (Div Bear).
REG – Regular divergence detected
HID – Hidden divergence detected
Scanner Alerts
You can opt to receive alerts for the following scenarios:
Detected up and down swings
Detected bullish and bearish divergences
Detected bar trend changes
Confirmed Reversal Bars
Confirmed Continuation Bars
Confirmed ange breakouts
The alert function is activated for all symbols listed in the scanner and corresponds to the timeframe of the chart you are currently viewing. This ensures that you receive alerts specifically tailored to the symbols and timeframe you are interested in.
Risk Disclaimer
The content, tools, scripts, articles, and educational resources offered by TRN Trading are intended solely for informational and educational purposes. Remember, past performance does not ensure future outcomes.

Swing Suite (SMT/Divergences + Gann Swings)Hello Traders!
TRN Swing Suite (SMT/Divergences + Gann Swings) is an indicator which identifies, and highlights pivot points (swings) and prints a lot of information about the swings in the chart (e.g. length, duration, cumulative Delta, ...). Furthermore, it detects divergences in connection with any given indicator, even custom ones. In addition to this, you can choose the algorithm to compute the swings. The famous Gann-Swing algorithm and the extremely precise TRN Swing algorithm (called Standard) are available for selection, as well as two other variants. Compared to other swing or zig-zag indicators it works in real-time, does not need a look-a-head to find swings and is not repainting. Moreover, equal (double) highs and lows are detected and displayed. The TRN Swing Suite helps traders to visualize the pure price action and identify key turning points or trends. The indicator comes with the following features:
Precise real-time swing detection without repainting
Divergence detecting for any given (custom) indicator - with 11 different preset indicators
SMT (Smart Money Technique)/Divergence detecting in relation to other instruments
Swing Performance Statistics
Swing support and resistance levels
Swing trend for multiple swing sizes
Equal/double high and low detection
4 different swing computation styles
Displaying of swing labels, values and information
Customizable settings as well as look and feel
It's important to note that the TRN Swing Suite is a visual tool and does not provide specific buy or sell signals. It serves as a guide for traders to analyze market structure in depth and make well-informed trading decisions based on their trading strategy and additional technical analysis.
Divergence Detection for any given (Custom) Indicator
The divergence detector finds with unrivaled precision bullish and bearish as well as regular and hidden divergences. The main difference compared to other divergences indicators is that this indicator finds rigorously the extreme peaks of each swing, both in price and in the corresponding indicator. This precision is unmatched and therefore this is one of the best divergences detectors.
The build in divergence detector works with any given indicator, even custom ones. In addition, there are 11 built-in indicators. Most noticeable is the cumulative delta indicator, which works astonishingly well as a divergence indicator. Full list:
External Indicator (see next section for the setup)
Awesome Oscillator (AO)
Commodity Channel Index (CCI)
Cumulative Delta Volume (CDV)
Chaikin Money Flow (CMF)
Moving Average Convergence Divergence (MACD)
Money Flow Index (MFI)
Momentum
On Balance Volume (OBV)
Relative Strength Index (RSI)
Stochastic
Williams Percentage Range (W%R)
The divergences are colored with vivid lines and labels. Bullish divergences are distinguished with luminous blue lines, while bearish divergences are denoted by striking red lines. Upon detecting a divergence, the colored lines act as a visual indicator for traders, signaling an imminent possibility of a trend reversal. In response, traders can leverage this valuable insight to make informed decisions in their trading activities.
Choose Your Custom Divergence Indicator
Handpick your custom indicator, and the TRN Swing Suite will hunt for divergences on your preferred market and timeframe. Importantly, you must add the indicator to your chart. Afterwards, simply go to the “Divergence Detection” section in the TRN Swing Suite indicator settings and choose "External Indicator". If the custom indicator has one reference value, then choose this value in the “External Indicator (High)” field. If there are high and low values (e.g. candles), then you also must set the “External Indicator Low” field.
In the provided graphic, we've chosen the stochastic RSI as our example, and as you can see, the TRN Swing Suite instantly identifies and plots bullish and bearish divergences on your chart.
Smart Money Technique (SMT)/Divergence detecting in Relation to other Instruments
Smart Money Technique/Tool (SMT) means the divergence detection between two related instruments. The TRN Swing Suite finds divergence in relation to other instruments, e.g. NQ vs ES or BTCUSDT vs ETHUSDT. Just add another instrument to the chart. As representation style you can choose lines or candles/bars. Afterwards, simply go to the “Divergence Detection” section in the TRN Swing Suite indicator settings and choose "External Indicator". If the second instrument is represented as line, then choose this value in the “External Indicator (High)” field. If there are high and low values (e.g. candles/bars), then you also must set the “External Indicator Low” field.
The detection of SMTs can help traders to decide whether the trend continues, or a reversal is imminent. E.g. if the NQ makes a new higher high but the ES fails to do so and makes a new lower high, then the TRN Swing Suite shows a divergence. As a result, the probability is high that the trend will not continue, and the trader can make an informed decision about what to do next.
How to Set Parameters for Divergence Indicators
To begin, access the indicator settings and find the “Divergence Detection”. Look for the "Parameters" sections where you can fine-tune Parameters 1-3. The default settings are already optimized for the oscillators AO, RSI, CDV, W%R, MFI and Stochastic. For other divergence indicators, you might want to adjust the settings to your liking. The parameter order is the same as in the corresponding divergence indicator.
TRN Swing Suite Statistics
Unveil the untapped potential of advanced Swing Statistics! Gain invaluable insights into historical swings and turning points. Elevate your expertise by harnessing this treasure trove of data to supercharge signal reliability, while masterfully planning stop loss and take profit strategies with unrivaled accuracy. Within the TRN Swing Suite lie two powerful statistics, each offering distinct insights to empower your trading prowess.
Swing Statistic
The Swing Statistic comprises of two series, one for up swings (Up) and one for down swings (Down), with values given in points. The columns have the following meaning:
Up or down
# - total number of analyzed swings
Overall ∅ Length - average length of all swings in points
Overall ∅ Duration - average duration of swings in bars
∅ Length - average lengths for custom-defined swing counts
∅ Duration - average durations for custom-defined swing counts
The custom-defined swing count is used to determine the swing length/duration for the last x swings. Note, in the case of well-established assets like Microsoft or Nvidia, which have undergone one or more stock splits, the overall average in column three may deviate significantly from those in column five. That is why column 5 is useful.
Relation Statistic
The Relation Statistic highlights percentages representing the historical occurrence of specific high and low sequences. In the first column (in %), various types of highs and lows are listed as reference points.
For example, the first row corresponds to "HH followed by", where the second column (#) displays the total count of higher highs (HH) considered. The subsequent columns showcase the percentages of how often certain patterns follow the initial HH.
Fields marked in blue represent sequences that occurred in over 50% of cases. The darker the shade of blue in each field, the higher the percentage.
Use Swing Statistics to Validate Stop-Loss and Take-Profit Levels
No matter which signals you choose to trade, consulting Swing Statistics can significantly enhance the reliability of these signals.
For example, when looking for a long entry after a lower low (LL), you can examine the likelihood of a subsequent lower high (LH) or even a higher high (HH). Combining this valuable information with your predetermined Take Profit level allows you to better assess whether your target can be achieved successfully. Additionally, you can add the average up swing length to the lower low for an alternative Take Profit level. Similarly, you can verify the probability of the next low being a higher low (HL) or another lower low (LL) to determine the likelihood of your Stop Loss being triggered. Align the length of the last down swing with the average down swing length for an alternative Stop Loss.
Swing Support and Resistance Levels
Swing support and resistance levels are horizontal lines starting from a swing high or swing low and representing natural support and resistance levels. Price tends to respect this levels one way or another. In most cases, old swing highs and swing lows provide a lot of liquidity to the market. For example, for a swing high there are at least three different market players at work:
Traders put there stop loss above the swing high
Breakout traders go long above the swing high
Turtle soup (reverse) trader go short above the swing high
Swing Trend (Multiple Sizes)
The TRN Swing Suite can display either at the top or at the bottom the prevailing swing trends for the main trend seen in the chart and for two additional swing sizes. This is useful to see the swing trend for medium and bigger swings to get a clear picture of the market.
Getting an Edge with the TRN Swing Suite
The indicator clearly displays up trends, defined as a sequence of higher highs (HH) and higher lows (HL), with green labels and down trends, defined as a sequence of lower lows (LL) and lower highs (LH), with red labels. Equal highs/double tops (DT) and equal lows/ double bottoms (DB) are highlighted in gold.
In addition, the labels show a full stack of valuable information about the swings to maximize your accuracy.
Length
Length percentage in relation to the last swing length
Duration
Time
Volume
Cumulative Delta
In an uptrend the up swings should have higher volume und higher cumulative delta than the down swings. The duration and time for down swings in an uptrend should be shorter than for the up swings.
Use Cases for Swing Detection
Trend Identification
By connecting the swing highs and lows, traders can identify and analyze the prevailing trend in the market. An uptrend is characterized by higher swing highs and lows, while a downtrend is characterized by lower highs and lower lows. The indicator helps traders visually assess the strength and continuity of the trend.
Support And Resistance Levels
The swing highs and lows can act as support and resistance levels. Swing highs may act as resistance levels where selling pressure increases, while swing lows may act as support levels where buying pressure increases. Traders often pay attention to these levels as potential areas for trade entries, exits, or placing stop-loss orders.
Pattern Recognition
The swings identified by the indicator can help traders recognize chart patterns, such as equal high/lows, consolidations, wedges, triangles or more complex patterns like Gartley or Head and Shoulders. These patterns can provide insights into potential trend continuation or reversal.
Trade Entry and Exit
Traders may use TRN Swing to determine potential trade entry and exit points. For example, in an uptrend, traders may look for opportunities to enter long positions near swing lows or on pullbacks to support levels. Conversely, in a downtrend, traders may consider short positions near swing highs or on retracements to resistance levels.
Swing Styles
In addition to the standard swings, you have the flexibility to choose between various swing styles, including ticks, percent, or even the famous Gann swings.
Standard
Gann
Ticks
Percent
Conclusion
While signals from TRN Swings can be informative, it is important to recognize that their reliability may vary. Various external factors can impact market prices, and it is essential to consider your risk tolerance and investment goals when executing trades.
Risk Disclaimer
The content, tools, scripts, articles, and educational resources offered by TRN Trading are intended solely for informational and educational purposes. Remember, past performance does not ensure future outcomes.

Correct Fractal Swings by CRYPTOFORThis indicator adjusts and enhances the normal 3-fractal swing. The author of this definition, uncle_travis, takes into account swings with the absorption of 3 candles and uses them as structure points.

Swing Failure Pattern [UAlgo]🔶 Description:
The Swing Failure Pattern (SFP)o aims to identify potential reversal points in price action by detecting instances where price attempts to break past a previous high or low but fails to sustain that momentum, often indicating a shift in market sentiment.
🔶 Key Features:
Swing Failure Pattern Identification: The indicator identifies Swing Failure Patterns where price attempts to breach a recent high or low but fails to maintain that momentum, potentially signaling a reversal.
Customizable Lookback Period: Traders can adjust the lookback period to define the range within which Swing Failure Patterns are identified.
Minimum Bars Between SFP: This feature allows users to set a minimum number of bars required between Swing Failure Patterns to filter out noise and improve the accuracy of signals.
RSI Confluence: Traders have the option to incorporate RSI (Relative Strength Index) confluence into the signals, filtering SFP signals based on overbought and oversold levels of RSI. This adds an additional layer of confirmation to potential reversal points.
Example :
without Confluence :
with Confluence:
Customizable RSI Parameters: Users can customize the length of the RSI period as well as define overbought and oversold levels according to their trading strategy.
Visual Alerts: The indicator provides visual alerts on the price chart using labels to highlight potential Swing Failure Patterns, aiding traders in identifying these patterns quickly and efficiently.
Disclaimer:
Please note that the Swing Failure Pattern indicator is provided for informational purposes only and should not be considered as financial advice. Trading involves substantial risk, and users should conduct their own research and analysis or consult with a financial advisor before making any investment decisions based on this indicator. Additionally, past performance is not indicative of future results.

Liquidity Sweeps [LuxAlgo]The Liquidity Sweeps indicator detects the presence of liquidity sweeps on the user's chart, while also providing potential areas of support/resistance or entry when Liquidity levels are taken.
In the event of a Liquidity Sweep a Sweep Area is created which may provide further areas of interest.
🔶 USAGE
A Liquidity Sweep occurs when the price breaks through a liquidity level (further referred to as LqL ), after which the price returns below/above the liquidity level , forming a wick.
The script provides 2 options when this can happen:
A wick passes a LqL after which the price quickly returns.
First the closing price breaks through a LqL . After a while, the price retests the LqL and forms a wick in the opposite direction.
The examples above show a bullish and bearish scenario of "a wick passing through an LqL where the price quickly comes back". This type of Liquidity Sweep is represented by a dotted line.
The following example shows a broken LqL , where the price retests the Liquidity zone and bounces back.
Instead of a dotted line, this type of Liquidity Sweep is represented by a dashed line.
When a Liquidity Sweep takes place, this is indicated by highlighting the "wick- LqL " distance. This distance is also the basis for the Sweep Area (see next sub-section). A small 3-bar long dotted line starts from the opposite wick as an extra aid to determine potential support/resistance/entry, ...
Colors can be set in the settings (here yellow and aqua blue instead of default colors for clarity).
🔹 Sweep Areas
The distance between the LqL and the maximum limit of the wick forms a Sweep Area , which can provide a potential support/resistance or entry zone.
These examples show both types of Liquidity Sweeps , followed by a box indicating the Sweep Area .
When the Sweep Area is mitigated or a certain amount of bars has passed (Settings - 'Max bars'), the boxes will no longer be updated.
In this case, the 'Trigger' label shows the bar where the high crossed a LqL , after which a red box starts between LqL and high.
The low of the 'Trigger' bar is the starting point of a short dotted line. Next to the 'Trigger bar' the high touches the Sweep Area before returning, providing a potential short entry. One bar further, another entry opportunity presents itself when the price breaks the small dotted line.
In the following bullish example, not only do we see opportunities when the LqL has been swept, but the following Sweep Area provides some potential entries.
The small green dotted lines also act as a guide where the price breaks above, then forms a small range, after which the price continues in an upward direction.
Here, the initial trigger on the left forms a Sweep Area that is quickly broken. However, the small green line provides a potential entry area later on. The price moves in a short channel before breaking above the LqL (green dashed line), providing more potential entries. Price retests this LqL , and goes below this level. The price remained around the previously formed channel, after which the price resumed its upward trend.
🔶 SETTINGS
🔹 Liquidity Sweeps
Swings: Period used for the swing detection, with higher values returning longer term Liquidity Levels .
Options:
- Only Wicks: Only detects a Liquidity Sweep when a wick sweeps a previous wick
- Only Outbreaks & Retest: Only detects a Liquidity Sweep when the price breaks a Liquidity Level , returns & retests the Liquidity Level , and forms a wick in the opposite direction.
- Wicks + Outbreaks & Retest: Both options can be detected.
🔹 Sweep Area
Extend: Enables/Disables extension of the Sweep Area boxes.
Max Bars: Limit the extension to a certain number of bars.
Color Sweep Area box.

Smallest Swing [Truth Indie]This indicator is designed to test the smallest swing draw using the swing capture concept of the Pivot Points High Low indicator, setting the length to 1 for all periods, and combining it with price action that I think makes sense.
Example of a valid swing high.
Example of a valid swing low.

Imbalance indicator (Multi-TimeFrame)(USA) Imbalance Indicator (Multi-TimeFrame) is an indicator designed to visualize the imbalance between two adjacent candles on a chart by drawing rectangles. It helps identify the dominance of buyers or sellers during the price's impulsive movement in an uptrend or downtrend.
Here's how the indicator works:
It determines the trend direction (up or down) based on the closing prices of the last three candles. An uptrend is identified if all three candles closed above their openings, and a downtrend if they closed below.
Depending on the trend direction, the indicator calculates the imbalance between candles. The imbalance is expressed as the difference between the low of the next candle and the high of the previous candle for an uptrend or the low of the previous candle and the high of the next candle for a downtrend. The imbalance value should be greater than 0.
When an imbalance is detected, the indicator draws a rectangle on the chart. The rectangle starts at the candle with the detected imbalance, the upper border is at the top of the imbalance, and the lower border is at the bottom of the imbalance.
The color of the rectangle depends on the trend direction: green for an uptrend and red for a downtrend.
The rectangle continues dynamically to the right until it is intersected by the next candles by 50% or more (by default). The intersection can occur in various combinations (shadow, body, or shadow + body of the candle). Once this happens, the rectangle ends on the last overlapping candle. The height overlap percentage is adjustable in the range of 1 to 100, with a default value of 50%.
Use the Imbalance Indicator to identify potential price reversal zones. Algorithms aim to cover the imbalance and trade the range in which it formed, representing a potential magnet for the price.
In the multi-timeframe version of the indicator, along with the current timeframe, rectangles from timeframes: 15 minutes, 1 hour, 4 hours, and 1 day are displayed by default (and can be adjusted in settings). Other timeframes (e.g., 1 week and 1 month or 30 minutes) can be selected in the settings.
You can activate/deactivate the display of imbalances from different timeframes of your choice by setting the corresponding checkbox.
Additionally, rectangles from different timeframes have different default levels of transparency, decreasing with increasing timeframe.
Frames on additional timeframes are disabled by default in transparency settings; adjust as needed in color settings.
Like in the previous version, you can customize the color scheme of rectangles for each timeframe individually.
Information display about timeframes other than the current one on imbalances is available and can be disabled in settings for each timeframe individually.
For your convenience, in the buyers' interest zone, a label is placed at 50% of the rectangle's width, spanning 3 candles. Now you can set a limit order right at the label without relying on Fibonacci retracements.
(RUS) Imbalance indicator (Multi-TimeFrame) - это индикатор, предназначенный для визуализации имбаланса между двумя соседними свечами на графике путем рисования прямоугольников. Он помогает определить доминирование покупателей или продавцов во время импульсного движение цены на восходящем или нисходящем тренде.
Вот как работает индикатор:
Он определяет направление тренда (вверх или вниз) на основе закрытия последних трех свечей. Тренд вверх определяется, если все три свечи закрылись выше своих открытий, а тренд вниз - если ниже.
В зависимости от направления тренда, индикатор вычисляет имбаланс между свечами. Имбаланс выражается в виде разницы между низом следующей свечи и верхом предыдущей свечи для восходящего тренда или между низом предыдущей свечи и верхом следующей свечи для нисходящего тренда. Значение имбаланса должно быть больше 0.
Если имбаланс обнаружен, индикатор рисует прямоугольник на графике. Прямоугольник начинается на свече с найденным имбалансом, верхняя граница прямоугольника находится на верхней границе имбаланса, а нижняя граница - на нижней границе имбаланса.
Цвет прямоугольника зависит от направления тренда: зеленый для восходящего тренда и красный для нисходящего тренда.
Прямоугольник продолжается вправо динамически, пока его не пересекут следующие свечи на 50% или более (по умолчанию). Пересечение может произойти различными комбинациями (тень, тело или тень + тело свечи). Как только это происходит, прямоугольник заканчивается на последней перекрывающей его свече. Процент перекрытия по высоте настраивается в интервале от 1 до 100, по умолчанию значение 50%.
Используйте Imbalance Indicator для определения зон вероятного возврата цены. Алгоритмы стремятся перекрыть имбаланс и проторговать диапазон, в котором он образовался, это потенциальный магнит для цены.
В мульти-таймфреймной версии индикатора, наряду с текущим таймфреймом, при первом запуске (и до момента, пока вы не измените это в настройках), отображаются прямоугольники с таймфреймов:
15 минут,
1 час,
4 часа,
1 день.
При этом другие таймфреймы (например 1 неделя и 1 месяц или 30 минут) можно выбрать в настройках.
Вы можете активировать/деактивировать отображение имбалансов с разных таймфреймов по вашему выбору, установив соответствующую галочку.
Кроме того, прямоугольники с разных таймфреймов по умолчанию имеют различную степень прозрачности, которая уменьшается по мере увеличения таймфрейма
Рамки на дополнительных таймфреймах, по умолчанию отключены настройками прозрачности, при необходимости измените это в настройках цвета.
Как и в предыдущей версии, вы можете настраивать под себя цветовую схему прямоугольников, причём для каждого таймфрейма в отдельности.
На имбалансах с отличных от текущего таймфреймов, доступно отображение информации о таймфрейме, данная опция отключается в настройках для каждого таймфрейма в отдельности.
Для вашего удобства, в зоне интереса покупателей, на 50% прямоугольника сделана метка шириною в 3 свечи, теперь не нужно натигивать фибо, можете сразу выставить лимитку по метке.

Swing Ranges [ChartPrime]Swing Ranges is an indicator designed to provide traders with valuable insights into swing movements and real-time support and resistance (SR) levels. This tool detects price swings and plots boxes around them, allowing traders to visualize the market dynamics efficiently. The indicator's primary focus is on real-time support and resistance levels, empowering traders to make well-informed decisions in dynamic market conditions.
Key Features:
Swing Box Visualization:
Swing Ranges excels at detecting swings in the price data and visually representing them with boxes on the price chart. This enables traders to quickly identify swing ranges, essential for understanding market trends and potential reversal points. VWAP POCs are also provided giving areas of high activity in each block.
Real-Time Support and Resistance Levels:
The core feature of Swing Ranges is its real-time support and resistance levels. These levels are dynamically calculated based on the volume-weighted data for each specific range. The indicator displays the strength of support and resistance zones with percentage bars, indicating the ratio between bullish and bearish volume. This real-time information empowers traders to assess the strength and significance of each SR level, enhancing their ability to execute well-timed trades.
ATR (Average True Range) Value:
Swing Ranges also includes an ATR value label, which shows the Average True Range for the selected period. ATR aids traders in understanding market volatility, enabling them to set appropriate stop-loss and take-profit levels for their trades.
VWAP (Volume Weighted Average Price) Information:
Traders c an readily access the VWAP value through the indicator's label. VWAP provides insights into the average price at which an asset has been traded, helping traders identify potential fair value areas and market trends.
Price Difference Percentage:
Swing Ranges displays the percentage difference between the high and low of each swing. This information allows traders to gauge the magnitude of price movements and assess potential profit targets more effectively.
The indicator also has a NV value. If the NV is high e.g. 10% or more there is indecision in the market and the market is trying to remain in a given range.
Settings Inputs:
1. Length Control:
The Length setting input in Swing Ranges allows traders to adjust the sensitivity of the indicator to detect swings. Traders can customize the length based on their trading strategies and timeframes.
2. ATR Period Adjustment:
The ATR Period input allows traders to fine-tune the calculation period for the Average True Range. This feature enables traders to adapt the indicator to different market conditions and asset classes.
Swing Ranges: Real-Time Support and Resistance Indicator is a comprehensive tool that combines swing visualization with dynamic support and resistance levels. By focusing on real-time SR levels, this indicator equips traders with the essential information needed to make confident trading decisions in ever-changing market conditions.

ChanLun ProChanLun, also known as Entanglement Theory or "缠论", is a highly regarded technical analysis methodology that originated in China. Since its introduction in 2006, ChanLun has rapidly gained significant attention and a strong following within the Chinese trader community due to its exceptional ability to navigate complex market dynamics.
ChanLun places great emphasis on market structure, price action, momentum, and the intricate interplay between market forces. It recognizes that the market operates in cyclical patterns and aims to capture the underlying structure and rhythm of price movements. Through meticulous analysis of the intricate relationships between price and time, it provides traders with a unique perspective on market trends, potential reversals, and critical turning points.
This indicator offers a meticulous and comprehensive implementation of the ChanLun theory. It facilitates in-depth analysis and visual representation of all essential components, encompassing “Candlestick Conversion”, "Candlestick Standardization", "Fractal", "Stroke", "Segment", "Pivot", and "Buying/Selling Point".
🟠 Algorithm
🔵 Step 1: Candlestick Conversion
In ChanLun, candlestick analysis focuses less on the opening/closing prices and wicks, but rather emphasizes the price range at which the stock price has reached. As a result, the initial step in ChanLun involves converting each candlestick to contain solely the high and low prices, disregarding other elements.
🔵 Step 2: Candlestick Standardization
In the second step, the converted candlesticks are standardized to ensure strict directional consistency and eliminate the presence of inner bars or outer bars. For any adjacent two candlesticks A and B where one’s price range completely encompasses another, A and B are merged into a new candlestick C. If A is trending up from its previous candle, then C will be defined such that high(C) = max(high(A), high(B)) and low(C) = max(low(A), low(B)). If A is trending down from its previous candle, then C will be defined such that high(C) = min(high(A), high(B)) and low(C) = min(low(A), low(B)).
After completing these steps, when considering any adjacent candlesticks A and B, we can always observe either of the following conditions:
1. high(A) > high(B) and low(A) > low(B)
2. high(A) < high(B) and low(A) < low(B)
The chart below illustrates how the candlesticks would appear after this step.
🔵 Step 3: Fractals
A "Fractal" refers to the pattern formed by three consecutive "standardized" candlesticks, where the middle candlestick shows a clear higher or lower value compared to the surrounding candlesticks. When considering three adjacent candlesticks, A, B, and C, we have either of the two conditions:
1. high(B) > high(A) and high(B) > high(C) and low(B) > low(A) and low(B) > low(C)
2. high(B) < low(A) and high(B) < low(C) and low(B) < low(A) and low(B) < low(C)
For #1 above, we refer to the combination of A, B, and C as a “Top Fractal”, whereas for #2 we designate it as a “Bottom Fractal”.
The chart below illustrates all the fractals, with the red triangles indicating the Top Fractals and the green triangles indicating the Bottom Fractals.
🔵 Step 4: Strokes
A “Stroke” is a line connecting a top fractal and a bottom fractal, subject to the following rules:
1. There must be at least one "free" candlestick positioned between these fractals, meaning it is not part of either the top or bottom fractal. This guarantees that a stroke encompasses a minimum range of five candlesticks from beginning to end.
2. The top fractal must have a higher price compared to the bottom fractal.
3. The endpoint fractals should represent the highest or lowest point throughout the entire span of the stroke. (There is an option within this indicator to enable or disable this rule.)
Strokes enable traders to identify and visualize significant price swings or trends while effectively filtering out minor fluctuations.
🔵 Step 5: Segments
A "Segment" is a higher-level line that connects the starting and ending points of at least three consecutive strokes, reflecting the current trend of the market structure. It continues to extend as new strokes emerge, until there is a break in the market structure. The break occurs when an uptrend forms a lower high and lower low, or when a downtrend forms a higher high and higher low. It's worth noting that during trading ranges, it is common for strokes to exhibit a higher high and lower low or a higher low and lower high pattern (similar to inner bars and outer bars). In such cases, the strokes will be merged in a similar manner as described earlier for candlesticks, until there is a distinct break in the market structure. Segments provide a relatively stable depiction of the market trend in a higher timeframe, as opposed to strokes.
It is important to note that the algorithm used to calculate segments from strokes can be recursively applied to the generated segments again, forming higher-level segments that represent the market trend on a even larger timeframe.
🔵 Step 6: Pivots
In ChanLun, the term "Pivot" does not indicate a price reversal point. Instead, it represents a trading range where the price of a security tends to fluctuate. Within a given "Segment," the pivot is determined by the overlap of two consecutive strokes moving in the opposite direction of the segment. When two downtrend strokes A and B form a pivot P within an uptrend segment S, the upper and lower bounds of the pivot are defined as follows:
1. upper(P) = min(high(A), high(B)
2. lower(P) = max(low(A), low(B))
The pivot range is typically where consolidation occurs and where there is a high trading volume.
If a future stroke, moving in the opposite direction of the current segment, overlaps with the upper and lower bounds of the pivot, it is merged into the existing pivot and extends the pivot along the x-axis. A new pivot is formed when two consecutive strokes moving in the opposite direction of the current segment, intersect with each other without overlapping the previous pivot.
Likewise, pivots can also be recursively identified within the higher-level segments. The blue boxes below represent the "Segment Pivots" that are identified within the context of higher-level segments.
🔵 Step 7: Buying/Selling Points
There are three types of buying/selling points defined in ChanLun.
1. Type 1 Buying and Selling Points: Also known as trend reversal points. These points are where the old segments terminate and new segments are generated.
2. Type 2 Buying and Selling Points: Also known as trend continuation points. These points occur while the price is in the midst of a trend and signify the continuation of the trend. In an uptrend, the Type 2 buying point is the rebound point after the price retraces to a previous low or support level, indicating that the price may continue to rise. In a downtrend, the Type 2 selling point is the pullback point after the price rallies to a previous high or resistance level, indicating that the price may continue to decline.
3. Type 3 Buying and Selling Points: These points indicate the retests of breakouts from pivot ranges. The presence of these retest points suggests that the price has the potential to continue its upward/downward movement above/below the pivot levels.
A discerning reader may notice that these buying/selling points are lagging indicators. For example, by the time a new segment is confirmed, multiple candlesticks have already occurred since the type 1 buying/selling point of that segment.
Indeed, it is true that the buying/selling points lag behind the actual market movements. However, ChanLun addresses this issue through the utilization of multi-timeframe analysis. By examining the confirmed buying/selling points in a lower timeframe, one can gather additional confidence in determining the overall trend of the higher timeframe.
🔵 Step 8: Divergence
Another core technique in ChanLun is the application of divergence to anticipate the emergence of type 1 buying/selling points. While MACD is the most commonly employed indicator for detecting divergence, other indicators such as RSI can also be utilized for this purpose.
🟠 Summary
In essence, ChanLun is a robust approach to technical analysis that integrates the careful examination and interpretation of price charts, the application of technical indicators and quantitative tools, and a keen attention to multiple timeframes. Its objective is to identify prevailing market trends and uncover potential trading prospects. What sets ChanLun apart is its holistic methodology, which blends both qualitative and quantitative analysis to facilitate informed and successful trading decisions.
🟠 NOTE
The freely available "ChanLun | AlgoTrader" script, published by the same account, incorporates only a limited set of fundamental concepts from ChanLun.
In contrast, this script is a premium invite-only version that represents a comprehensive implementation of the complete ChanLun methodology, specifically tailored for more experienced and professional traders.
________________________________________________________________________________
该指标严格按照缠论原文实现了包括“K线标准化”、“分型”、“笔”、“线段”、“中枢”和“买卖点”在内的所有关键元素。它旨在为缠友们提供一个准确可靠的缠论实现,以便快速而精准地分析市场,从而获得更优秀的交易业绩。
该指标的主要特点如下:
1. 实时标记所有缠论元素:该指标具备实时识别和标记分型、笔、线段、中枢和买卖点的功能,提供清晰的信号和准确的趋势判断。
2. 多种笔段算法选择:提供三种不同的笔算法(“老笔”、“新笔”和“4K”)以及两种线段算法(“特征序列”和“1+1终结”),满足不同交易者个性化需求,可根据偏好和策略选择最适合的算法。
3. 三级别联立:指标同步计算并显示笔、线段和递归高级段,提供更全面的市场动态分析。
4. 自定义颜色:用户可以根据个人喜好和需求自定义指标的颜色方案,与图表风格和视觉需求完美匹配。
5. 完美实现K线回放功能:指标充分利用了K线回放功能,让交易者能够回顾和分析历史市场数据,提高对市场趋势的研究和理解,增强市场洞察力和决策能力。

MonkeyblackmailThis script consists of several sections. test it and tell me your concerns. a lot of more works will be done
Volume Accumulation : The first part of the script checks for a new 5-minute interval and accumulates the volume of the current interval. It separates the volume into buying volume and selling volume based on whether the closing price is closer to the high or low of the bar.
Volume Normalization and Pressure Calculation : The script then normalizes the volume with a 20-period EMA, and calculates buying pressure, selling pressure, and total pressure. These calculations provide insight into the underlying demand (buying pressure) and supply (selling pressure) conditions in the market.
RSI Calculation and Overbought/Oversold Conditions : The script calculates the RSI (Relative Strength Index) and checks whether it is in an overbought (RSI > 70) or oversold (RSI < 30) state. The RSI is a momentum indicator, providing insights into the speed and change of price movements.
Volume Condition Check and Wondertrend Indicator : The script checks if the volume is high for the past five bars. If it is, it applies the Wondertrend Indicator, which uses a combination of the Parabolic SAR (Stop and Reverse) and Keltner Channel to identify potential trends in the market.
Swing High/Low and Fibonacci Retracement : The script identifies swing high and swing low points using a specified pivot length. Then, it draws Fibonacci retracement levels between these swing high and swing low points.
he monkeyblackmail script works well in the 5 minutes chart and combines several elements of technical analysis, including volume analysis, momentum indicators, trend-following indicators, volatility channels, and Fibonacci retracements. It aims to provide a comprehensive view of the market condition, highlighting key levels and potential trends in an easily understandable format. Don’t be too quick to start trading with it, first study how it work and you will blackmail the market.

Damage Indicator by Scipio ProScipio Pro's Damage Indicator detects strong momentum on tops and bottoms. It is intended for swing trading.
The script analyzes both recent and less-recent price action and performs candle stick analysis. It also uses SDs and multiple Bollinger Bands to find dynamic levels for entries.
A Bears Damaged signal emerges whenever there is convincing proof of strength at a bottom. Often, when the market reverses quickly, traders are caught offside and are forced to buy higher. The reverse goes for Bulls Damaged signals, which mean there is convincing proof of bearish strength at a (local?) top.
Whether the move gets legs depends in large part on the structure in which the show of momentum takes place. It is sensible to wonder after each signal whether the market structure (and other relevant context such as the majority of cash having been sidelined) dictates that risk-reward is skewed to the upside or to the downside. If, for example, a Bears Damaged signal emerges on the daily and risk-reward on the weekly is skewed to the upside, go 4x larger (again, just an example). If, on the other hand, the same signal emerges on the daily while the risk-reward is skewed to the downside on the weekly, bet much smaller and tighten your stop-loss. For best results, I suggest you always check one timeframe higher for your long-term risk-reward bias. (No financial advice, of course.)
Under Settings you'll find the so-called Noise Protection , which is switched "on" by default. We recommend you keep this switched on. Noise Protection ensures you do not see Damage signals on timeframes lower than the 4 hour. After all, chasing momentum on low timeframes is a losing game. The amount of noise increases exponentially as you move lower down the timeframes. Again, this indicator is for swing trades. Don't use it for scalping.
It should be useful for all assets, but is of course more useful on some than on others. As with all indicators, signals tend to be more meaningful if the asset in question is at least somewhat liquid, for instance.
As always, use at your own risk. Using indicators is no substitute for using one's brain.

Excess Invites Punishment (EIP) by Scipio ProScipio Pro's EIP is a reversal indicator. It is based on two types of evidence.
1) Proof of Fatigue -- The move that triggers the signal is losing momentum
2) Proof of Excess -- The move that triggers the signal is excessive
If both are the case, we get a signal.
The script uses standard deviations and Bollinger Bands for measuring excess and the ATR for the Breakout Continuation Protection (see below). For fatigue, the EIP detects divergences from indicators like OBV, MACD, RSI and more. It expresses these with a number. For example, if the EIP detects 9 bullish divergences, it prints the number 9 below the corresponding candle.
Hesitant Buy and Hesitant Sell mean there may have been a breakout recently, as measured with the ATR, meaning there is an increased likelihood of continuation. These can provide good buys or sells but more caution is warranted. You can adjust the so-called Breakout Continuation Protection in Settings. Doing so may lead to either more or less "hesitant" signals.
The signals don't repaint. Of course, the divergences get recalculated as the market evolves, as they should. But signals like Buy, Sell, Hesitant Buy, and Hesitant Sell never repaint.
The EIP is useful on many different time-frames and with many different assets, be they in stocks or crypto. The images below show results from BTC, MATIC, and S&P 500 over multiple years, both on small and large time-frames.
As always, use at your own risk. Using indicators is no substitute for using one's brain.
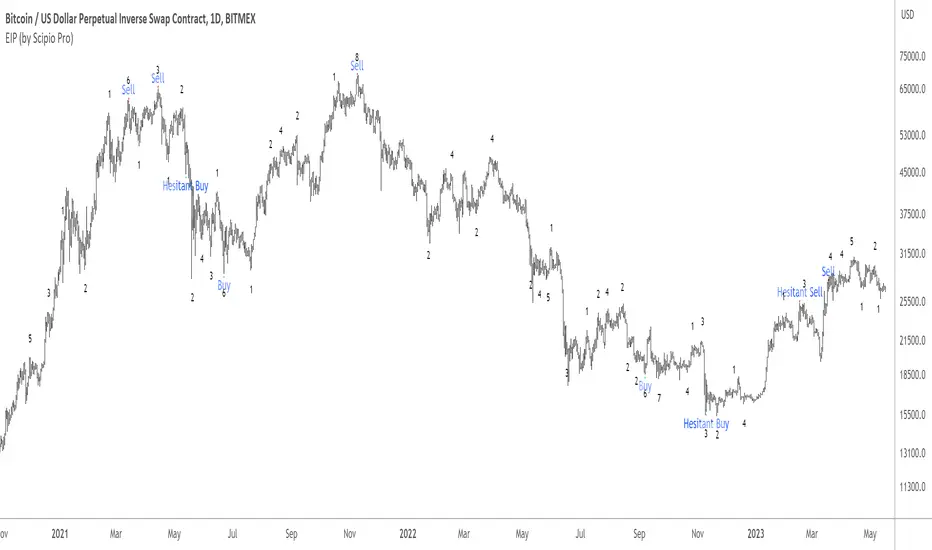
Wave TrendThe Wave Trend indicator is based on the Mason’s Line Indicator.
This indicator is a sentiment analysis tool designed to help traders understand and analyze market trends. It works by calculating the average investor satisfaction of a group of investors. The results are displayed as colored squares at the bottom of the chart. For more information, read the description of the Mason's Line Indicator.
This indicator is not developed for use on short timeframes. It is an indicator that is best suited for longer timeframes, ideal for swing trading or long-term trading.
There are two main display parameters:
Display the coloured squares according to the distance to the sma (default value).
Display the squares according to the position of satisfaction in relation to the scale of the indicator.
there are two secondary settings for each of these options:
Display the squares by normalizing the values of the dataset between 0 and 1.
Display the squares without normalizing the value of the dataset between 0 and 1 (default value).
Please note that the Wave Trend Indicator is not a guarantee of future market performance and should be used in conjunction with proper risk management. Always ensure that you have a thorough understanding of the indicator’s methodology and its limitations before making any investment decisions. Additionally, past performance is not indicative of future results.

Regression Channel Alternative MTF V2█ OVERVIEW
This indicator is a predecessor to Regression Channel Alternative MTF , which is coded based on latest update of type, object and method.
█ IMPORTANT NOTES
This indicator is NOT true Multi Timeframe (MTF) but considered as Alternative MTF which calculate 100 bars for Primary MTF, can be refer from provided line helper.
The timeframe scenarios are defined based on Position, Swing and Intraday Trader.
Suppported Timeframe : W, D, 60, 15, 5 and 1.
Channel drawn based on regression calculation.
Angle channel is NOT supported.
█ INSPIRATIONS
These timeframe scenarios are defined based on Harmonic Trading : Volume Three written by Scott M Carney.
By applying channel on each timeframe, MW or ABCD patterns can be easily identified manually.
This can also be applied on other chart patterns.
█ CREDITS
Scott M Carney, Harmonic Trading : Volume Three (Reaction vs. Reversal)
█ TIMEFRAME EXPLAINED
Higher / Distal : The (next) longer or larger comparative timeframe after primary pattern has been identified.
Primary / Clear : Timeframe that possess the clearest pattern structure.
Lower / Proximate : The (next) shorter timeframe after primary pattern has been identified.
Lowest : Check primary timeframe as main reference.
█ FEATURES
Color is determined by trend or timeframe.
Some color is depends on chart contrast color.
Color is determined by trend or timeframe.
█ EXAMPLE OF USAGE / EXPLAINATION

Swing BoxesHey, folks!
Sorry for not posting anything for such a long time. Don't have enough ideas and resources to get inspiration, so trying to brainstorm good stuff in my free time from university studies.
But despite my absence more I now have 300+ people subscribed to me! Thanks, guys, for keeping interest for my work, as I still do value each boost on my script, for real :)
So here is new script , enjoy!
Swing Boxes is pretty simple indicator, which plots signals with "boxes", that help you determine price targets.
What is the idea behind?
I wanted to make indicator, that could help me make swing trades with nice accuracy (as all we want, lol), and for signal criteria I decided to use highs and lows of the price . Then I started coding some ideas to see which of them could be worthy. And, actually, Swing Boxes appeared to be good. But the thing is, that I didn't intend to build them, they appeared as an anomaly from my code :)
I started to explore this anomaly (it looked super cool, but was repainting hard) to fix it and I succeeded, now Swng Boxes don't repaint.
The main idea is that when price goes above it's highest value of p-bars back or below it's lowest value p-bars back, then there is a some god probability, that price will continue to follow current direction.
And the things about Swing Boxes is that when there is a good trend movement, the boxes become super small to track price movement and when price breaks out in the counter-trend direction, then you will be able to almost perfectly catch a top or a bottom! But most of the signals won't be so high-quality, so don't think that is this some holy grail to trade swing-trading, because it is not.
Signal logic
Quick hint:
- epsilon(variable e ) = ATR * ATR_Factor . It is used to determine box's sensitivity to price changes.
If previous close is higher than variable, which contains previous HIGHEST value (variable h in the code), then update the this variable by taking up-to-date highest value and add epsilon( e ) to it;
If previous close is lower than variable, which contains previous LOWEST value (variable l in the code), then update the this variable by taking up-to-date lowest value and substract epsilon( e ) from it.
Variables decribed above ( h and l ) are box's top and bottom respectively, so if price cross them, it is logical to update it is value.
Settings and what is what
Swing Box Period - numbers fo bars in the past to find highest and lowest price from. The bigger the input, the bigger the boxes will be;
ATR Period;
ATR Factor - multiplier for ATR, determines sensitivity for price changes. The bigger this input, the more accurate signals will be, but less the probability that the signal will be on the top or a bottom.
Show Boxes? - when chosen, plots box's top and bottom. Used to determine price targets.
Show Baseline? - when chosen, plot's baseline, which midline between box's top and bottom.
How to use?
This indicator plots green and red triangles by default.
- Green triangle --> Buy ;
- Red triangle --> Sell ;
As I've said before, many signals from indicator will probably be garbage, so you need to tune settings for youself, so it could satisfy you .
You can enable showing boxes to see box's top and bottom. Box's bottom --> your entry, top --> your profit target.
If you find a way to sort bad signals, you will be able to trade with super cool RR, because the signal from Swing Boxes appear to be a good one, there is almost 95% probability, that price will not even come close to your stop loss, so you can trade with super small stop-losses! Smaller stop-loss --> smaller risk --> smaller loss --> bigger profit, it is that easy.
Also you can enable baseline to use at as your 1st TP, and box's top/bottom as 2nd TP, closing 25% on TP1 and the rest on TP2 (but that is just mine recommendation, you can use different RM (risk-management), if you want).
Also you can use baseline as your S/R (Support/Resistance) line, test it out on your charts.
And please, hear me out: as all other indicators out here on the TradingView, Swing Boxes ARE NOT meant to be traded in solo! Many bad signal can go in a row, so PLEASE find your way to filter out bad signals with other indicators.
You can see here the example of a garabge-class signal in a row, so be don't be deluded!
I do hope that somebody will suggest and idea to improve this thing, as I personally don't have enough time to think about it because of my university studies, but I will probably try it make this thing better throughout the time.
And that's it for now, folks! If you have any ideas for scripts, strategies or anything else, feel free to DM me or leave a comment, I will check it.
Hope you will find this script useful.
Take your profits!
- Tarasenko Fyodor
