Bull Market Support Band Bull Market Support Band – Description
The Bull Market Support Band is a technical indicator that highlights the zone between the 20-week Simple Moving Average (SMA) and the 21-week Exponential Moving Average (EMA).
This band acts as a key support area during strong uptrends (bull markets).
In bull markets, price tends to stay above this band, with pullbacks often finding support within it.
A sustained breakdown below the band frequently signals weakening momentum or the transition into a sideways or bear phase.
In bear markets, the band often flips into resistance, where relief rallies fail.
By filling the area between the SMA 20 (Weekly) and EMA 21 (Weekly), the indicator provides a clear visual reference for whether the market is trading above or below this critical support band.
Supportband
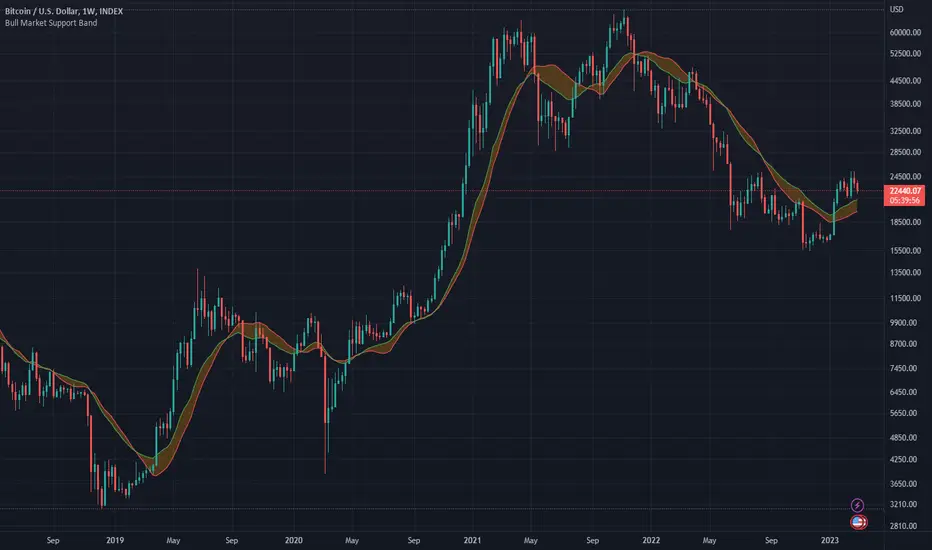
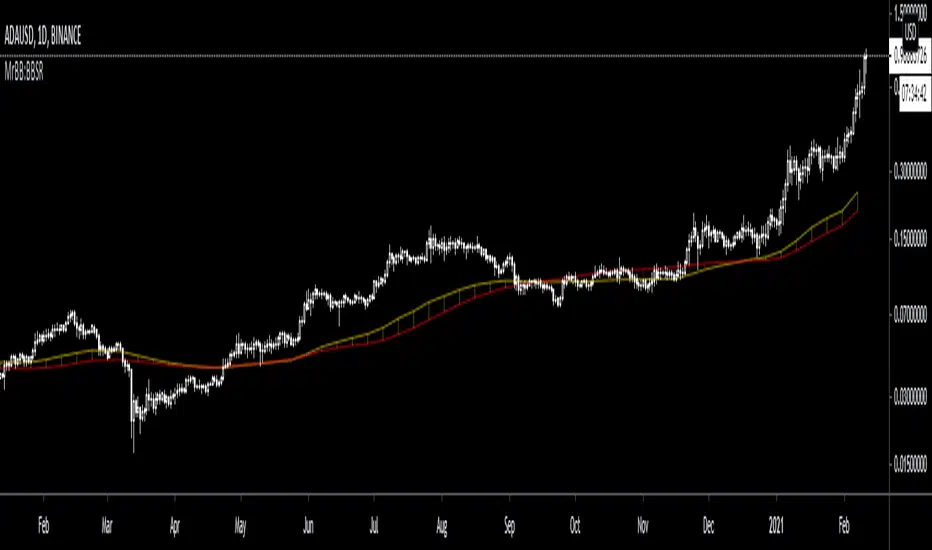
Bull Market Support Band (20w SMA, 21w EMA)This moving average indicator is a bull market support band. It's significance comes from the previous bull runs where the price was bouncing off or riding from a distance the support band until the end of the market cycle. For example, during the 2017 bull run, Bitcoin had several 30-40% corrections to the support band.
The green line represents the 20 weeks simple moving average and the red line represents the 21 weeks exponential moving average. The best way to read the current value is to look at the weekly chart, but any time frame will display the same values.
MrBB:BullBear Support BandVery simple and effective S/R band. Created bycombining the weekly 21EMA and weekly 20SMA, it provides strong support/resistance depending on market direction, and works as a basing area for retraces during parabolic (and normal) bull markets.