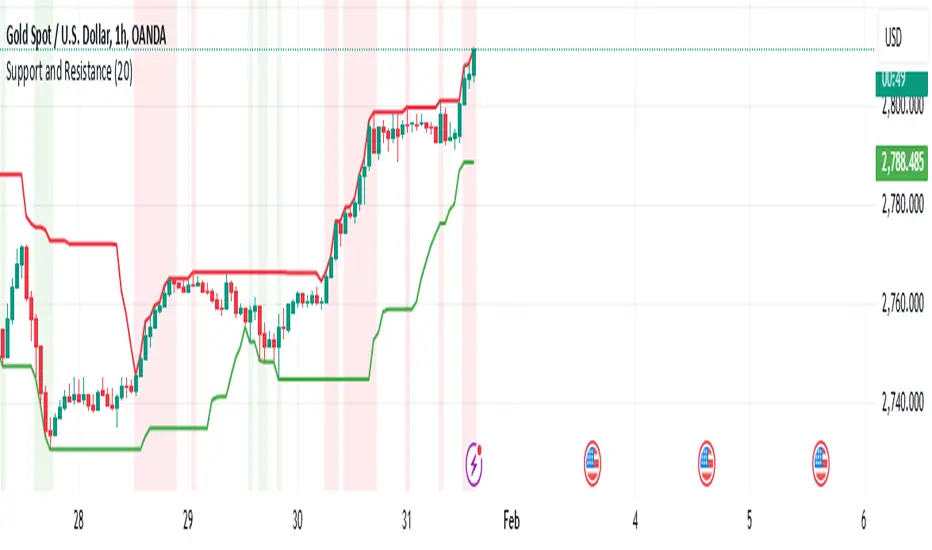
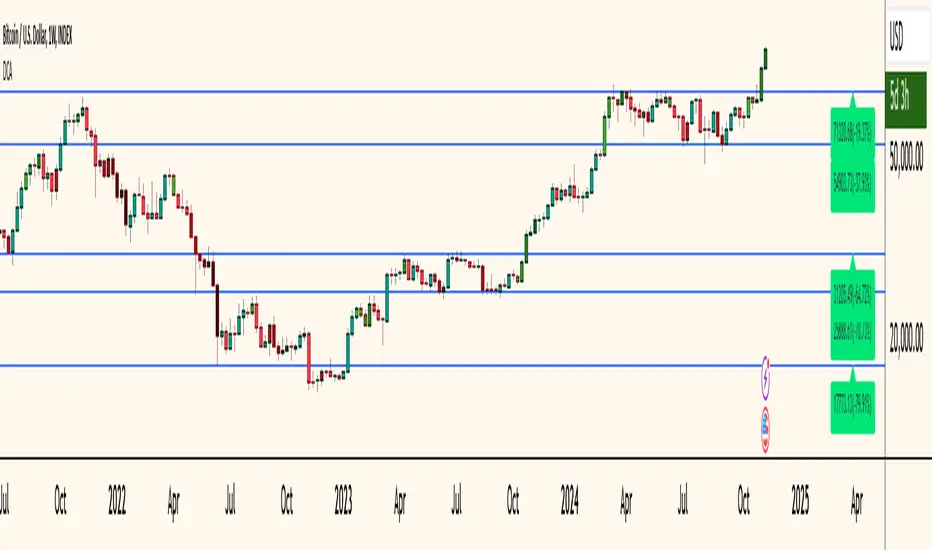
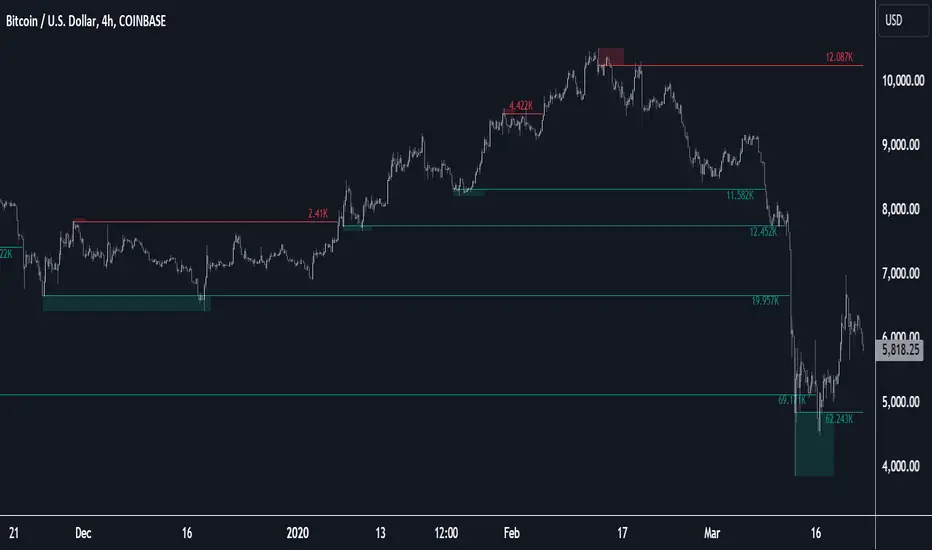
Hello fellow tradeurs, I couldn't find one similar on TV so wanted to make it.. Took me a little while to figure some things out as I am in new coding territory with this script. I had a hard time finding ways to make only a partial zone/box disappear if price only crossed part of it. Nonetheless, I figured it out so I hope you enjoy the outcome. Now, allow me to...
This brings together a number of variables to produce trend predictions that could be utilized as decision-making tools. Uses the aforementioned price and volume derivatives - A moving average and three weighted moving averages (WMA1, WMA2, WMA3) - Super Trend Line (ST) - Opening Range Breakout on Five Minutes, Resistance Bands Pocket pivots, support, and price...
Discretionary traders often use support and resistance zones that are based on past price action of the instrument traded. This simple script is used to plot support and resistance zones for a given instrument. The data for the zones themselves has to be determined by the past price action of the instrument and are not based on the provided data by...
Hello All, For long time I have been getting a lot of requests for Support/Resistance Multi Time Frame script. Here ' Support Resistance Channels/Zones Multi Time Frame ' is in your service. This script works if the Higher Time Frame you set is higher than the chart time frame. so the time frame in the options should be higher than the chart time frame. The...
█ This Indicator is based on Pivot Points. It aggregates closed Pivot Points to determine a " Pivot Average " line. Pivot Points here refer to highs and lows. █ Usages: Pivot Average can be used as resistance or breakout area. It is also very usefull to find battle zones. It can also be used as a trend indicator: when the price is below, trend is down, when price...
What? Price Action in Action is an indicator to help Price Action learners and practitioners to get everything related for Price Action in one place. Price Action is: Price + Volume = Action In this indicator, we have the following features available: Support/Resistance Using the RSI with different periods in a multiple of 7 (7, 14, 21, 28), we...
This indicator draws support line and resistance lines in the price chart. How ? For drawing the support/resistance line we need to first determine the demand and supply. We are using too-familiar indicator RSI to determine when the script is oversold and overbought. Now oversold (in RSI) is not a point, it’s a zone. The RSI indicator comes below 30, stays...
█ This Indicator is based on Pivot detection to show bands and channels. The pivot price is similar to a resistance or support level. If the pivot level is breached, the price should continue in that direction. Or the price could reverse at or near this level. █ Usages: Use channels as a support & resistance zone. Use bands as a support & resistance zone....
Technical indicators are not limited. Hence, here is another indicator with the combination of OBV, RSI, and MACD along with support, and resistance that follows the price while honoring the moving average of 200, 90 & 50. The default lookback period of this indicator is 21 though it is changeable as per the user's desire. The highest high and lowest low for the...
This script uses the standard pivot-high/pivot-low built-in methods to identify pivot points on the chart as a base calculation for the zones. Rather than displaying basic lines, it displays a zone from the original pivot point to the closest part of the available body on the same candle. The script comes in handy by utilizing Pinescripts available input.source()...
This script displays a histogram from the mean and standard deviation of the visible price values on the chart. Bin counting is done relative to high/low prices instead of counting the price values within each bin, returning a smoother histogram as a result. Settings Bins Per Side: Number of bins computed above and below the price mean Deviation...
Hello Traders, I would like to introduce you Structured zigzag support&resistance. It is based on the ZigZag semafor script made by DevLucem so shout out to him The indicator is used to spot future multi-level Supports and Resistance zones. It is also useful to spot HL or LL or HH or LH zones I's the same zigzag indicator as my other zigzag indicator with...
This indicator will automatically plot support and resistance levels and will also allow you to overlay multi time frame support and resistance on any time frame that you are currently conducting analysis on. In addition you can also set alerts when a support and resistance level is tested, fine tune how many levels you would like to view on your charts, option to...
I. How to use this indicator : ------------------------------ I.1. Set your teadingview theme to dark theme. I.2. Gammaprod indicator is valid for forex, stock and but more valid for crypto. I.3. Use three timeframe for more validation (choose between those, that fit to your trading style) : - Timeframe 1m, 5m, and 15m for Scalping - Timeframe 30m, 1h and 4h...
Support and Resistance Multiperiod (Zig Zag Based) What is the indicator? • The indicator is a multi period (up to 5 lengths) Support and Resistance indicator calculated based on Zig Zag. Who can use? Scalpers to Long term investors What timeframe to use? • Any timeframe What are the lines? • Green lines are Support levels. • Orange lines are...
This auto support and resistance indicator uses percentage deviations from the previous session close to calculate levels. It provides arrows as signals when it detects 2 wicks in the last 5 bars from a support or resistance level. Includes alerts for price crossing any level as well as real time percentage gaps from current price to the next closest support and...
Indicator showing resistances and support, based on pivots location When a new pivot location is near from a resistance/support the latter gains weight. You can modify multiple parameters : Nb Max res/sup : Define the number max res/sup to keep in our res/sup history array. The greater it is the older bar index will be taken. Nb show res/sup : Define...
SSL HYBRID Advanced SSL Hybrid is an Advanced version of the default SSL Hybrid by Mihkel00. Multiple Indicators MACD Crossover Signals EMA 200 Bollinger Band Bollinger Band Squeeze ADX Crossover and ADX level CCI Over Brought /Sold Stochastic Over Brought /Sold RSI Over Brought /Sold CREDITS QQE MOD byMihkel00 SSL Hybrid by Mihkel00 Waddah...