Support and Resistance (MTF) | Flux Charts💎 GENERAL OVERVIEW
Introducing a groundbreaking support and resistance indicator designed to revolutionize your trading experience on TradingView! This innovative tool operates across three distinct timeframes, offering a comprehensive view of market dynamics to help you make informed trading decisions.
The indicator offers a large variety of features :
Select Up To 3 Timeframes
Select Strength Of Supports & Resistances
Select Between Zones & Lines
Show Breaks & Restests
Break & Retest Alerts
Avoid False Breaks
Inverse Color After Broken
Expand Lines & Zones
🚩UNIQUENESS
What sets this indicator apart is its ability to seamlessly integrate and analyze support and resistance levels across multiple timeframes simultaneously. By combining data from three different timeframes, this indicator provides a holistic perspective on market trends and key levels. The adaptive nature of this tool ensures a dynamic assessment of support and resistance zones, empowering traders to adapt to changing market conditions efficiently.
⚙️SETTINGS
1. General Configration
Support & Resistance Count -> Select between 1-3 support & resistance zones for each timeframe.
Pivot Range -> The pivot range is taken into calculations when finding high & low pivots in the chart. Increase if you need a more general look at the support & support zones, or decrease if you need a more detailed look.
Strength -> The strength of the support & resistance zones are determined by how many times the price touched the zone in the past. You can increase the strength up to 4.
Expand Lines & Zones -> If enabled, the support & resistance zones will be expanded to both left and right infinitely. If disabled, the support & resistance zones will be clamped between the time they are first seen, and the time they become broken.
2. Support & Resistance Zones
Enable Zones -> The support & resitsance lines will be converted to zones if enabled.
Zone Width -> The width of the zones. 1 -> %0.05, 2 -> %0.06, 3 -> %0.075.
3. Timeframes
Enable & Disable up to 3 different timeframes using the checkboxes. You can set the timeframes using the selectboxes.
4. Breaks & Retests
Show Breaks -> Points the break points with a blue label with the text "B" on it.
Show Retests -> Points the times when the support & resistance zones are being retested in the current chart.
Avoid False Breaks -> If enabled, the algorithm will try to avoid false break points by comparing the average volume of the point to a longer average volume.
Break Volume Threshold % -> If "Avoid False Breaks" option is enabled, the average volume of the break point should surpass the general average volume by this percent. Higher values mean it's less likely to be a break.
Inverse Color After Broken -> As broken support & resistance zones often become resistance & support zones respectively, if you enable this option the broken zones will inverse their color.
5. Alerts
To make the alerts work, you'll need to add an alert to the chart using the TradingView® alert feature.
Enable Retest Alerts -> You will receive alerts when restests happen on any of the support & resistance zones. "Show Retests" option needs to be enabled to get alerts of this category.
Enable Break Alerts -> You will receive alerts when breaks happen on any of the support & resistance zones.
Support_and_resistance

Monthly Range Support & Resistance [QuantVue]The Monthly Range Support & Resistance Levels is an advanced analytical tool designed to assess monthly price movements and provide potential support and resistance levels.
This tool examines the average monthly price fluctuations over the past 7 months (default), and creates support and resistance levels based on the opening price.
The indicator also considers a standard deviation multiplier.
This enables traders and investors to identify potential price zones.
The support and resistance levels are dynamically updated every month.
Users can also choose to view previous daily levels as well.
Customizable settings for this tool include:
-Averaging Period: Adjust the number of months to calculate the average monthly range.
-Standard Deviation Multiplier: Modify the standard deviation multiplier to fine-tune the sensitivity of the support and resistance levels. A higher multiplier will result in wider levels, accommodating higher price fluctuations.
-Toggle Support & Resistance Prices: Easily switch on or off the display of support and resistance price levels.
-Show Monthly Open Line: Display the monthly opening price as a reference point on the chart.
-Show Previous Levels: Choose whether to display past daily support and resistance levels.
Note: this indicator works on a 1 hour timeframe or higher
Give this indicator a BOOST and COMMENT your thoughts!
We hope you enjoy.
Cheers!

Support and Resistance Signals MTF [LuxAlgo]The Support and Resistance Signals MTF indicator aims to identify undoubtedly one of the key concepts of technical analysis Support and Resistance Levels and more importantly, the script aims to capture and highlight major price action movements, such as Breakouts , Tests of the Zones , Retests of the Zones , and Rejections .
The script supports Multi-TimeFrame (MTF) functionality allowing users to analyze and observe the Support and Resistance Levels/Zones and their associated Signals from a higher timeframe perspective.
This script is an extended version of our previously published Support-and-Resistance-Levels-with-Breaks script from 2020.
Identification of key support and resistance levels/zones is an essential ingredient to successful technical analysis.
🔶 USAGE
Support and resistance are key concepts that help traders understand, analyze and act on chart patterns in the financial markets. Support describes a price level where a downtrend pauses due to demand for an asset increasing, while resistance refers to a level where an uptrend reverses as a sell-off happens.
The creation of support and resistance levels comes as a result of an initial imbalance of supply/demand, which forms what we know as a swing high or swing low. This script starts its processing using the swing highs/lows. Swing Highs/Lows are levels that many of the market participants use as a historical reference to place their trading orders (buy, sell, stop loss), as a result, those price levels potentially become and serve as key support and resistance levels.
One of the important features of the script is the signals it provides. The script follows the major price movements and highlights them on the chart.
🔹 Breakouts (non-repaint)
A breakout is a price moving outside a defined support or resistance level, the significance of the breakout can be measured by examining the volume. This script is not filtering them based on volume but provides volume information for the bar where the breakout takes place.
🔹 Retests
Retest is a case where the price action breaches a zone and then revisits the level breached.
🔹 Tests
Test is a case where the price action touches the support or resistance zones.
🔹 Rejections
Rejections are pin bar patterns with high trading volume.
Finally, Multi TimeFrame (MTF) functionality allows users to analyze and observe the Support and Resistance Levels/Zones and their associated Signals from a higher timeframe perspective.
🔶 SETTINGS
The script takes into account user-defined parameters to detect and highlight the zones, levels, and signals.
🔹 Support & Resistance Settings
Detection Timeframe: Set the indicator resolution, the users may examine higher timeframe detection on their chart timeframe.
Detection Length: Swing levels detection length
Check Previous Historical S&R Level: enables the script to check the previous historical levels.
🔹 Signals
Breakouts: Toggles the visibility of the Breakouts, enables customization of the color and the size of the visuals
Tests: Toggles the visibility of the Tests, enables customization of the color and the size of the visuals
Retests: Toggles the visibility of the Retests, enables customization of the color and the size of the visuals
Rejections: Toggles the visibility of the Rejections, enables customization of the color and the size of the visuals
🔹 Others
Sentiment Profile: Toggles the visibility of the Sentiment Profiles
Bullish Nodes: Color option for Bullish Nodes
Bearish Nodes: Color option for Bearish Nodes
🔶 RELATED SCRIPTS
Support-and-Resistance-Levels-with-Breaks
Buyside-Sellside-Liquidity
Liquidity-Levels-Voids

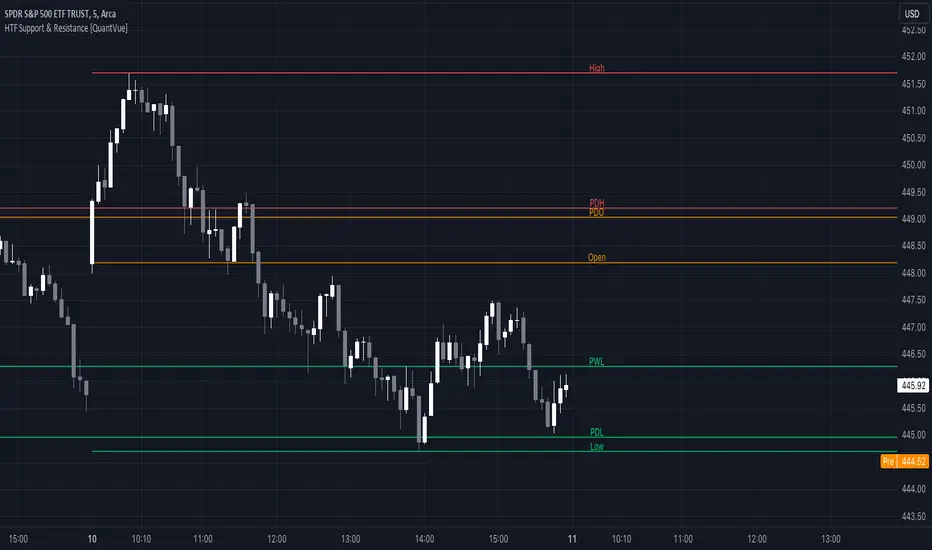
HTF Support & Resistance [QuantVue]The "HTF Support / Resistance" indicator highlights critical price levels across multiple timeframes helping you recognize major support/resistance areas.
Whether you're a day trader needing to understand the current day's price action, or a long-term investor looking to analyze yearly trends, this indicator can be a valuable addition to your trading toolkit.
The daily levels, which can be enabled or disabled according to your preference, will give you insights into the open, high, and low levels for the current and previous day.
Similarly, weekly levels provide information for the current and previous weeks, while monthly levels cover the current and previous months.
In addition, the indicator offers more extended views through its quarterly and yearly levels. These will help you understand long-term trends and major support/resistance areas, and they can be particularly beneficial for major support/resistance levels.
Features:
🔹Visualization: View support and resistance levels from Daily, Weekly, Monthly, Quarterly, and Yearly timeframes.
🔹Customizable Appearance: Tailor the display colors and line styles for each level according to your preferences.
🔹Clear Labeling: Each level is clearly labeled for quick identification.
🔹Extension Option: Opt to extend the support and resistance lines across the chart for better visualization.
Give this indicator a BOOST and COMMENT your thoughts!
We hope you enjoy.
Cheers.
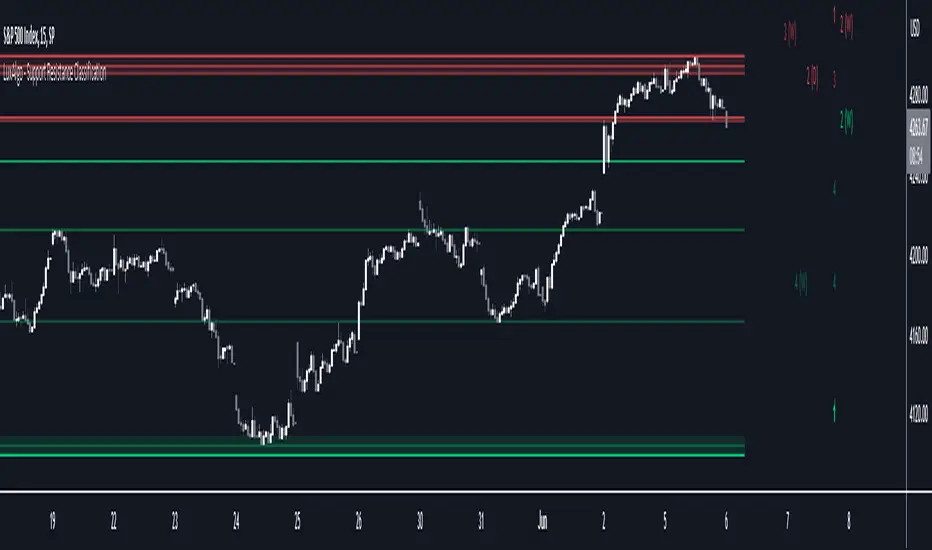
Support Resistance Classification [LuxAlgo]The Support Resistance Classification indicator shows SR levels from a user-defined range using higher time-frame data (HTF). Levels are classified 1 through 10 based on their strength, with lower values indicating stronger support/resistance levels.
This indicator doesn't use visible range functionality, in contrast to our Support Resistance Classification (VR) indicator, it uses a set lookback period to find support/resistance levels.
Since both techniques cannot be used together in 1 script, we developed a separate, NON-VR version.
🔶 USAGE
Certain indicators on higher timeframes can provide longer-term support/resistance levels on lower timeframes. Users can use the provided levels and use them as references for future support/resistance levels.
The classification algorithm measures the strength of a support/resistance level using the set range and is in a range of 1 to 10, with higher values indicating a weaker support/resistance.
Supports/resistances highlighted by the indicator can be used for future applications by marking them on the chart (quickly done with alt + h).
🔶 DETAILS
All calculations are based on what is seen in the last amount of bars, which is the period between the blue vertical line and the last candle:
Since only Swings which are not broken are included, every break would exclude that swing. Therefore, even when 'value' is chosen at Settings ('Value'), breaks are always calculated on the entire line.
🔶 SETTINGS
Lookback: Amount of bars from current bar to x bars back , this is the period where support/resistance levels are calculated.
Fade: After x breaks the line becomes invisible
Value:
value:
• SMA, upper/lower: the breaks are triggered on the moving average itself
• Fibonacci Pivot Point levels, Previous High, Previous Low: only last HTF values can be used for breaks
• Swings (see SWING SETTINGS)
line:
• SMA, upper/lower: the breaks are triggered on the entire line, based on its latest value
• Fibonacci Pivot Point Levels, Previous High, Previous Low: breaks are triggered on the entire line, based on its latest value
• Swings (see SWING SETTINGS)
🔹 Swing Settings
Swings are always calculated at the current timeframe, setting an HTF is not applicable to Swings.
Left/Right: for Swing calculation ( pivothigh , pivotlow )
Show: enables you to see the pivot points
🔹 Set
N°: The concerning number
TYPE:
• SMA (Simple Moving Average)
• Previous High/Low
• Upper/Lower ( Bollinger Bands )
• Pivot Point levels : "Fibonacci"
LENGTH: sets the 'Number of bars', needed for calculations (applicable for SMA, upper/lower)
MULT: sets the 'Standard deviation factor' (only applicable for upper/lower - BB)
HTF: sets 'Higher Time Frame' (applicable for SMA, upper/lower, Previous High/Low, Fibonacci)
🔹 Show Values
You can make up to 5 values visible (if you want to check/verify), except for Swings (see SWING SETTINGS)
To do so, enable (A -> E), and choose the N° you want to see.
This also is a useful tool if you're not sure which value you want to set.
Multi Timeframe Support and Resistance [ABA Invest]About
Automatic level of support and resistance ( SnR ) in the chart. It helps users to decide where is the level of SnR and also optimize the level by changing the input base on their needs
Input:
Pivot - The number of bars left and right side of the pivot to choose how detailed the SnR level
Type - To draw the line on the candle wick endpoints or body
Timeframes option - you can choose to display other timeframes beside the current chart timeframe
Adaptive moving average - to help users identify breaks of the SnR level with the moving average line
Line length - length of the moving average line if you activate the adaptive moving average option
How to use:
Attach the indicator to the chart and then you will find the red and green lines. Red line work as resistance level and green line works as support level and also you can merge adjacent line levels into an area of SnR.
The Adaptive moving average (AMA) line function is to see the break of SnR level and prepare for the setup.
Buy setup: AMA line break resistance level, when the price retest the support (the previous break resistance) we can enter buy trade
Sell setup: AMA line break support level, when the price retest the resistance (the previous break support) we can enter sell trade
Note: Don’t blindly follow the AMA trend signal

Gap ZonesSharing a simple gap zone identifier, simply detects gap up/down areas and plots them for visual reference. Calculation uses new candle open compared to previous candle close and draws the zone, a mid point is plotted also as far too often it's significance is proven effective.
Works on any timeframe and market though I recommend utilizing timeframes such as weekly or daily for viewing at lower timeframes such as 5, 15 or 30 minutes.
Often price is observed reaching towards zone high/mid/low before rejection/bouncing. These gap zones can give quantitative basis for trade management.
Future features may include alerts based on price crossing up/down gap low, mid and highs. Feel free to message with any other suggestions.

Structured zigzag support&resistance [LM]Hello Traders,
I would like to introduce you Structured zigzag support&resistance. It is based on the ZigZag semafor script made by DevLucem so shout out to him
The indicator is used to spot future multi-level Supports and Resistance zones. It is also useful to spot HL or LL or HH or LH zones
I's the same zigzag indicator as my other zigzag indicator with highlight on diagonal lines(highs and lows are automatically classified and also new types of diagonal lines that connects low or highs and extends to right are drawn )
It has two settings:
Fist is to control horizontal lines and zigzag setting
Second is to control diagonal lines
I hope you will enjoy it as I enjoyed to write it.
Lukas

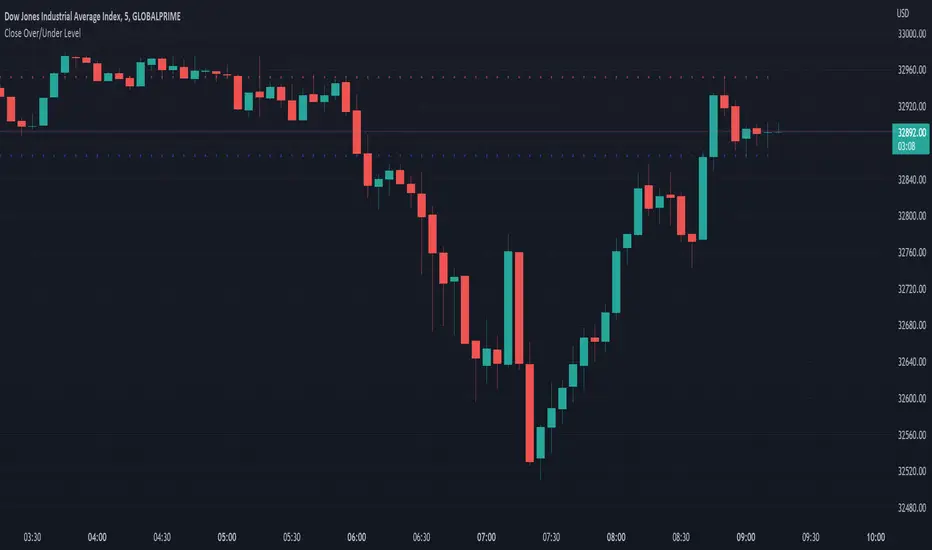
Close Over/Under LevelIf you want to be alerted when a price closes above or below a given level(s), then this indicator is for you! 😁 Whether you're looking for a breakout, or some change of structure, etc, this should come in handy.
Usage:
Just add a level(s) (anything above 0).
Optionally plot lines.
Set alerts as normal.
Enjoy!
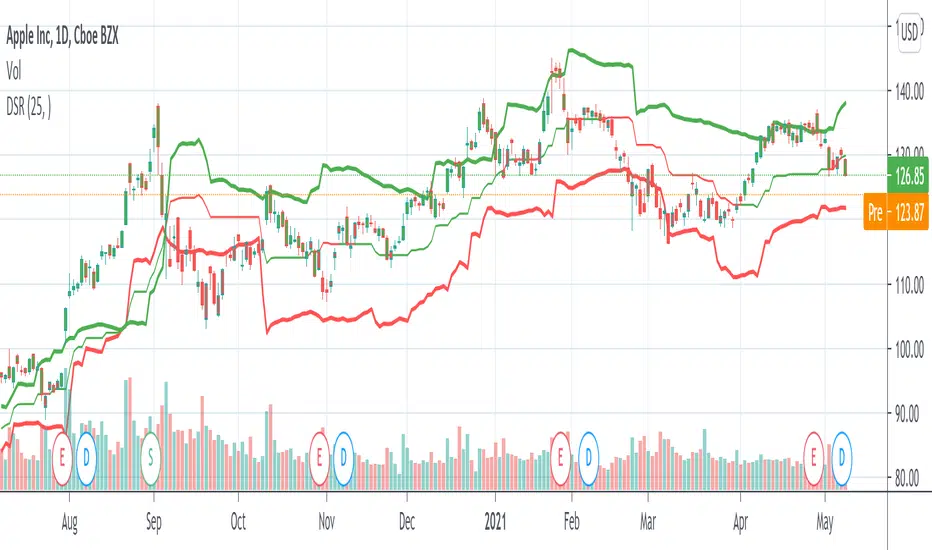
Dynamic Support And Resistance [CC]The Dynamic Support And Resistance Indicator was created by Mike Siroky (Stocks and Commodities pgs 14-18) and this is a handy indicator that will show you useful support and resistance levels no matter how the stock is doing right now. I have color coded the middle line to show buy and sell signals so buy when the line turns green and sell when it turns red.
Let me know if there are any other indicators you want me to publish!