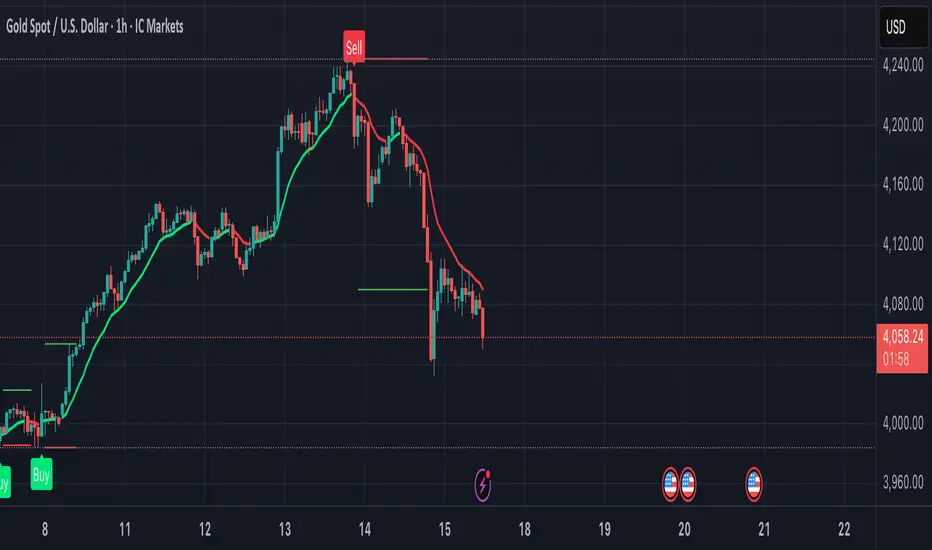
SuperTrend with PP and SMASuperTrend with PP and SMA:
-SuperTrend
-Pivot Points (Pivot Support & Resistance)
-OBV-LIN
-5 Moving Averages
-Linear Regression Channel
Supertrend
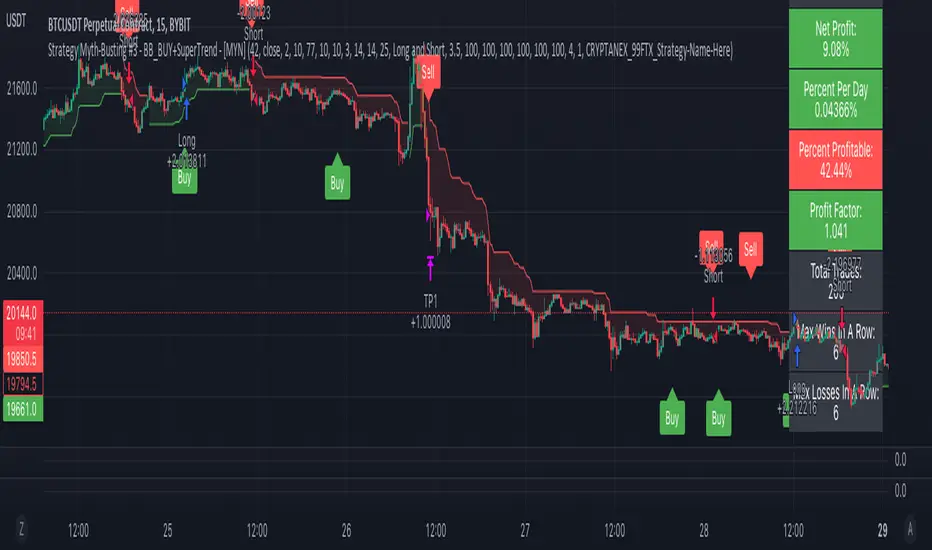
Strategy Myth-Busting #3 - BB_BUY+SuperTrend - [MYN]This is part of a new series we are calling "Strategy Myth-Busting" where we take open public manual trading strategies and automate them. The goal is to not only validate the authenticity of the claims but to provide an automated version for traders who wish to trade autonomously.
Our third one we are automating is one of the strategies from "The Best 3 Buy And Sell Indicators on Tradingview + Confirmation Indicators ( The Golden Ones ))" from "Online Trading Signals (Scalping Channel)". No formal backtesting was done by them so wanted to validate their claims.
If you know of or have a strategy you want to see myth-busted or just have an idea for one, please feel free to message me.
This strategy uses a combination of 2 open-source public indicators:
BB_Buy and Sell by guikroth (default settings)
SuperTrend from TradingView's Technicals (default settings)
Trading Rules
15 min candles
Long
Long condition when BB_BUY indicates buy signal and SuperTrend is green
Short
Short condition when BB_BUY indicates Sell signal and SuperTrend is red
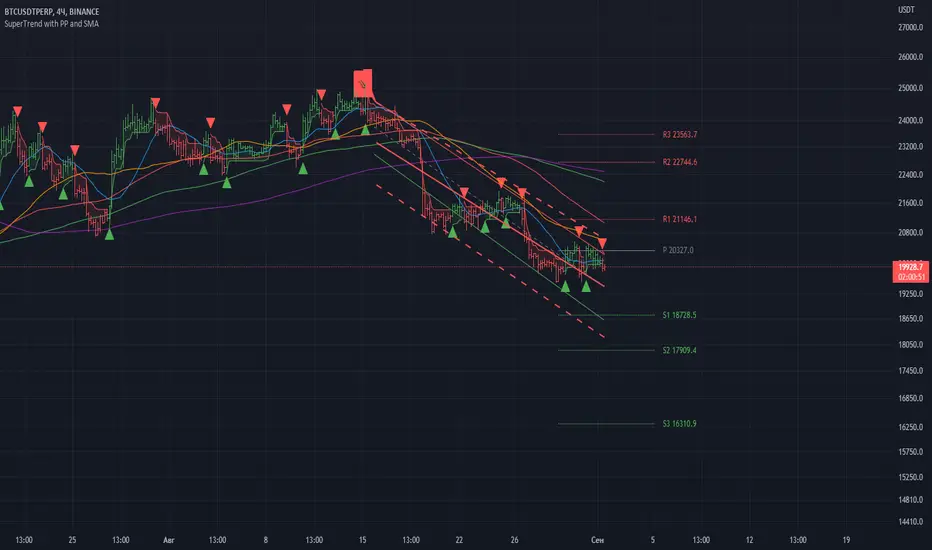
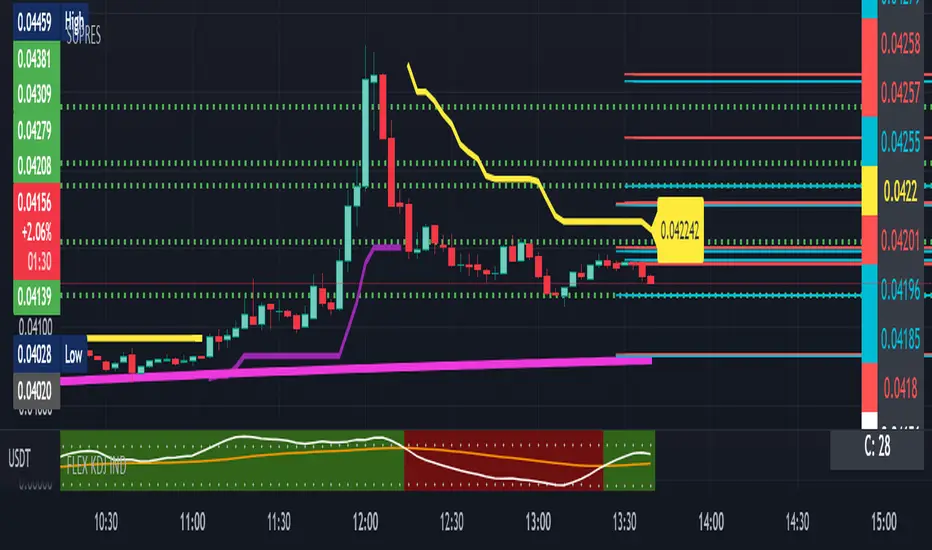
SUPRESHi Dears!
I hope that you enjoyed my "FLEX KDJ IND" till today!
Here, I want to publish one of my other golden indicators for you!
Contents:
+ SUPRES
+ SUPERTREND
+ T.O Line
- SUPRES (SUPPORT/RESISTANCE) is sensitive to trading volumes and with "BACHWARD" you can adjust the length of previous indices in investigation and "MEMORY" is an argument for calling maximum lines that have to be kept for "SUPPORT" and "RESIST".
- SUPERTREND is the normal prepared indicator which is defined in "TRADING VIEW"
-T.O is my suggestion instead of "EMA" to check the phase of session.
I hope that you enjoy this Indicator, please do not forgot to "Warm-It-UP"!
Happy trading,
Shakib
Digital Nivesh: Trend TrackerThis indicator is nothing but combination of Magic Trend and Super trend written by KivancOzbilgic
So credit goes to him.
I have just added some extra functionality which are below:
1. Multi time frame, magic trends time frame can be different from supertrend by changing shortTimeFrame
2. Dynamic time frame, u can change supertrends time also
Best usage is to use Magic Trend on 1 lower time frame than supertrend.
eg. Suppose ur current chart is on 5 min time, ur supertrend will be displayed with current time on chart(which can be changed also using MTF Tradingview feature), u need to keep shorterTimeFrame on lower value such as 3min .
For any question , feel free to drop comment.

3c Ultimate reversal strategy With scanner and backtester v2This might just be the ultimate strategy to identify reversals.
This strategy includes a scanner, a backtester and ability to connect it with you 3 commas bot(See adviced settings below)
Strategy:
-Signals reversal that happened in the last bar. This signal DO NOT repaint.
-Identifies potential reversal that might happen in the current bar but can also not happen depending upon the timeframe closing price.
-The strategy combines the Moving Average Trend Changer, SuperTrend (ATR price detection) and ADX.
-It reduces the number of false signals in sideways market conditons and give more reliable trade signals.
-The signal does not repaint and can be used in any market condition. It determines the trend with high precision.
Take profit:
-Set 2 separate TP conditions.
-You can take profit using percentage, ATR, or RR(Risk Reward), aswell as using Trailing Take Profit.
- Use sell signal from the strategy(I often find way better results using that)
Stoploss:
-You can use either ATR, Percentage or sell signal from the strategy
(For now to let the strategy itself decide when to TP or SL, just set these parameters really high.)
Scanner:
-Identifies coins that are currently in the sell zone
-Identifies coins that are currently in the buy zone
-Screener explores up to 20 pairs in current graph's time frame.
-Optimize the strategy to your liking and use the built in backtester to see if it is a viable strategy.
3commas settings:
-For now you can only use simple bots.
-Create LONG and SHORT bots for the coins you like to trade and set up alerts(You can send long and short signal from the same alert)
-Set TP to 50% the strategy will handle buys and exits based on your inputs.
-Set safety orders to 0. I might add DCA to the strategy if testing proves that to be a good solution.
-When you have made the bots input the bot ID and token adress in the settings of the strategy.
-When creating the alert use this webhook :https://3commas.io/trade_signal/trading_view
-In the message field you use {{strategy.order.alert_message}} as the placeholder.
In the future this signal might make it to the 3commas marketplace. You can then subscribe to that signal where I have cherrypicked coins based on thorough backtesting and optimization.

Mtf Supertrend Table
english
It is a study of how the supertrend indicator looks on multiple timeframes. You can see the Supertrend direction in Multiple Timeframes by looking at the chart
Türkçe
supertrend indikatörünün çoklu zaman dilimdlerinde nasıl göründüğü yönünde bir çalışmadır. Tabloya bakarak Çoklu Zaman dilimlerinde Supertrend yönünü görebilirsiniz

Ultimate IndicatorThis is a combination of all the price chart indicators I frequently switch between. It contains my day time highlighter (for day trading), multi-timeframe long-term trend indicator for current commodity in the bottom right, customizable trend EMA which also has multi-timeframe drawing capabilities, VWAP, customizable indicators with separate settings from the trend indicator including: EMA, HL2 over time, Donchian Channels, Keltner Channels, Bollinger Bands, and Super Trend. The settings for these are right below the trend settings and can have their length and multiplier adjusted. All of those also have multi-timeframe capabilities separate from the trend multi-time settings.
The Day Trade Highlight option will draw faint yellow between 9:15-9:25, red between 9:25-9:45, yellow between 9:45-10:05. There will be one white background at 9:30am to show the opening of the market. while the market is open there will be a very faint blue background. For the end of the day there will be yellow between 15:45-15:50, red between 15:50-16:00, and yellow between 16:00-16:05. During the night hours, there is no coloring. The purpose of this highlight is to show the opening / closing times of the market and the hot times for large moves.
The indicators can also be colored in the following ways:
1. Simple = Makes all colors for the indicator Gray
2. Trend = Will use the Donchian Channels to get the short-trend direction and by default will color the short-term direction as Blue or Red. Unless using Super Trend, the Donchian Channel is used to find short-term trend direction.
3. Trend Adv = Will use the Donchian Channels to get the short-trend direction and by default will color the short-term direction as Blue or Red. Unless using Super Trend, the Donchian Channel is used to find short-term trend direction. If there is a short-term up-trend during a long-term down-trend, the Blue will become Navy. If short-term down-trend during long-term up-trend, the Red will be Brown.
4. Squeeze = Compares the Bollinger Bands width to the Keltner Channels width and will color based on relative squeeze of the market: Teal = no squeeze. Yellow = little squeeze. Red = decent squeeze. White = huge squeeze. if you do not understand this one, try drawing the Bollinger Bands while using the Squeeze color option and it should become more apparent how this works. I also recommend leaving the length and multiplier to the default 20 and 2 if using this setting and only changing the timeframe to get longer/shorter lengths as I've seen that changing the length or multiplier can more or less make it not work at all.
Along with the indicator settings are options to draw lines/labels/fills for the indicator. I enjoy having only fills for a cleaner look.
The Labels option will show Buy/Sell signals when the short-term trend flips to agree with the long-term trend.
The Trend Bars option will do the same as the Labels option but instead will color the bars white when a Buy/Sell option is given.
The Range Bars option shows will color a bar white when the Close of a candle is outside of a respective ranging indicator option (Bollinger or Keltner).
The Trend Bars will draw white candles no matter which indicator selection you make (even "Off"). However, Range Bars will only draw white when either Bollinger or Keltner are selected.
The Donchian Channels and Super Trend are trending indicators and should be used during trending markets. I like to use the MACD in conjunction with these indicators for possibly earlier entries.
The Bollinger Bands and Keltner Channel are ranging indicators and should be used during ranging markets. I like to use the RSI in conjunction with these indicators and will use 60/40 for overbought and oversold areas rather than 70/30. During a range, I wait for an overbought or oversold indication and will buy/sell when it crosses back into the middle area and close my position when it touches the opposite band.
I have a MACD/RSI combination indicator if you'd like that as well :D
As always, trade at your own risk. This is not some secret indicator that will 100% win. As always, the trades you see in the picture use a 1:1.5 or 1:2 risk to reward ratio, for today (August 8, 2022) it won 5/6 times with one trade still open at the end of the day. Manage your account correctly and you'll win in the long term. Hit me up with any questions or suggestions. Happy Trading!

DEMA Supertrend Bands [Misu]█ Indicator based on DEMA (Double Exponential Moving Average) & Supertrend to show Bands .
DEMA attempts to remove the inherent lag associated with Moving Averages by placing more weight on recent values.
Supertrend aims to detect price trends, it's also used to set protective stops.
█ Usages:
Combining Dema to calculate Supertrend results in nice lower and upper bands.
This can be used to identify potential supports and resistances and set protective stops.
█ Parameters:
Length DEMA: Double Ema lenght used to calculate DEMA. Dema is used by Supertrend indicator.
Length Atr: Atr lenght used to calculate Atr. Atr is used by Supertrend indicator.
Band Mult: Used to calculate Supertrend Bands width.
█ Other Applications:
The mid band can be used to filter bad signals in the manner of a more classical Moving Average.
SR Relative StrengthThis is a relative strength model for Indian Stock Markets where in the price of the stock in the current scenario is compared with the benchmark indices ( NIFTY / BANKNIFTY) over a period of 55 days ( by default).
This indicator also has RSI and Supertrend built-in by default. Hence this indicator can be used in place of 3 indicators.
How to use?
1. When the background is blue, it means that the stock is relatively strong as compared to the bench mark indices over a period of 55 days and the RSI is > 50
When both RS > 0 & RSI > 50 the background will be blue. If either or is true it won't turn blue.
2. Superternd by default setting is 10,3 which can be changed as per one's requirement.
Thanks!!

Adaptive Supertrend w/ Floating Levels [Loxx]Adaptive Supertrend w/ Floating Levels is a Supertrend indicator made adaptive by comparing the coefficient of determination / average of the least squares. The basic concept is this: use correlation with an r-squared line to adapt the period of the indicator, thereby resulting in a more versatile Supertrend. This adaptive formula makes the Supertrend more reactive to small fluctuation in the market while still doing what it's supposed to do: track trend. In addition, floating levels are drawn above or below the Supertrend which are calculated with percentage of the highest and lowest values of the Supertrend within the last “lookback” period. These floating levels act as filter to detect / prevent false trend reversals. T
What is the Supertrend?
Supertrend indicator was created by Olivier Seban to work on different time frames. It works for futures, forex, and equities. It is used in 15 minutes, hourly, weekly, and daily charts. Based on the parameters of multiplier and period, the indicator normally uses 3 for multiplier and 7 for the ATR period as default values. Average True Range is represented by the number of days while the multiplier is the value by which the range is multiplied.
Included
-Toggle on/off bar coloring
-Toggle on/off adaptivity
-Toggle on/off fill coloring
Buy/Sell SignalsThe indicator is built using Supertrend, RSI, and Ema Crossovers.
What is the best way to use the indicator?
Indicator can be used in two ways:
First : If a signal appears on the chart, you can enter immediately the stoploss is the candle's low with a Small Buffer.
Second: you will get good results if you plot additional indicators like as volume, RSI and so on for additional confirmation to get better results

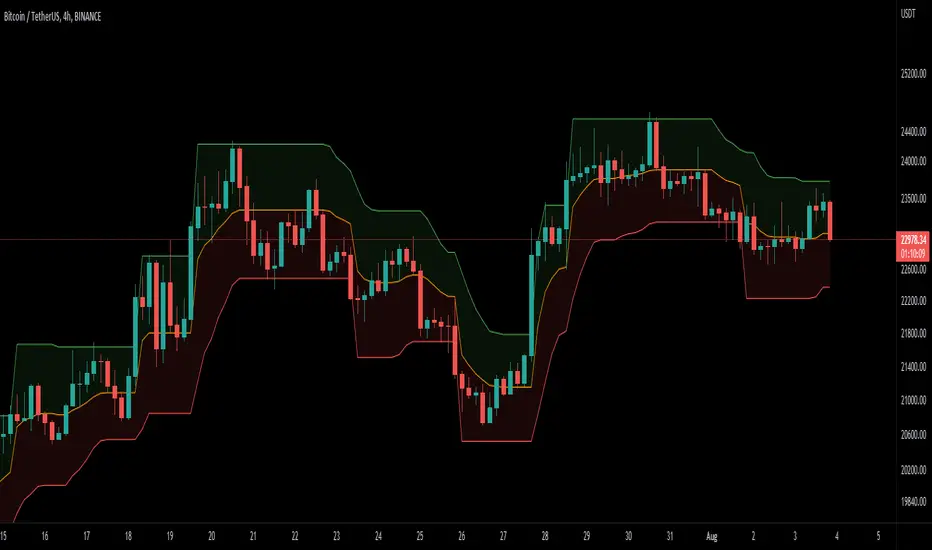
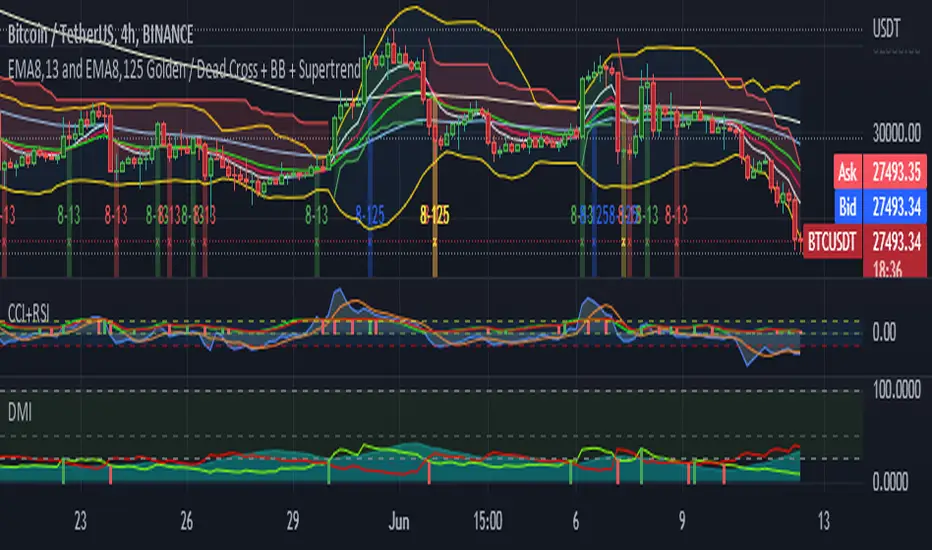
5EMA(8,13,21,55,125) w/ EMA8-13 + EMA8-125 GC/DC Signal-by TerryThis Script are Combined 5 EMAs Indicator with Golden / Death Cross EMA 8 -13 and EMA 8 - 125 within Green or Red Column Line as Default Signal. This Indicator also combined with Ballinger Band and Super Trend Channel.
If you have like this Indicator, please add to your favorite Indicator, and If You Don't, Don't be like a man without woman :) ... God Bless You All
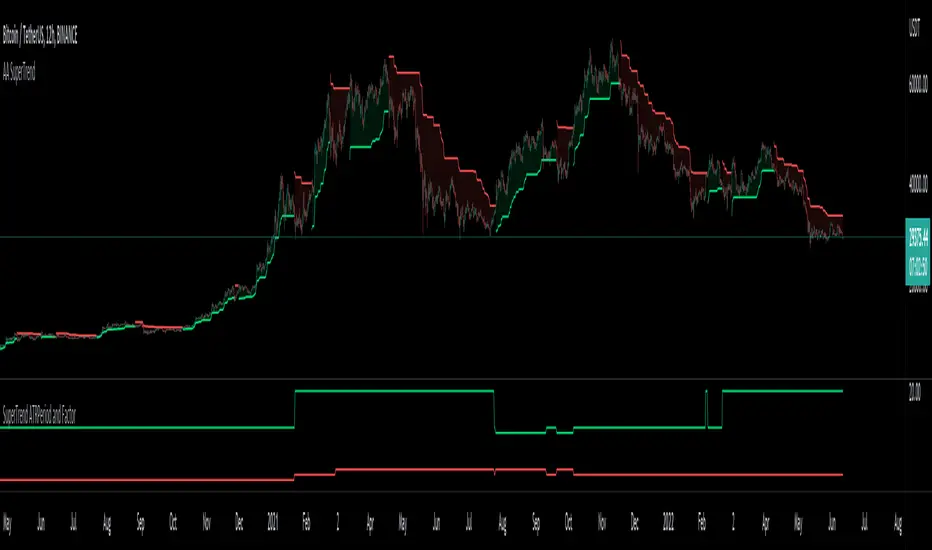
Auto Adjust SuperTrend Indicator SuperTrend
It is a standard ATR (Average True Range)-based Trailing Indicator. The indicator takes two default values ATR Period and Factor. The standard settings for Super Trend I have seen are 10,3 or 10,2. These settings will not work for all the instruments, and we end up manually changing these settings. This is where Auto-Adjust Supertrend adds value. Auto-Adjust SuperTrend finds the optimized settings for ATRPeriod and Multiple using a defined algorithm to check all the different ATR Periods and Factors. It backtests different combinations of ATR Period and Factors and Indicator switches to these profitable settings as soon as it detects most profitable setting among given range in the settings.
Default ATR Period : 10 to 20
Default Factor : 2 to 5
The above settings can be altered in the indicator settings. Please do keep in mind that the performance of the indicator reduces as we increase the default settings range.
Alerts are available as well
Pls contact me for access.
SuperTrend Trapping Candle StrategyHello traders!
How this indicator works?
The main functionality of this indicator is to find entry based upon SuperTrend indicator. This indicator helps us to find trapping candle to enter into the market.
What is a trapping candle?
A trapping candle is a candle that shows strength in opposite direction to SuperTrend. This helps us to enter in a trade before the move start in the current trend's direction. There are two types of trapping candles signals I have added currently:
1. Volume is high than previous candle in the opposite direction.
2. 3 candles of opposite direction with decreasing volume .
How to enter in a trade in uptrend market?
SuperTrend shows a green signal
A green triangle formed below red candle
Enter into the trade when price is above red candle high
SL could be place below red candle or swing low if it is near
How to enter in a trade in downtrend market?
SuperTrend shows a red signal
A red triangle formed above green candle
Enter into the trade when price is below green candle low
SL could be place above green candle high or swing high if it is near
How to avoid to enter in a trade in sideways market?
You can follow price action strategies
Or you can follow some indicator to find sideways market
Indicator settings and how to change?
ATR Length - For SuperTrend, this is default value.
Factor - For SuperTrend, changed to 2 to provide fast signals.
Candle Height - For trapping candle price, default set to 0.003% of the current price.

COSMO TREND👉 What is this indicator ?
This indicator is made up with the help of Multiple SuperTrend and Price Action , In this awesome indicator, The buy and sell entry is taken by comparing the trend using our secret logic.
👉 What is special about this indicator ?
More than Ten Takeprofit price points can be seen in this indicator , The Stoploss price point can be seen as well . You can simply adjust take profit percentage and stop loss percentage in indicator settings
👉 What kind of Take Profit signal is there on this indicator ?
Ten types of take profit signals are displayed on this indicator, each marked as TP1,TP2,TP3,TP4,TP5,TP6,TP7,TP8,TP9 and TP10 respectively. The take profit signals available for both buy and sell entries. The take profit of the buy entry is shown in Green Color and the take profit of the sell entry is shown in Red Color.
👉 What kind of Exit signal is there on this indicator ?
Exit signals can be seen at the end of the trend
👉 How many alarms does this indicator have ?
This indicator has 13 types of alarm for Buy , Sell , Take Profit and Exit signal, and it is best to set the alarm by selecting the Alert Once Bar Close option to avoid repaint.
👉 On which coins can this indicator be used ?
This indicator is best used on all cryptocurrencies, forex markets and stocks , This indicator is very helpful to get high returns on all cryptocurrencies with low price and high voltality
Note : This indicator only works well in all time frames ( 1s,5s,10s,1m,5m,1h etc...) , Use appropriate values when using other coins. If you have difficulty finding the value, you can contact us.
Default Setup Instructions 👇
Time Frame : 1 Minute
Default Coin : C98USDT
The following settings can be found in this indicator
You can simply adjust take profit percentage and stoploss percentage in indicator settings
Orgin Factor : This is the ATR Factor Value for High Time Frame trend. You can change this value according to the volatility , the ATR Factor value is also used to reduce the chance of a fake signal
Mid Factor : This is the ATR Factor Value for Low Time Frame trend. You can change this value according to the volatility , the ATR Factor value is also used to reduce the chance of a fake signal
Low Factor : This is the ATR Factor Value for Second Low Time Frame trend.
Take Profit - TP1 Percentage : Give What percentage for take First TP
Take Profit - TP2 Percentage : Give What percentage for take Second TP
Take Profit - TP3 Percentage : Give What percentage for take Third TP
Take Profit - TP4 Percentage : Give What percentage for take Fourth TP
Take Profit - TP4 Percentage : Give What percentage for take Fifth TP
Take Profit - TP4 Percentage : Give What percentage for take Sixth TP
Take Profit - TP4 Percentage : Give What percentage for take Seventh TP
Take Profit - TP4 Percentage : Give What percentage for take Eighth TP
Take Profit - TP4 Percentage : Give What percentage for take Nineth TP
Take Profit - TP4 Percentage : Give What percentage for take Tenth TP

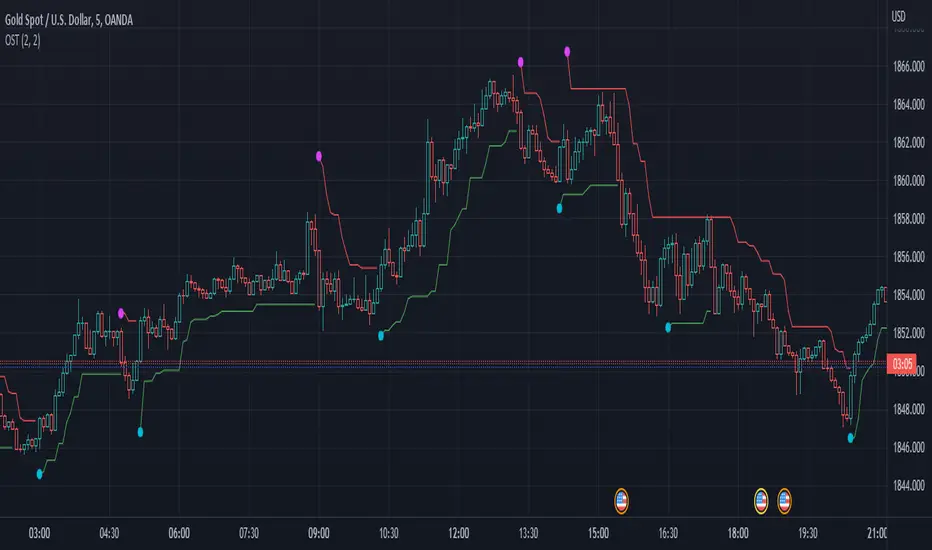
OST - Overlapped Super TrendThis Supertrend indicator uses different source for Uptrend and Downtrend lines.
Uptrend line uses high as its source.
Downtrend line uses low as its source.
Effect: It has faster Uptrend/Downtrend signals.
Alien Brain👉 What is this indicator ?
This indicator is made up with the help of Multi Trend , Moving Average and Price Action , In this beautiful indicator, The buy and sell entry is taken by comparing the trend in the higher time frame with the Trend in the short time frame using our secret logic.
👉 What kind of Buy and Sell signal is there on this indicator ?
Four types of buy and sell signals are displayed on this indicator, each marked as M.Buy(Master Buy) , M.Sell (Master Sell) , Buy1, Sell1, Buy2 , Sell2, Buy3 and Sell3 respectively. These four types of indications are obtained by comparing the trend in the higher time frame with the Trend in the short time frame.
👉 What kind of Take Profit signal is there on this indicator ?
Four types of take profit signals are displayed on this indicator, each marked as TP1,TP2,TP3 and TP4 respectively. The take profit signals available for both buy and sell entries. The take profit of the buy entry is shown in Green Color and the take profit of the sell entry is shown in Red Color.
Note : Take Profit Signals Only Available for Master Buy and Master Sell
👉 What kind of Exit signal is there on this indicator ?
Exit signals can be seen at the end of the trend
Note : Exit Signals Only Available for Master Buy and Master Sell
👉 How many alarms does this indicator have ?
This indicator has 18 types of alarm for Buy , Sell , Take Profit and Exit signal, and it is best to set the alarm by selecting the Alert Once Bar Close option to avoid repaint.
👉 On which coins can this indicator be used ?
This indicator is best used on all cryptocurrencies, forex markets and stocks , This indicator is very helpful to get high returns on all cryptocurrencies with low price and high voltality
Note : This indicator only works well in 1 min time frame , Use appropriate values when using other coins. If you have difficulty finding the value, you can contact us.
Default Setup Instructions 👇
Time Frame : 1 Minute
Default Coin : OGNUSDT
The following settings can be found in this indicator
TOP BRAIN - Factor : This is the ATR Factor Value for High Time Frame trend. You can change this value according to the volatility, the ATR Factor value is also used to reduce the chance of a fake signal
MID BRAIN - Factor : This is the ATR Factor Value for Low Time Frame trend. You can change this value according to the volatility, the ATR Factor value is also used to reduce the chance of a fake signal
MID BRAIN - Threshold : This is the difference between price and moving average. Changing the value of this option will change the accuracy of the trading signal
LOW BRAIN - Factor : This is the ATR Factor Value for Second Low Time Frame trend.
Take Profit - TP1 Percentage : Give What percentage for take First TP of Master Signal
Take Profit - TP2 Percentage : Give What percentage for take Second TP of Master Signal
Take Profit - TP3 Percentage : Give What percentage for take Third TP of Master Signal
Take Profit - TP4 Percentage : Give What percentage for take Fourth TP of Master Signal

Short Volume Weighted Trend Band VTrendThe Short Volume Weighted Trend band, combined with the custom supertrend and barcolor, which changes according to price going above or below the bollinger band basis line. Is designed for you to identify the high time frame trend, and take short to long term entries.
The short volume band in green, acts as dynamic support and resistance, and price respects this quite well. I find it great for taking entries off and placing stops below or above depending on the position being taken.
It really helps identify when price is actually changing trend. The barcolor change assists in acting as confluence for this.
Included is a custom supertrend, which is better at 1h timeframe an above. And daily open levels only, as i find the daily key to take trades off when i am scalping on an intraday basis.
The reversal calculations are based off candle close types, these are 'R' either in black or red. The difference in black and red is a type only, and means no significance between the two.
Timeframes I like using on this script, 2H, 1H, 30min, 25min, 15min

Divergence + EMAS' + VolumeHi,
This strategy takes in consideration multiple factors: includes RSI divergence, plus cross of EMAs and volume
STRATEGY:
you can change the EMAs input best use for daily charts
BUY: ALERT:
WHEN RSI divergence ABOVE 0 AND EMA 5 CROSS-OVER EMA 12
AND THE CANDLE NEED TO CLOSE ABOVE BOTH MOVING AVERAGE
And THE VOLUME BAR NEED TO BE HIGHER THAN THE PREVIOUS ONE
Then a buy signal will appear
SELL ALERT:
WHEN RSI divergence BELOW 0 AND MA 5 CROSS-UNDER EMA 12
AND THE CANDLE NEED TO CLOSE below BOTH MOVING AVERAGE
THE VOLUME BAR NEED TO BE HIGHER THAN THE PREVIOUS ONE
Then a sell signal will appear
Ema 200 FILTER. :::
When this box is activated, all trades under the EMA 200 will not appear on the chart,, when deactivated, trades will appear. On the chart.
that way u prevent wrong trades. obviously u will need to use support and resistance to find re entry point or the lowest point when under the 200 EMA.
No strategy is perfect but this one get close to it.
VOLUME: the volume box is turn off , only to display or not display in the chart, but is considered on the math within the strategy so by turning off you are only turning off the visual part
any questions feel free to ask, thanks!

Scalp 1min CryptoThis scalping strategy is designed for 1min timeframe.
It uses indicators: SuperTrend 15m ( is used to filter the trade as to open only long position or short position), Wavetrend 1min, Bollinger Band 3min, Stoch 3min to find entry.
TP: optimized value : 0.5 - 1
Stoploss: You have two choice: % or when SuperTrend reverse
If you would like use scripts, please ib to me.
You are welcom!

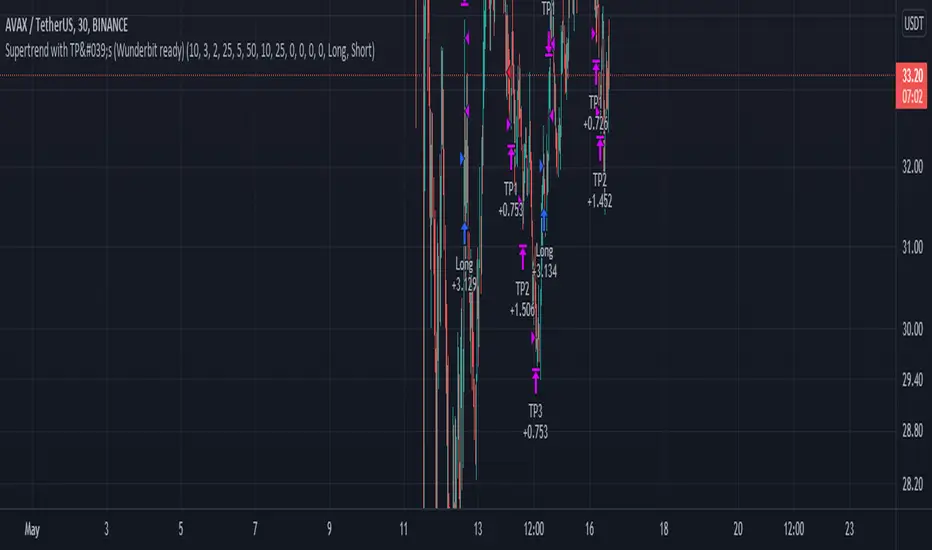
Supertrend with TP by Furkan SancuSimple Supertrend strategy with Take Profit levels.
Note: Make sure TP amounts add up to 100.
Opens a position with Supertrends strategy then adds Take Profit points with certain amounts of current position.
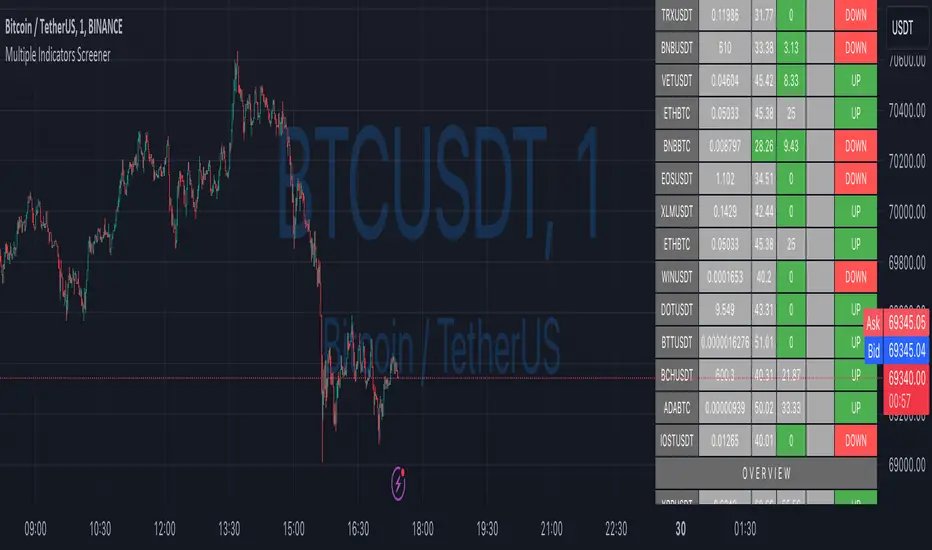
Ultimate Custom ScreenerThis indicator will allow you to make your custom TradingView screener without coding. Add it to the chart, select up to 40 symbols and five indicators, and the screener will do the rest for you. The indicator will form a lovely table with all values and highlighted signals.
The screener is highly customizable, and you can choose its position on the chart, sorting, order of the columns, colors for the tables, and all signals separately. You can easily change parameters for all supported indicators and their signals.
Currently, there are 19 different custom indicators available. Current list of indicators:
Average Directional Index (ADX) - displaying the value of ADX and checking if it's higher than the threshold
Average True Range (ATR) - showing the value of ATR
Awesome Oscillator (AO) - displaying the value of AO and highlighting positive/negative values.
Bollinger Bands (BB) - showing if the price is above/below/in the channel.
Breakout Pivots - Displaying when the price is below/above the most recent pivot low/high.
Commodity Channel Index (CCI) - shows the last CCI value and highlights overbought/oversold values.
Directional Movement Index (DMI) - Up/Down signal (+DI above or below -DI)
Donchian Channel (DC) - showing if the price is above/below/in the channel.
Historical Volatility (HV) - Current value of Historical Volatility
Keltner Channel (KC) - showing if the price is above/below/in the channel.
Moving Average Convergence Divergence (MACD) - Up/Down signal (MACD above / below signal)
Moving Average Crossover (MA Cross) - Displaying MA crosses signals (SMA, EMA, WMA, HMA, VWMA, SMMA, DEMA, VWAP supported)
Moving Average Distance (MA DIST) - Displaying distance to the MA (SMA, EMA, WMA, HMA, VWMA, SMMA, DEMA, VWAP supported)
Price - Displaying the last price for the instrument
Relative Strength Index (RSI) - Displaying the last RSI value and highlighting overbought/oversold values.
Stochastic (STOCH) - Displaying the last Stochastic value and highlighting overbought/oversold values.
Stochastic RSI (STOCH RSI) - Displaying the last Stochastic RSI value and highlighting overbought/oversold values.
SuperTrend - Current state of the SuperTrend.
True Strength Index (TSI) - Displaying the last TSI value and highlighting overbought/oversold values.
We're already working on adding a few more supported indicators. If you have any ideas about the indicators you want to see in our screener, contact us, and we'll consider them.
Disclaimer
Please remember that past performance may not be indicative of future results.
Due to various factors, including changing market conditions, the strategy may no longer perform as well as in historical backtesting.
This post and the script don’t provide any financial advice.
Solution Zigma - Fibonacci Impulse'Solution Zigma' is strategy for any securities because this strategy use EMA of Fibonacci Level and Plot Like candle easy for analysis trend impulse. This strategy used DMI(ADX) for filter sideway but not greatest indicator, Please use this strategy with Risk Management.