Signal Algo - Elephant EdgeDescription
Signal Algo - Advance Elephant Edge is a rule-based, intraday detection system that combines candle-pattern logic with session-driven support and resistance zones. creating a clean confluence-based signal that removes noise.
This tool is designed for traders who prefer structured rules over subjective drawing, and want clear, event-driven alerts without unrealistic promises or over-optimized behavior.
What This Script Does (Short & Simple)
1. Hammer-Type Candle Detection
The script looks for long-wick hammer or inverted hammer candles using your wick-ratio setting. It also checks candle size, body size, and doji conditions so that only clean and meaningful rejection candles are highlighted.
2. Session-Based Percentile Support & Resistance
The indicator calculates percentile levels from previous sessions and plots up to four upper and lower S/R lines around the daily open. These levels act as dynamic zones where price often reacts.
3. Optional Strike-Price Zones
For symbols that move around round numbers or strike intervals, the script can draw strike-based S/R lines (like 50 or 100 points) You can choose solid or dotted lines and select how many zones to show.
4.Higher-Timeframe Trend Background
A light green or red background shows the overall trend direction. Green = bullish bias, Red = bearish bias.
🔶 USAGE & EXAMPLES Elephant Support & Resistance
Elephant Support & Resistance creates intraday support and resistance levels using percentile data from previous sessions. Instead of drawing lines manually, calculates how far price usually moves above and below previous sessions. and then plots those levels automatically.
Each percentile pair (Level 1–4) gives one upper line and one lower line. These lines represent price zones where the market has reacted many times in the past. When price reaches these levels, it often pauses, reverses, or shows rejection candles.
🔶USAGE & EXAMPLES Strike Price Support & Resistance
Strike Price Zones are plotted because most markets naturally react around fixed strike levels. Every index, stock, or international market has its own commonly traded strike prices. These levels attract large traders and institutions, who often build positions around them.
When price moves toward one of these strike levels, big players frequently defend or reject that zone. As a result, price may pause, reverse, or show strong reactions at or near these strikes.
Because of this behavior, Strike Price Zones work as practical intraday support and resistance levels. They help traders see where important reactions can occur, where momentum may slow down, and where potential reversals may form.
These zones are not buy/sell signals by themselves, but they provide a simple, objective roadmap of key levels that the market respects during the session.
🔷 FEATURES
1. Hammer-Based Rejection Signals
2. Candle Size Filtering
3. Elephant Percentile Support & Resistance
4. Strike Price Support & Resistance Zones
5. Combined Confluence Logic
6. Higher-Timeframe Trend Background
7. Clean Visual Layout
8. Yellow Highlight Candle
9. Intraday Session Handling
10. Built-In Alerts
11. Fully Customizable Inputs
12. Lightweight & Rule-Driven Design
🔴 RISK DISCLAIMER
Trading is risky & most day traders lose money. All content, tools, scripts, articles, & education provided by Signal Algo are purely for informational & educational purposes only. Past performance does not guarantee future results.
Strikeprice

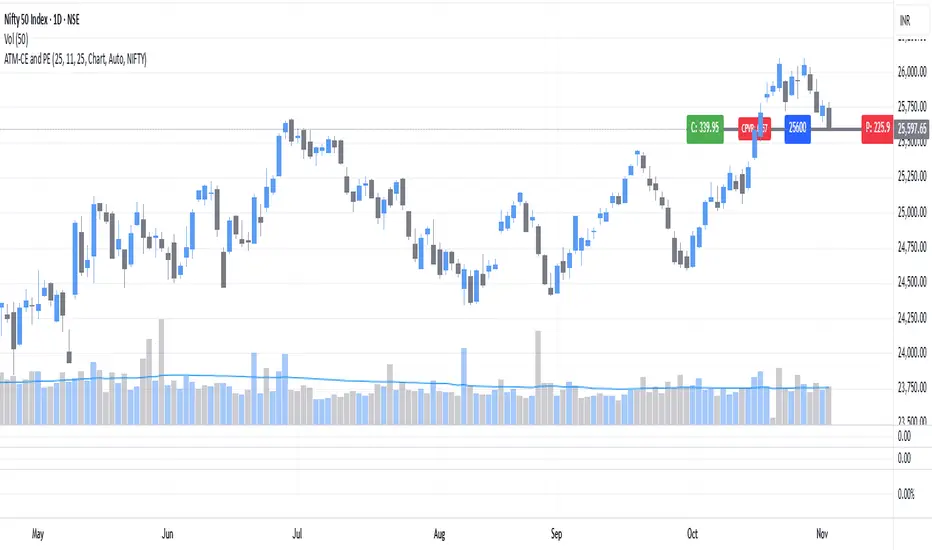
ATM Strike Line with Call & Put Premiums (ARJO)This indicator is designed specifically for the Indian market (NSE) and helps traders visualize the At-The-Money (ATM) strike line along with real-time Call (CE) and Put (PE) option premiums.
Key Features
Automatic ATM Detection: The script automatically identifies the ATM strike based on the underlying price, with an option for manual input.
Dynamic Expiry Control: Select expiry date easily (Year, Month, Day) in YYMMDD format.
Flexible Timeframe Support: Choose between the chart’s current timeframe or custom intervals.
Smart Symbol & Strike Interval: Automatically adapts to the selected underlying symbol (e.g., NIFTY, BANKNIFTY, RELIANCE, etc.) or allows manual setup.
Visual Representation:
ATM line plotted clearly on the chart.
CE and PE premium labels are displayed on each side of the ATM line.
ATM strike price label shown at the center.
Call–Put Volume Ratio (CPVR): Displays the live CPVR value to quickly assess market sentiment.
CPVR Interpretation
Bullish Bias: CPVR ≥ 1.25
Bearish Bias: CPVR ≤ 0.75
Neutral Zone: Between 0.75 and 1.25
⚙️ Customization
Adjustable colors for ATM line, CE/PE labels, and CPVR.
Option to manually select strike, symbol, and interval for maximum flexibility.
This tool may help to track option sentiment directly on the price chart, making it ideal for option traders and intraday analysts focusing on NIFTY, BANKNIFTY, and other NSE stocks.
Happy Trading. ARJO
Auto Support & Resistance From Option Strike Price + PercentagesAUTO SUPPORT AND RESISTANCE FROM OPTIONS STRIKE PRICES WITH PERCENTAGE GAPS
This is an auto support and resistance level indicator that uses options strike prices or psychological numbers as the relevant levels. Set your starting level or strike price and input the options strike price gaps for that ticker and 15 lines in either direction will automatically populate on the chart. It also has a table in the bottom right corner that tells you how far the current price is from the next closest support and resistance levels.
Everything is easily customizable in the indicator input settings including turning the lines on/off, turning the percentage gaps table on/off, setting the options strike price gaps, setting the starting level, setting the position of the percentage gaps table, changing support and resistance line colors all at once and updating the linewidth of all of the support and resistance lines at once.
***HOW TO USE***
First, go into the indicator settings and set the starting level to use. If you are trading SPY and it is near 450, then set your starting level at 450. If you are trading SQQQ and it is near 38, set your starting level to 38. If you are trading crypto, set your levels to the nearest psychological or round number such as 40,000 for BTC or 2,500 for ETH or 16.50 for LINK.
Second, set your options strike price gaps. If you are trading SPY, this will be 2.5. If you are trading SQQQ this number would be 1. If you are trading crypto, try using psychological price levels instead of strike prices, such as 500, 1000 or 5000 for BTC and 100, 250 or 500 for ETH. For small priced cryptos, use decimals such as .25, .50, etc.
Once these inputs are filled in, 15 levels in each direction will automatically populate on the chart for you.
If price is above a level, it will paint green. If price is below a level it will paint red. These colors represent support and resistance visually for you on the chart and will change dynamically as price moves above or below these levels. These colors can be customized in the indicator input settings to change all lines by only updating one color.
There is a table of percentage gap updates that will tell you in real time how far away the price is from the nearest support and resistance lines so you always know your risk to reward ratios. Each label will also be colored the same as the corresponding support or resistance line as a visual aid.
***MARKETS***
This indicator can be used as a signal on all markets, including stocks, crypto, futures and forex.
***TIMEFRAMES***
This support and resistance indicator can be used on all timeframes.
***TIPS***
Try using numerous indicators of ours on your chart so you can instantly see the bullish or bearish trend of multiple indicators in real time without having to analyze the data. Some of our favorites are our Auto Fibonacci, Directional Movement Index, Volume Profile, Momentum and Money Flow Index in combination with this auto support and resistance indicator. They all have real time Bullish and Bearish labels as well so you can immediately understand each indicator's trend.

Bank Nifty strike price 2/3σ Calculates the strike prices for the Bank Nifty index in steps of 50 and marks the 2 and 3 sigma price levels.

portfolio_strikesA simple script for keeping track of your options portfolio. Basically, you can write one line of code per strategy (single, vertical, or strangle) to keep a line drawn on the underlying's chart, at the strike price, from the current bar until expiration. See the comments at the top of the code for more explanation.
