Session Streaks [LuxAlgo]The Session Streaks tool allows traders to identify whether a session is bullish or bearish on the chart. It also shows the current session streak, or the number of consecutive bullish or bearish sessions.
The tool features a dashboard with information about the session streaks of the underlying product on the chart.
🔶 USAGE
Analyzing session streaks is commonly used for market timing by studying the number of consecutive sessions over time and how long they last before the market changes direction.
We identify a bullish session as one in which the closing price is equal to or greater than the opening price, and a bearish session as one in which the closing price is below the opening price.
Each session is labeled according to its bias (bullish or bearish) and the number of consecutive sessions of the same type that conform the current streak.
🔹 Dashboard
The dashboard at the top shows information about the current session.
Under the "Streaks" header, historical information about session streaks is displayed, divided into bullish and bearish categories.
Number: Total number of streaks.
Median: The average duration of those streaks. We chose the median over the mean to avoid misrepresentation due to outliers.
Mode: The most common streak duration.
As the image shows, for this particular market, there are more bullish streaks than bearish ones. Bullish streaks have an average duration that is longer than that of bearish streaks, and both have the same most common streak duration.
If the current session is bullish and the median streak duration for bullish sessions is three, then we could consider scenarios in which the next two sessions are bullish.
🔶 DETAILS
🔹 Streaks On Larger Timeframes
On timeframes lower than or equal to Daily, the tool identifies each consecutive session, but this behavior changes on larger timeframes.
On timeframes larger than daily, the tool identifies the last session of each bar. Let's use the chart in the image as a reference.
At the top of the image, there is a daily chart where each session corresponds to each candle. One candle equals one day.
In the middle, we have a weekly chart where each session is the last session of each week, which is usually Friday for the Nasdaq 100 futures contract. The levels and labels displayed correspond to the last session within each candle, which is the last day of each week.
The levels and labels on the monthly chart correspond to the last session of each month, which is the last day of each month.
🔹 Gradient Style
Traders can choose between two different color gradients for the session background. Each gradient provides different information about price behavior within each session.
Horizontal: Green indicates prices at the top of the session range and red indicates prices at the bottom.
Vertical: Green indicates prices that are equal to or greater than the open price and red indicates prices that are below the open price of the session.
🔶 SETTINGS
🔹 Dashboard
Dashboard: Enable or disable the dashboard.
Position: Select the location of the dashboard.
Size: Select the dashboard size.
🔹 Style
Bullish: Select a color for bullish sessions.
Bearish: Select a color for bearish sessions.
Transparency: Select a transparency level from 100 to 0.
Gradient: Select a horizontal or vertical gradient.
Streak

Win-Loss Streak PlotterWin-Loss Streak Plotter
This indicator tracks the win/loss streaks of moving average crossovers (using simple moving averages for illustration purposes). It calculates the price change after each crossover, marking each as a win (green) or loss (red). The win rate is shown separately.
Inputs:
Source: Price series (default: open)
Fast MA: Fast moving average (default: open)
Slow MA: Slow moving average (default: open)
Total Crosses to Analyze: Number of crossovers to track
Crosses per Row: Number of crossovers per row in the table
Output:
A table displays each crossover’s result (win/loss).
A separate win rate table shows the percentage of wins.
Suggestions are always welcomed!

MA Streak Change ChannelChange Channel is like KC unless it uses percentage changes in price to set channel distance. Midline is zero-lag smoothed ROC with dynamic period based on MA Streak indicator, if MA Streak shows an ongoing trend, midline going strong and break out the channel.
Consider using ▲ green areas as a signal to buy and ▼ red areas as a sell signal. It works best in a flat market. Use in combination with other indicators.

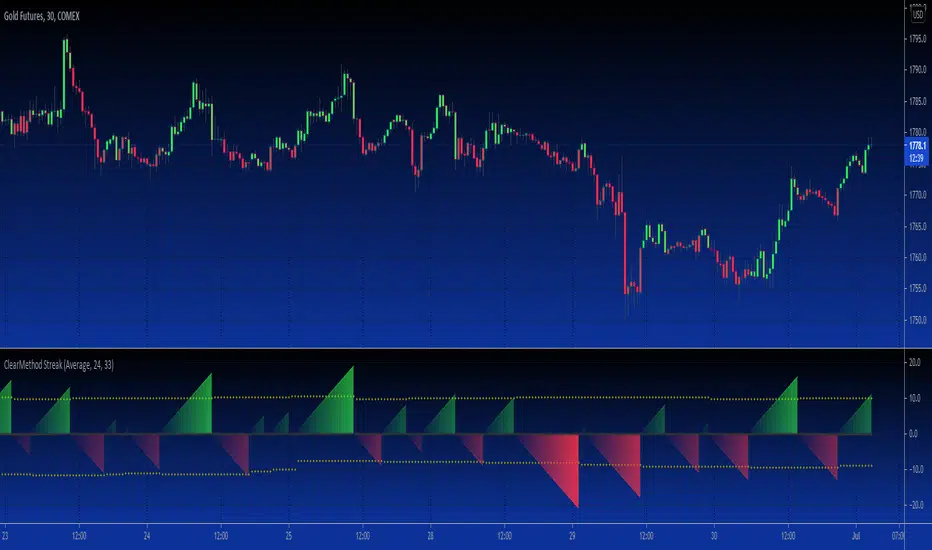
B3 Clear Method Streak CountAbout Clear Method -- to repeat my prior post on the bar painter script:
This indicator is translated out of Technical Analysis of Stocks & Commodities , September 2010, (I take zero design credit). The script simply looks for the price action to break or "clear" the most recent action, and only changes the paintbar color if the action indeed clears the previous candles. Simple to use, just add to your chart from your favorites and change the colors in the UI. It does the rest.
This version can replace my previous Clear Method Bar Painter as it also paints the bars.
What is different is this share is a lower study that counts the streak of the bars shown via histogram.
The way to use the streak is to notice the previous streaks and get a sense of how long the current trend is lasting versus prior trends of the same direction.
@Tradestation recently posted their "price streak" study, and this one is quite similar in nature.
Enjoy, the code open to view,
_B3
d^.^b