Simple EMA Long Only StrategySimple EMA long only strategy, using ATR on crossings to minimize fake signals.Estratégia Pine Script®por coingrabberAtualizado 1515 1.1 K
Scripting Tutorial 9 - TManyMA Strategy - Long Market Order OnlyThis script is for a triple moving average strategy where the user can select from different types of moving averages, price sources, lookback periods and resolutions. Features: - 3 Moving Averages with variable MA types, periods, price sources, resolutions and the ability to disable each individually - Crossovers are plotted on the chart with detailed information regarding the crossover (Ex: 50 SMA crossed over 200 SMA ) - Forecasting available for all three MAs. MA values are forecasted 5 values out and plotted as if a continuation to the MA. - Forecast bias also applies to all forecasting. Bias means we can forecast based on an anticipated bullish, bearish or neutral direction in the market. - To understand bias, please read the source code, or if you can't read the code just send me a message on here or Twitter. Twitter should be linked to my profile. - Ribbons added and on by default. Optional setting to disable the ribbons. 5 ribbons between MA1 and MA2 and another 5 between MA2 and MA3. - Ribbons are alpha-color coded based on their relation to their default MAs. - Ribbons are only visible between MAs if the MAs being compared share the same Type, Resolution, and Source because there is no way to consolidate those three in a simple manner. - Ribbon values are calculated based on calculated MA Periods between the MAs. - Converted the existing study into a strategy - Strategy only enters long positions with a market order when MA crossovers occur - Strategy exits positions when crossunders occur - Trades 100% of the equity with one order/position by default - Ability to disable trading certain crosses with input checks This script is meant as an educational script with well-formatted styling, and references for specific functions. *** PLEASE NOTE - THIS STRATEGY IS MEANT FOR LEARNING PURPOSES. DEPENDING ON IT'S CONFIGURATION IT MAY OR MAY NOT BE USEFUL FOR ACTUAL TRADING. THE STRATEGY IS NOT FINANCIAL ADVICE ***Estratégia Pine Script®por BigBitsIOAtualizado 250
Histogram Trends Strategy by SedkurThis gives to you buy-sell signal with MACD's histogram trends. Use "Fast and Slow length" and "Trend of Histogram Number" inputs to take less or more signal. "Trend of Histogram Number" : This means how many histogram bars the trend continues before trading. Estratégia Pine Script®por sedatkurbanAtualizado 44392
1337 Simple Strategy - FREE - simple BTCUSD H1-H6 trendfollowing strategy - best on H2-H4 - longterm strategy (no scalping) - best with 1-3 pyramiding (but also without good) TF = HTF Input src = OHLC4 or hl2 for best results Noisfilter = avoid too many SignalsEstratégia Pine Script®por Crypto-OliAtualizado 55
MACD Strategy by SedkurThis gives to you buy-sell signal with MACD histogram value. Use "Fast and Slow length" and "Buy or Sell Histogram Value" inputs to take less or more signal. Estratégia Pine Script®por sedatkurban22135
DH: (Strategy) Super SmartSuper Trend: Backtest VersionSUPER SMART SUPERTREND (Strategy Version w/ Backtesting) Across all time frames and assets I've tested, this indicator gives me better results... Better entries, better exits and well defined trends. In comparison with a STANDARD Supertrend, it is not radically different, but when it does differ "Super Smart SuperTrend" is almost always better. This is the STRATEGY version of "Super Smart SuperTrend" ready for your backtesting. There is also a STUDY version with ALERTS which might be better for live trading if you want Alerts. STUDY VERSION WITH ALERTS IS HERE ################################## ################################## ABOUT THIS INDICATOR As the name suggests, 'Supertrend' is a trend-following indicator that is notably popular here on Tradingview and elsewhere. It does a remarkably great job of recognizing a trend (in progress) and it will signal you to initiate a position when the trend is clear. Perhaps the greater value of Supertrend is that it helps keep you in your position until that trend is over. WHAT'S THE BEST ATR PERIOD AND MULTIPLIER? There are two important data points we must enter for Supertrend to work, namely the 'period (ATR number of candles or days)' and the 'multiplier (value by which ATR is multiplied)' BTW, in case you don't know, ATR signals the degree of price volatility. A common default setting is 10 for the ATR period and 3 for the multiplier. SORRY, BUT THE MOVIE STARTED HALF HOUR AGO... Unfortunately Supertrend has a couple of big weaknesses. Generally, it fails in a sideways-moving market and when it does detect a trend, the signal to get in (or out) comes rather late. It's like someone telling you about a great movie they're watching, but by the time you start watching, one-third of the movie is over... bummer, right? HOW TO IMPROVE SUPERTREND One solution is to combine Supertrend with other indicators such as MACD, Parabolic SAR, RSI, etc. And another solution is to experiment (backtest) with the Period and Multiplier settings for the asset and timeframe you are considering for trade. For the STANDARD SETTINGS in this "Super Smart SuperTrend" indicator, I have set 9 for the ATR and 2.2 for the multiplier as default after backtesting on Bitcoin and other crypto (mostly in the 15 minute to 6 HOUR timeframe). Of course you can change this easily to any ATR period and Multiplier you like. BUT... WHY NOT GET SMART? I started thinking, it might be best if we let the market determine candle-by-candle what the settings should be. If everyone says that Supertrend works best in conjunction with other indicators, why not do our "conjuncting" programmatically (ie: automatically) sorta like artificial intelligence! HOW IT WORKS So here's what I did. Using data from other indicators I came up with a SMART SUPERTREND that auto-adjusts as the market changes. It still has settings so you can fine tune it for specific assets and timeframes, but once the settings are entered, it auto-adjusts as the market and prices evolve. With "Super Smart SuperTrend" there is no ATR period setting (that is determined programmatically) and now there are TWO multipliers you can experiment with... (a lower one set at 1.7 default and a higher one at 2.5). These multiplier settings create a multiplier range that can be used programmatically to adjust the multiplier as the market and prices evolve. THE RESULTS Across all time frames and assets I've tested, I generally get better results. Better entries, better exits and well defined trends. In comparison with a STANDARD Supertrend, it is not radically different, but when it does differ "Super Smart SuperTrend: is almost always better. All this is substantiated by backtesting of course. SAMPLE BACKTEST RESULTS (BTC/USD) *Using Indicator Defaults* TIMEFRAME STANDARD RESULTS SUPER SMART RESULTS % Profitable | Profit Factor % Profitable | Profit Factor DAY 58.33% 9.38 75.00% 10.77 4 HOUR 78.43% 18.22 80.95% 21.78 1 HOUR 74.11% 8.98 70.13% 9.34 15 MIN 58.10% 6.10 71.43% 9.48 Keep in mind that "Profit Factor" is key. It basically tells you what you'd make for every ONE DOLLAR invested by consistently trading with the backtested parameters. SUPER SMART SUPERTREND FEATURES • There is a STUDY VERSION w/Alerts • There is a STRATEGY VERSION for Backtesting • Standard 'Current Time Frame' SuperTrend Line • Standard 'Higher Time Frame' SuperTrend Line • Auto-Adjusting Dynamic Optimized SuperTrend Line > Most Signals Are Same or Better than Standard > Refine Results w/Sensitivity Inputs (2 Multipliers) > Impressive Comparison Backtests • Both Standard and Smart Signals and Alerts • Toggle Any Line/Signal (On/Off) • Toggle Backtest > Standard vs. "Smart Auto-Adjust" > Backtest Higher Timeframe Only WHAT MORE COULD YOU ASK FOR? So glad you asked. Actually, there is more... Super Smart SuperTrend is incorporated into my premier indicator set called: STONEHENGE PLUS: SUPERTREND TRADING TOOLKIT. By combining Super Smart SuperTrend with dozens of other indicators plus the predictive "Stones" of Stonehenge, you'll be in Trader's Heaven. That's it. Get "SMART" Today! STONEHENGE PLUS: The Complete SuperTrend Trading Toolkit ################################# ################################# SUPER SMART SUPERTREND ALSO WORKS WITH: STONEHENGE BASIC: Double Stone Version (Study w/Alerts): PLEASE HIT THE LIKE BUTTON (and follow me... lots of great stuff in the works!) As always, I appreciate your support. Please share with others. ENJOY! Dan Hollings Master Crypto Grid Trader Stonehenge Master Mason Host of the "High Leverage Lounge" Please Explore My Other Indicators, Scripts, Grids and Educational Ideas. @DanHollings on Tradingview. Additional Links Below... Estratégia Pine Script®por DanHollingsAtualizado 2727627
EURUSD 5 Minute Binary Strategy by Emiliano Mesa 73% Win RatioEURUSD Binary Strategy 73% Win Ratio. -----Free 5 Day Trial----- ¿How it works? This is a binary indicator, meaning it may be only used for EURUSD options. Its use is simple: 1) Wait for the blue background to appear, this means a possible trade may be upcoming 2) Wait for the purple background to appear, this is our entry. And enter in the suggested direction by the arrows after the close of the bar 3) Establish your expiration bar the # of bars missing in the white area (which are 3 bars per area) + 1 bar of the yellow area for instance: - Each background color both blue and yellow, have the same ammount of bars in between (3), and so does the white space between them, each bar is 5 minutes. In this case we are given an entry 1 bar later, so 5 miutes inside our whitespace. Saying so there are 2 bars left inside our white area, plus one yellow bar, which means our expiration time is 15 minutes since Entry to exit! Wohooo! PROFIT! Go ahead and send me a PRIVATE MESSAGE or EMAIL if you are intrested in trying my Binary Strategy FREE for 5 DAYS! ¿WANT ALERTS? If you purchase the EURUSD Binary Strategy Ill add up the EURUSD Binary Indicator! For you not to miss a trade! ----------------------- Contact: emilianomesauribe2000@live.com Estratégia Pine Script®por EmilianoMesa9955
REAL STRATEGY : Dow_Factor_MFI/RSI_DVOG_StrategyI'm actually one of those who think it's more important to extract clues from indicators than strategy, but I wanted to test the data about the probability and dow factor I've shared for a long time. Usually, Bitcoin is used as an eye stain for strategy success, since the graph has increased significantly from the beginning. To prevent this, I used a commission and in the last lines of document I shared Bitmex's Bitcoin and Ethereum 1W test results. I don't think there's a factor to repaint. ( Warn me if u see or observe ) I considered Bitcoin because I found working with liquid parities much more realistic. Ethereum and Bitmex have been featured as a spot and may soon find a place at the CME , so I've evaluated the Ethereum . But since the Ethereum Bitmex was also spot new, I deleted results that were less than 10 closed trades. Since the Dow Theory also looks at the harmony in the indices, just try it in the Cryptocurrency market. Use as indicator in other markets. Support with channels, trend lines with big periods and other supportive indicators. And my personal suggestion : Use this script and indicator TF : 4H and above. Specifications : Commission. ( % 0.125 ) Switchable Methods ( Relative Strength Index / Money Flow Index ) Alarms. (Buy / Sell ) Position closure when horizontal market rates weighs. Progressive gradual buy/sell alarms. Clean code layout that will not cause repaint. (Caution : source = close ) Switchable barcolor option (I / 0 ) *****Test results :***** drive.google.com Summary: It was a realistic test. It has achieved great success in some markets, but as I mentioned earlier, use it only to gain insight into the price movements of cryptos. Use as indicator in other markets. This code is open source under the MIT license. If you have any improvements or corrections to suggest, please send me a pull request via the github repository : github.com Stay tuned ! Noldo.Estratégia Pine Script®por NoldoAtualizado 44830
Ultimate Pullback StrategyWhat is the Ultimate Pullback Strategy? This strategy script is based on my Ultimate Pullback Indicator which detects pullback trading opportunities by analyzing price action in a very specific manner. By combining simple trend filters with various advanced candlestick patterns it detects high-probability trend-continuation setups (and optional exits). If you use this script to set alerts then you will never miss a pullback trading opportunity ever again! I personally use this indicator to profitably trade pullback signals in the forex markets on multiple timeframes, from the 15-Minute chart to the 4-Hour and Daily chart. Note: This strategy companion script is only available for subscribers of The Ultimate Pullback Indicator.Estratégia Pine Script®por ZenAndTheArtOfTradingAtualizado 7070 1.9 K
BITCOINDICATOR StrategyStrategy for BITCOINDICATOR for your own backtesting purposes. The trade locations mirror the price label values generated by BITCOINDICATOR (You can check by clicking on Strategy Tester > List of Trades). Just like BITCOINDICATOR, this strategy works with all time frames, although higher time frames will result in better average profit per trade. Inputs: - Click the gear icon to adjust the backtesting date range inputs. Properties (gear icon then click properties tab): - The default initial capital is 0, and the default order size is 1 Contract (1 BTC ) per trade (this gives more weight to the most recent data). * We recommend keeping the order size in contracts because if you use fiat, the time periods of lower-priced Bitcoin will have a greater impact on the strategy (since those trades would transact more BTC ). - Pyramiding is the number of trades allowed to be taken in the same direction. The default value is set to 5, although it is rare to see more than 2 trades in the same direction. * Additional trades in the same direction can be useful for adding on to your position or just for trend confirmation. If you prefer to see every SHORT followed by a LONG and vice-versa, you can change pyramiding to 1. Side Notes: - BITCOINDICATOR strategy can also be used for any Altcoin/Stable coin pair (such as ETH/USD). However, you will want to increase the order size from 1 Contract, to suit your Altcoin (For example, at the time of writing: 1 BTC = 47 ETH, so I would trade ETH/USD with an order size of 47 contracts). Of course, you can adjust the order size to the amount that you are actually trading. - You will notice that the lower the selected time frame, the date range for backtesting becomes more limited. This is because there is a historical bar data limit of 5,000 - 10,000 bars depending on the tier of your TradingView account. *Bitcoindicator Strategy is part of the Bitcoindicator package. For detailed information on Bitcoindicator and how to add it to your charts, please visit: www.bitcoindicator.com Strategy tested on BTC/USD(Day) from 1/1/2017 - 10/1/2019 :Estratégia Pine Script®por IndicatorKingAtualizado 8
ZomyzoX Scalp 1 MinuteEnglish XBTBTC, BTCUSD , BTCUSDT is a strategy made to parity for 1 minute. Scalp is a very successful strategy for trading. It is free to use. Optionally, other strategies can be written. Contact Twitter: @zomyzox Mail: oguzhan.yilmaz@hotmail.com.tr Türkçe XBTBTC, BTCUSD , BTCUSDT paritesi için 1 DK'da scalp trade için yazılmıştır. Scalp trade için başarılı buluyorum. Kullanımı ücretsizdir. İsteğe göre başka stratejilerde yazabilirim. İletişim Twitter: @zomyzox Mail: oguzhan.yilmaz@hotmail.com.tr Estratégia Pine Script®por UnknownUnicorn561762655121
Cyber Momentum StrategyStrategy base on the PRISM Oscillators Set as it foundation, with stop-loss algorithm integrated. ~ * ~ * ~ * ~ * ~ * ~ * ~ * ~ * ~ * ~ * ~ * ~ * ~ * ~ * ~ * ~ * ~ * ~ * ~ * ~ * ~ Note: In no way is this intended as a financial/investment/trading advice. You are responsible for your own investment decisions and trades. Please exercise your own judgement for your own trades base on your own risk-aversion level and goals as an investor or a trader. The use of OTHER indicators and analysis in conjunction (tailored to your own style of investing/trading) will help improve confidence of your analysis, for you to determine your own trade decisions. ~ * ~ * ~ * ~ * ~ * ~ * ~ * ~ * ~ * ~ * ~ * ~ * ~ * ~ * ~ * ~ * ~ * ~ * ~ * ~ * ~ Please check out my other indicators sets and series, e.g. LIVIDITIUM (dynamic levels), AEONDRIFT (multi-levels standard deviation bands), FUSIONGAPS (MA based oscillators), MAJESTIC (Momentum/Acceleration/Jerk Oscillators), PRISM (pSAR based oscillator, with RSI/StochRSI as well as Momentum/Acceleration/Jerk indicators), PDF (parabolic SAR /w HighLow Trends Indicator/Bar-color-marking + Dynamic Fib Retrace and Extension Level) and more to come. Constructive feedback and suggestions are welcome. To continue to keep this strategy free to use, especially if it has benefited your trades, please consider tipping a little of any gains you've made to my HRT fund. =D cybernetwork @ EOS 37DzRVwodp5UZBYjCKvVoZ5bDdDqhr7798 @ BTC MPr8Zhmpsx2uh3F5R4WD98MRJJpwuLBhA3 @ LTC 1Je6c1vvSCW7V2vA6RYDt6CEvqGYgT44F4 @ BCH AS259bXGthuj4VZ1QPzD39W3ut4fQV5giC @ NEO rDonew8fRDkZFv7dZYe5w3L1vJSE51zFAx @ Ripple XRP 0xc0161d27201914FC0bAe5e350a193c8658fc4742 @ ETH GAX6UDAJ52OGZW4FVVG3WLGIOJLGG2C7CTO5ZDUK2P6M6QMYBJMSJTDL @ Stellar XLM xrb_16s8cj8eoangfa96shsnkir3wctdzy76ajui4zexek6xmqssweu85rdjxrt4 @ Nano ~ JuniAiko (=^~^=)v~Estratégia Pine Script®por cybernetworkAtualizado 40
Cyber Ensemble StrategyStrategy base on CYBER ENSEMBLE , with stop-loss algorithm integrated. ~ * ~ * ~ * ~ * ~ * ~ * ~ * ~ * ~ * ~ * ~ * ~ * ~ * ~ * ~ * ~ * ~ * ~ * ~ * ~ * ~ Note: In no way is this intended as a financial/investment/trading advice. You are responsible for your own investment decisions and trades. Please exercise your own judgement for your own trades base on your own risk-aversion level and goals as an investor or a trader. The use of OTHER indicators and analysis in conjunction (tailored to your own style of investing/trading) will help improve confidence of your analysis, for you to determine your own trade decisions. ~ * ~ * ~ * ~ * ~ * ~ * ~ * ~ * ~ * ~ * ~ * ~ * ~ * ~ * ~ * ~ * ~ * ~ * ~ * ~ * ~ Please check out my other indicators sets and series, e.g. LIVIDITIUM (dynamic levels), AEONDRIFT (multi-levels standard deviation bands), FUSIONGAPS (MA based oscillators), MAJESTIC (Momentum/Acceleration/Jerk Oscillators), PRISM (pSAR based oscillator, with RSI/StochRSI as well as Momentum/Acceleration/Jerk indicators), PDF (parabolic SAR /w HighLow Trends Indicator/Bar-color-marking + Dynamic Fib Retrace and Extension Level) and more to come. Constructive feedback and suggestions are welcome. To continue to keep this strategy free to use, especially if it has benefited your trades, please consider tipping a little of any gains you've made to my HRT fund. =D cybernetwork @ EOS 37DzRVwodp5UZBYjCKvVoZ5bDdDqhr7798 @ BTC MPr8Zhmpsx2uh3F5R4WD98MRJJpwuLBhA3 @ LTC 1Je6c1vvSCW7V2vA6RYDt6CEvqGYgT44F4 @ BCH AS259bXGthuj4VZ1QPzD39W3ut4fQV5giC @ NEO rDonew8fRDkZFv7dZYe5w3L1vJSE51zFAx @ Ripple XRP 0xc0161d27201914FC0bAe5e350a193c8658fc4742 @ ETH GAX6UDAJ52OGZW4FVVG3WLGIOJLGG2C7CTO5ZDUK2P6M6QMYBJMSJTDL @ Stellar XLM xrb_16s8cj8eoangfa96shsnkir3wctdzy76ajui4zexek6xmqssweu85rdjxrt4 @ Nano ~ JuniAiko (=^~^=)v~ CYBER ENSEMBLE Estratégia Pine Script®por cybernetworkAtualizado 1172
QuantCat Chande Swinger StrategyQuantCat Chande Swinger This strategy is designed to be used on the 1 minute with mainly bitcoin, and cryptocurrencies. But parameters can be adjusted to ANY pair. After some long research about chande momentum oscillator, I decided to create a strategy using normal distribution percentage levels to snipe entries. This in turn on the 1 minute can create a nice profit over a consecutive amount of days, the end goal is to get a stronger version of this strategy running on a bot and print some money. This strategy is tightly defined, and can be loosened up to make more trades too- giving a higher sample size and better sharpe ratio. The strategy checks to see if the Chande value is in an extreme percentile based on the last few hundred chande values- if it is it will open a position. No stoploss or take profit implemented into the swinger yet, but this will be the next addition to really minimise loss and amplify potential profits. Any liquid crypto pair on the low timesframes will net a good result with this strategy. We also have a free 15M and 1H strategy available too. You can join our discord server to get live alerts for the strategies as well as speak to our devs! Link in signature below!!! Estratégia Pine Script®por QuantCat471
QuantCat Mom Finder Strategy (1H)QuantCat Momentum Finder Strategy This strategy is designed to be used on the 1 hour time frame, on all x/btc pairs. The beautiful thing is it plots the take profit, and stoploss for you for each entry- where I would say use the stoploss for sure and feel with water with how the price action is looking when in profit. In this strategy, I actually implemented my own trading style into building the strategy. Having to replicate my own trading strategy into an algorithm, I can't make it exactly perfect to how I would trade, but what I can do is try and program the parameters that give it the absolute best chance of making a big move with a small drawdown- which replicates part of my momentum trading style. Here I am using RSI, MACD, EMA and trend filtering values to find moments where there has been a momentum change to play the rest of the move. It only picks the best entries. There is always a 3-4 R/R move on average with with these trades, meaning 1 in 4 only need to hit to be a break even trader- where most of these strategies have about 35% hit rate. The stoploss is so crucial to minimise any damage from huge unexpected candles, the strategies can just be used for entries as well, you don't have to stick to the exact formula- of the long and short system, but this by itself is profitable. The system nets positive results on -ETH/BTC -LTC/BTC -XRP/BTC -ADA/BTC -NEO/BTC etc. We also have a free 15M strategy available too. You can join our discord server to get live alerts for the strategy as well as speak to our devs! Link in signature below!!!Estratégia Pine Script®por QuantCat22290
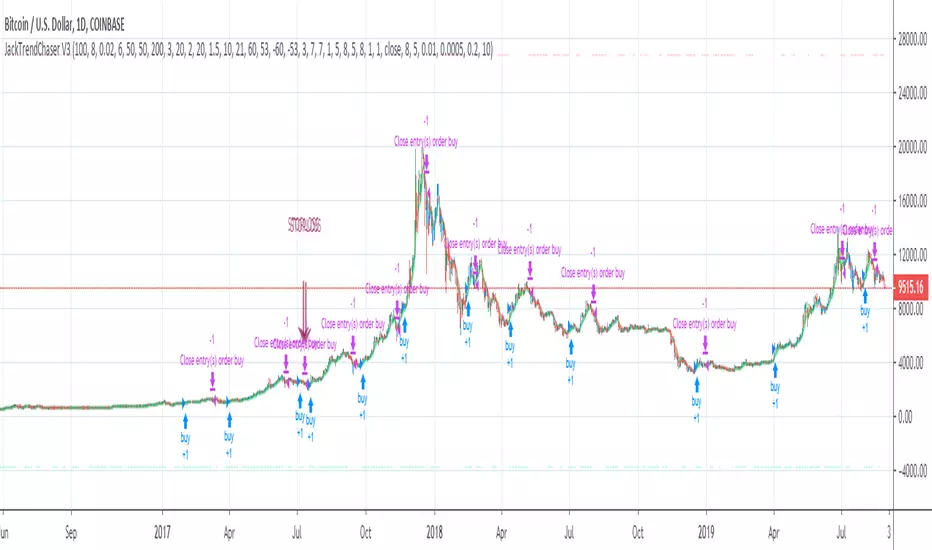
JackTrendChaser V4This is like V3 but with minor improvements - and this script is only protected which means that you are free to try it out! I would love to know your thoughts on this so please try it out and get back to me :) Link to V3: Estratégia Pine Script®por JackTz29
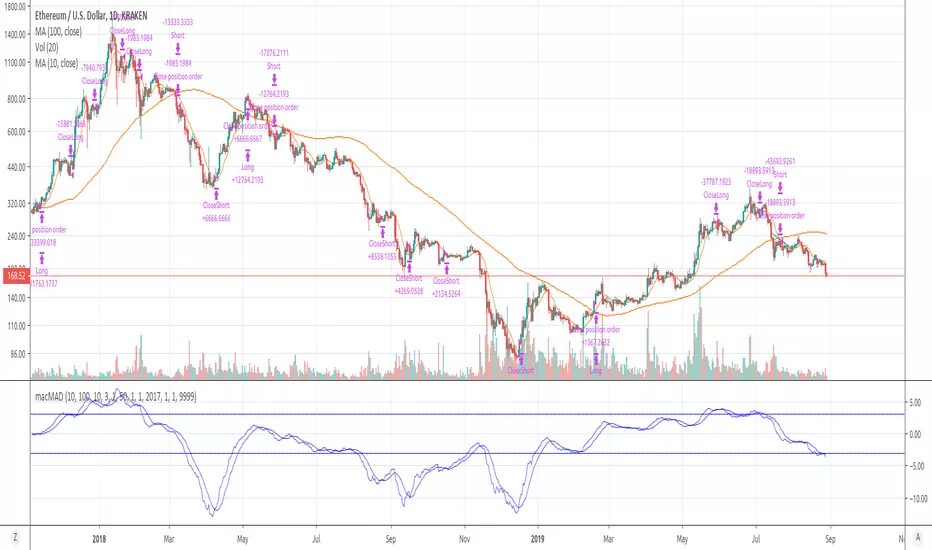
[macMAD] Free crypto strategy that just works How to actually make money on crypto? Not complicating your strategy (it causes overfitting) Trade long term (price movement behaves less random on larger scales) Contact me and I'll help you automate this strategy!Estratégia Pine Script®por gregoryberzin42
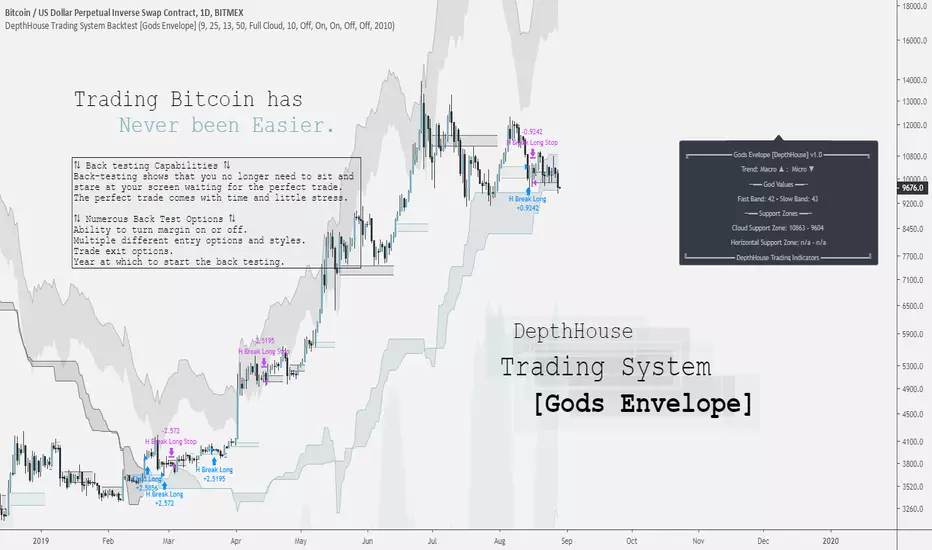
DepthHouse Trading System [Gods Envelope] Backtest StrategyCreated for Bitcoin! *All testing has been done on the 1 Day time frame of BTC USD pairs. Use at your own risk. DepthHouse Trading System Basics The Cloud: The cloud is used in a very similar manner as the ichimoku cloud. A complete cross above or below the represents a macro trend change. The cloud then could be used as dynamic support and resistance zones. By default there is no smoothing to the full cloud. If you wish to add smoothing, you can change the ‘Trend Base On’ option to ‘Modded Cloud Average’ to add price action and smoothing into the cloud’s calculations. The Modded Cloud can then be used in the same manner as the Full Cloud. Generally, the Full Cloud is more forgiving and has less Macro Trend changes. By default, this option is turned off. The support or resistance zone created will be shown on the info panel on the right. Horizontal Levels: A Horizonal zone is generated each time there is a micro level trend change. For example, as soon as a positive micro trend change occurs a green horizontal level will be plotted. These levels then can be used as temporary support and resistance zones. The Horizontal Break Trading Strategy is entirely based on these levels. These levels are also shown on the info panel on the right. The Envelope Itself: (by default this is off) By selecting the Overbought and Oversold Ranges option, a cloud envelope will appear around the price action. This envelope represents the overbought and oversold ranges. If the price action should go into these zones, the info panel on the right will show ‘CAUTION’ beside the God Values as this signals that the pair is either overbought or oversold. The God Values: The God values are listed on the info panel on the right. These are the values created by the Godmode indicator. Generally, below 20 or above 80 it signals for caution as the price action has overextended itself. The Back-Test Strategy Options: ⇅ - Child Fomo Positioning: Child Fomo Positioning strategy is entirely based on the macro trend change with the center cloud. As soon as there is a complete candle close above or below the cloud and a trend change takes place. The back-test places a market order as soon as the next candle opens. By default, it then will not close this position until the price action fully crosses the cloud once again. ⇅ - Horizontal Break Trading: Horizontal Break Trading Strategy is entirely based on the horizontal levels generated and the macro trend direction. For example, say the Macro Trend is up, and a green, positive horizontal level is formed. As soon as a complete candle closes above the upper level of the positive zone, a limit order is placed in hope that the price action comes back down and retests, filling the order. This long will not close then until a negative level is formed. As soon as a negative level is formed a stop/loss order is placed on the lower level of the horizontal support zone. It will then do the opposite in a bearish trend, and margin trading is turned on. ⇅ - Parent Positions : Parent Positioning Strategy is based on the overall trend and the center cloud levels. This strategy has limit orders waiting on the level of the cloud that is closest to the price action. Therefore, using this strategy alone, the back-test system waits for the trend to be confirmed, and then follows the price action with limit orders waiting on the cloud to be retested. By default this order does not close until a Marco trend change occurs. ⇅ - Take 50% Partial Profits: This options allows the back-test to take 50% profit or loss when one of the two options occur. Horizontal Break: This would close 50% of the position in the same manner it would close a trade using the horizontal break trading system. God Values: Once the price action enters the oversold or overbought clouds, it would then place a close order as soon as the price action exits the cloud. ⟲ - Backtest Year Start Date : Start year of the back-testing. If set to ex. 2017, the back-test will not calculate any trades that took place before Jan. 1 of 2017. ⚖ - Margin Trading : By default, margin trading is turned off. Simply switch this option to on the enable ‘Short Trading’ into the strategy back-test. Notes: If you are back testing multiple strategies at the same time, you must increase the pyramiding to correspond to the number or strategies. My Favorite Settings: Margin = Off Pyramiding = 2 [Settings → Properties → Pyramiding → 2 orders Child Fomo Positioning = On Horizontal Break Trading = On Everything else off 😊 DISCLAIMER: Past performance does not guarantee future results. Use at your own risk. Estratégia Pine Script®por oh92Atualizado 5353208
BTC strategy for margin tradingAlmost identical to the one I published before, but this one includes short orders as well. I didn't spend much time backtesting, so there may be a different set of parameters that gives better results. Please let me know if you find something!Estratégia Pine Script®por CredibleHulk44228
REKT ZONES StrategyXBTUSD REKT ZONES STRATEGY. Best used on 15 min chart! Estratégia Pine Script®por chchodler48
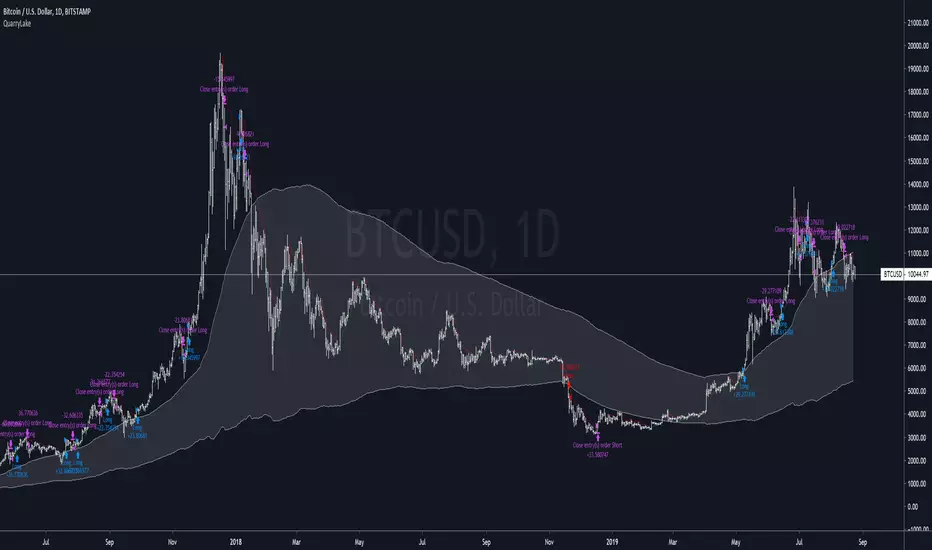
QuarryLake - An ATR base strategyThis strategy consists of 3 indicators that I found works quite well together. Keltner Channel, Waddah Attah Explosion, and Volatility Stop. You can find WAE here KC Period = 200 KCATR = 5 Vstop Period = 3 Vstop Mult = 1.5 Long when close > KC, close > Vstop, WAE trendUp Short when close < KC, close < Vstop, WAE trendDown Works well on BTCUSD XBTUSD, as well as other major liquid Pair. This strategy utilized a modified Kelly position sizing for BTCUSD Bitstamp, feel free to modify it to your needs. More information can be found here dqydj.com Feel free to follow me on Twitter @Lancelot_Auger for more free Alpha.Estratégia Pine Script®por Lancelot_Augur1150
GetTrend Strategy (modified & ported to PS4)This is a port to PS4 of an amazingly simple solution that may have good prospects as a standalone indicator, an add-on or an integral part of a trading system. Many thanks to its authors and contributors. Estratégia Pine Script®por capissimoAtualizado 3636730
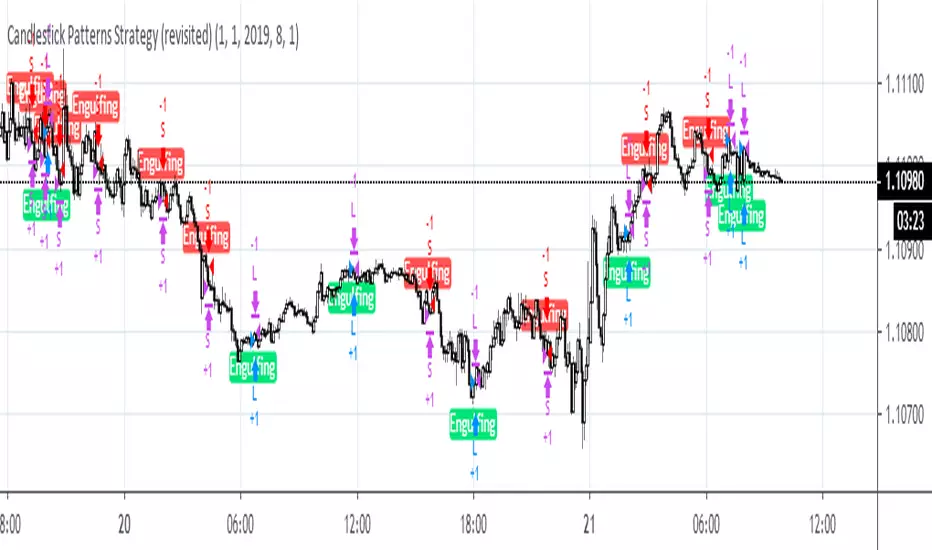
Candlestick Patterns Strategy (revisited)This strategy is used as a benchmark to see how it compares with other strategies posted by me recently. In all, the below collection of candlestick patterns appears to be one of the best among the ones that can be found here, imho. Estratégia Pine Script®por capissimo99593