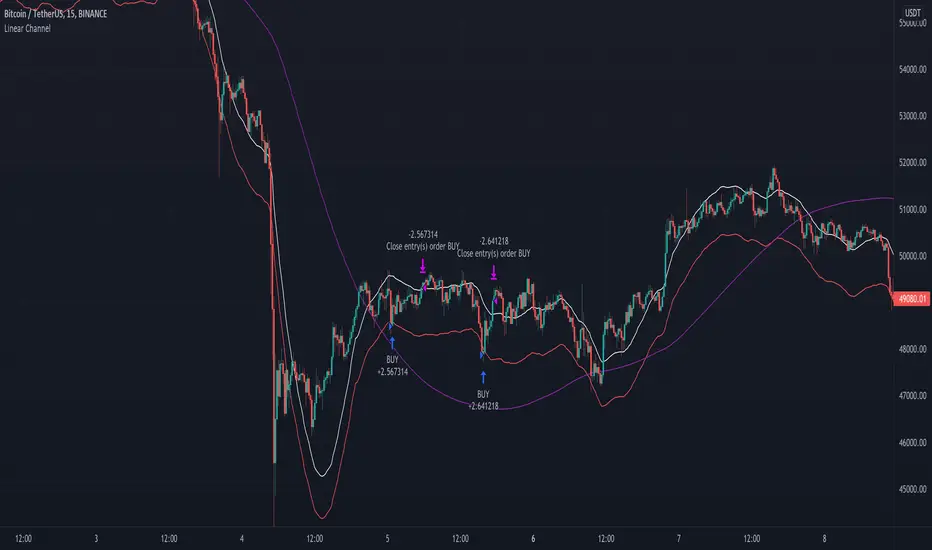
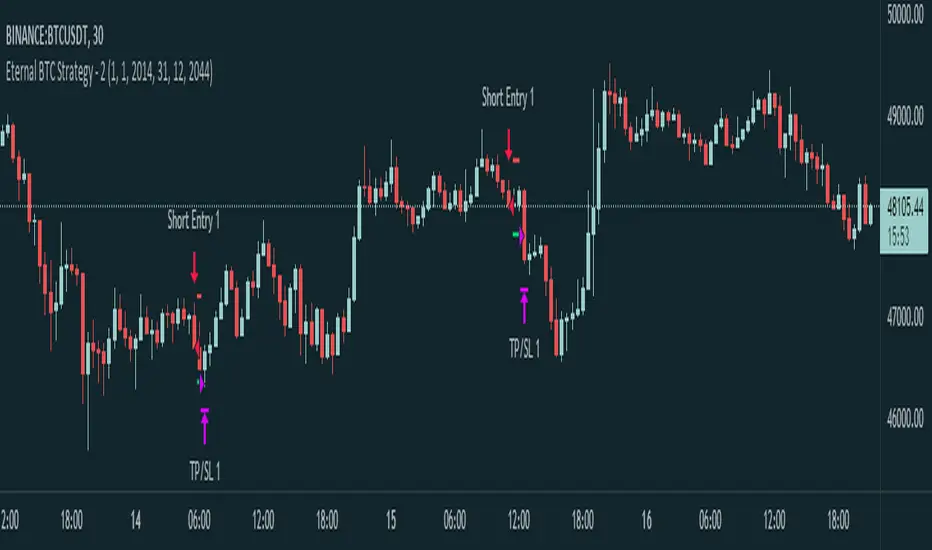
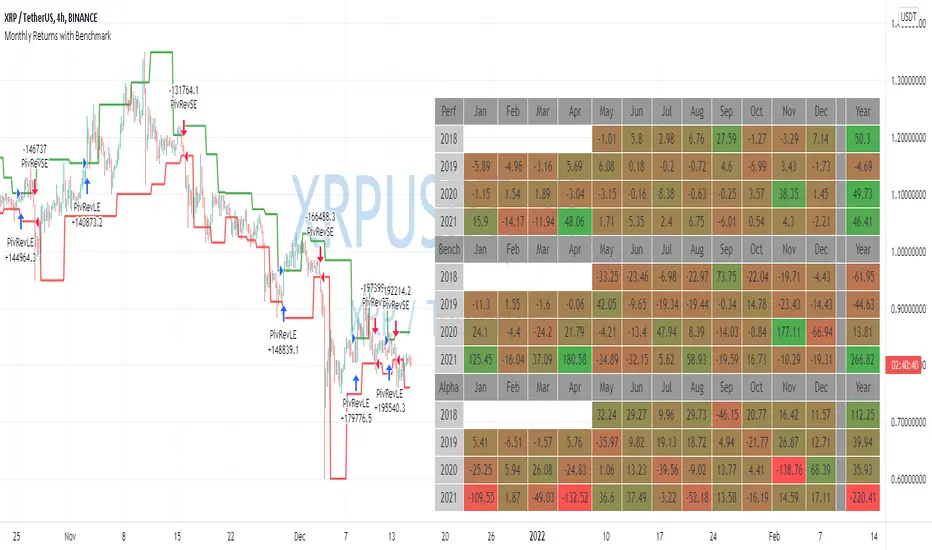
TEMA/HMA/VWMACD - Short Strategy 4HAs we can discover by studying the history of BTCUSD, the fall is always swift. Confirmation of this - today's collapse. In this strategy, an attempt is made to catch such drop by using quick entry and quick exit.
Let's describe what this strategy consists of:
• TEMA (you can find this strategy separately on this page or on platform)
• VWMACD
• HMA
• Take-profit and Stop-losses
Logic:
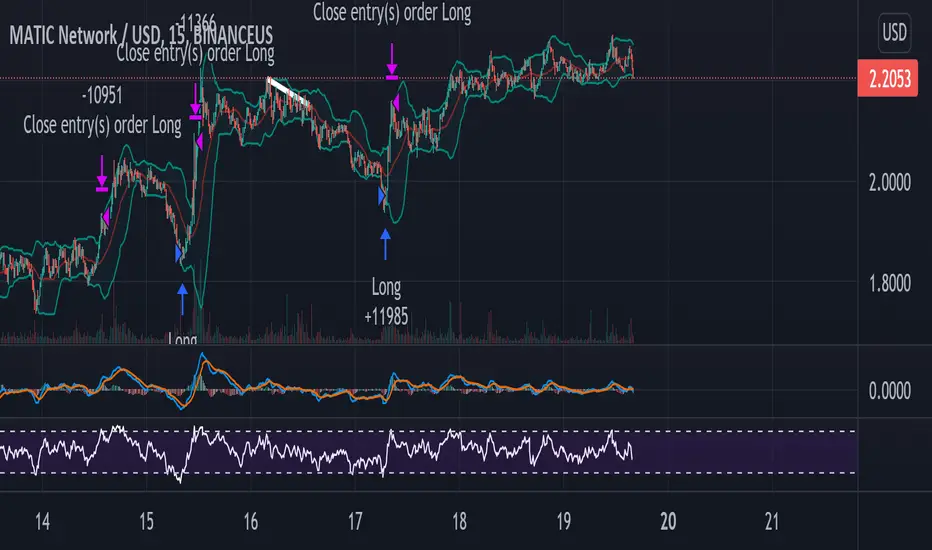
Firstly we VWMACD (the difference between VWMACD and simple MACD is only in the way of calculating moving average) and plot it as a histogram.
Then HMA is adding as a trend filter. For easy understanding let's plot it now on chart separately.
Next step is to create and add TEMA. After it is needed to subtract slow TEMA from fast TEMA and plot this value around 0 on histogram. This is the main decision for the implementation of the short trade.
ENTRY the trade:
When VMACD is below 0 and price (src = close) is below the HMA and TEMA below 0.
CLOSE the trade:
When VWMACD is upper than 0 or price is upper than HMA or TEMA is upper than 0
You can find more strategies on tradingammo.pro.
Estratégia Pine Script®