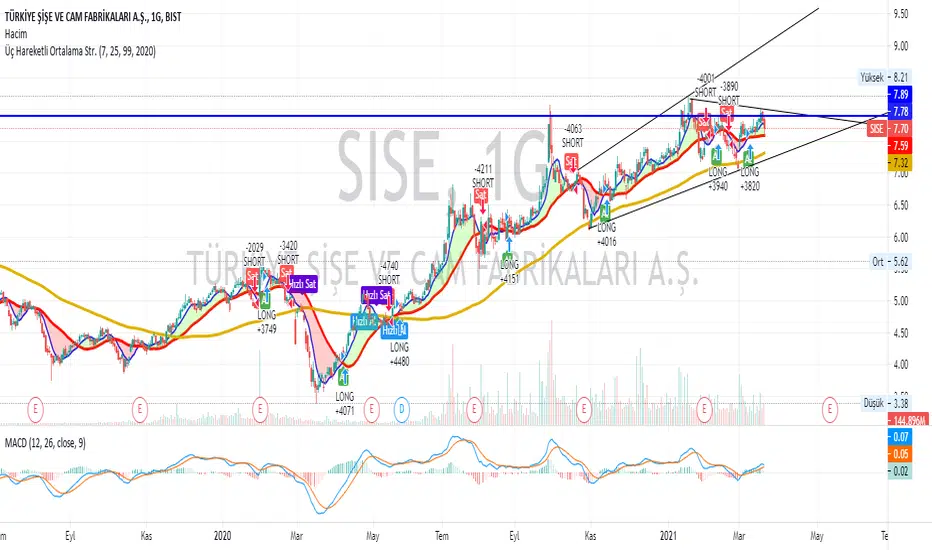
Three moving average strategies
If the short term (Default 7) moving average cuts the medium term (default 25) moving average, BUY. Conversely, it generates the SELL signal. If the long term (Default 99) moving average cuts its short term moving average, Quick SELL. Conversely, it can be interpreted as Fast SELL. You can change the moving average and the number of days as you wish, and you can trade in the short or long term. I hope it was useful.
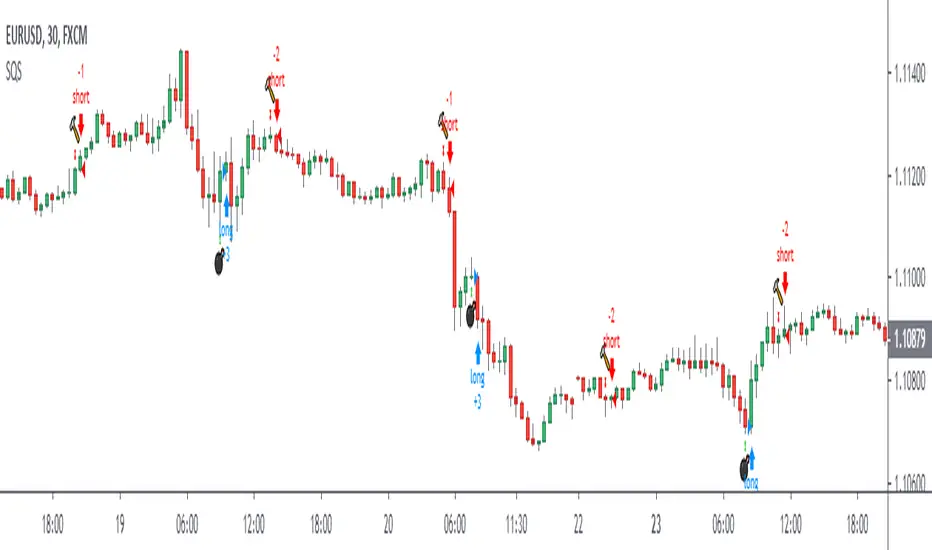
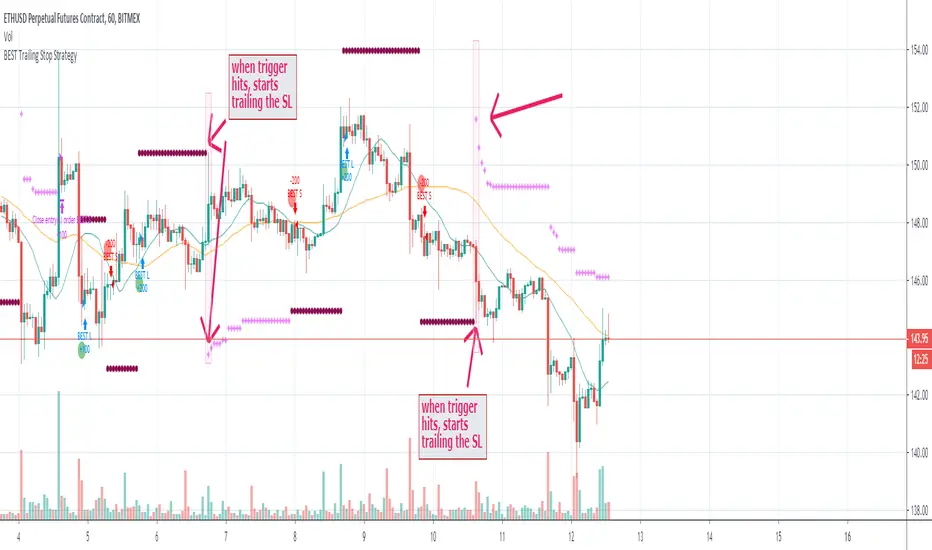
Estratégia Pine Script®